The INTERNET Database of Periodic Tables

Periodic Tables providing data about the chemical elements, rather than novel formulations:
2020
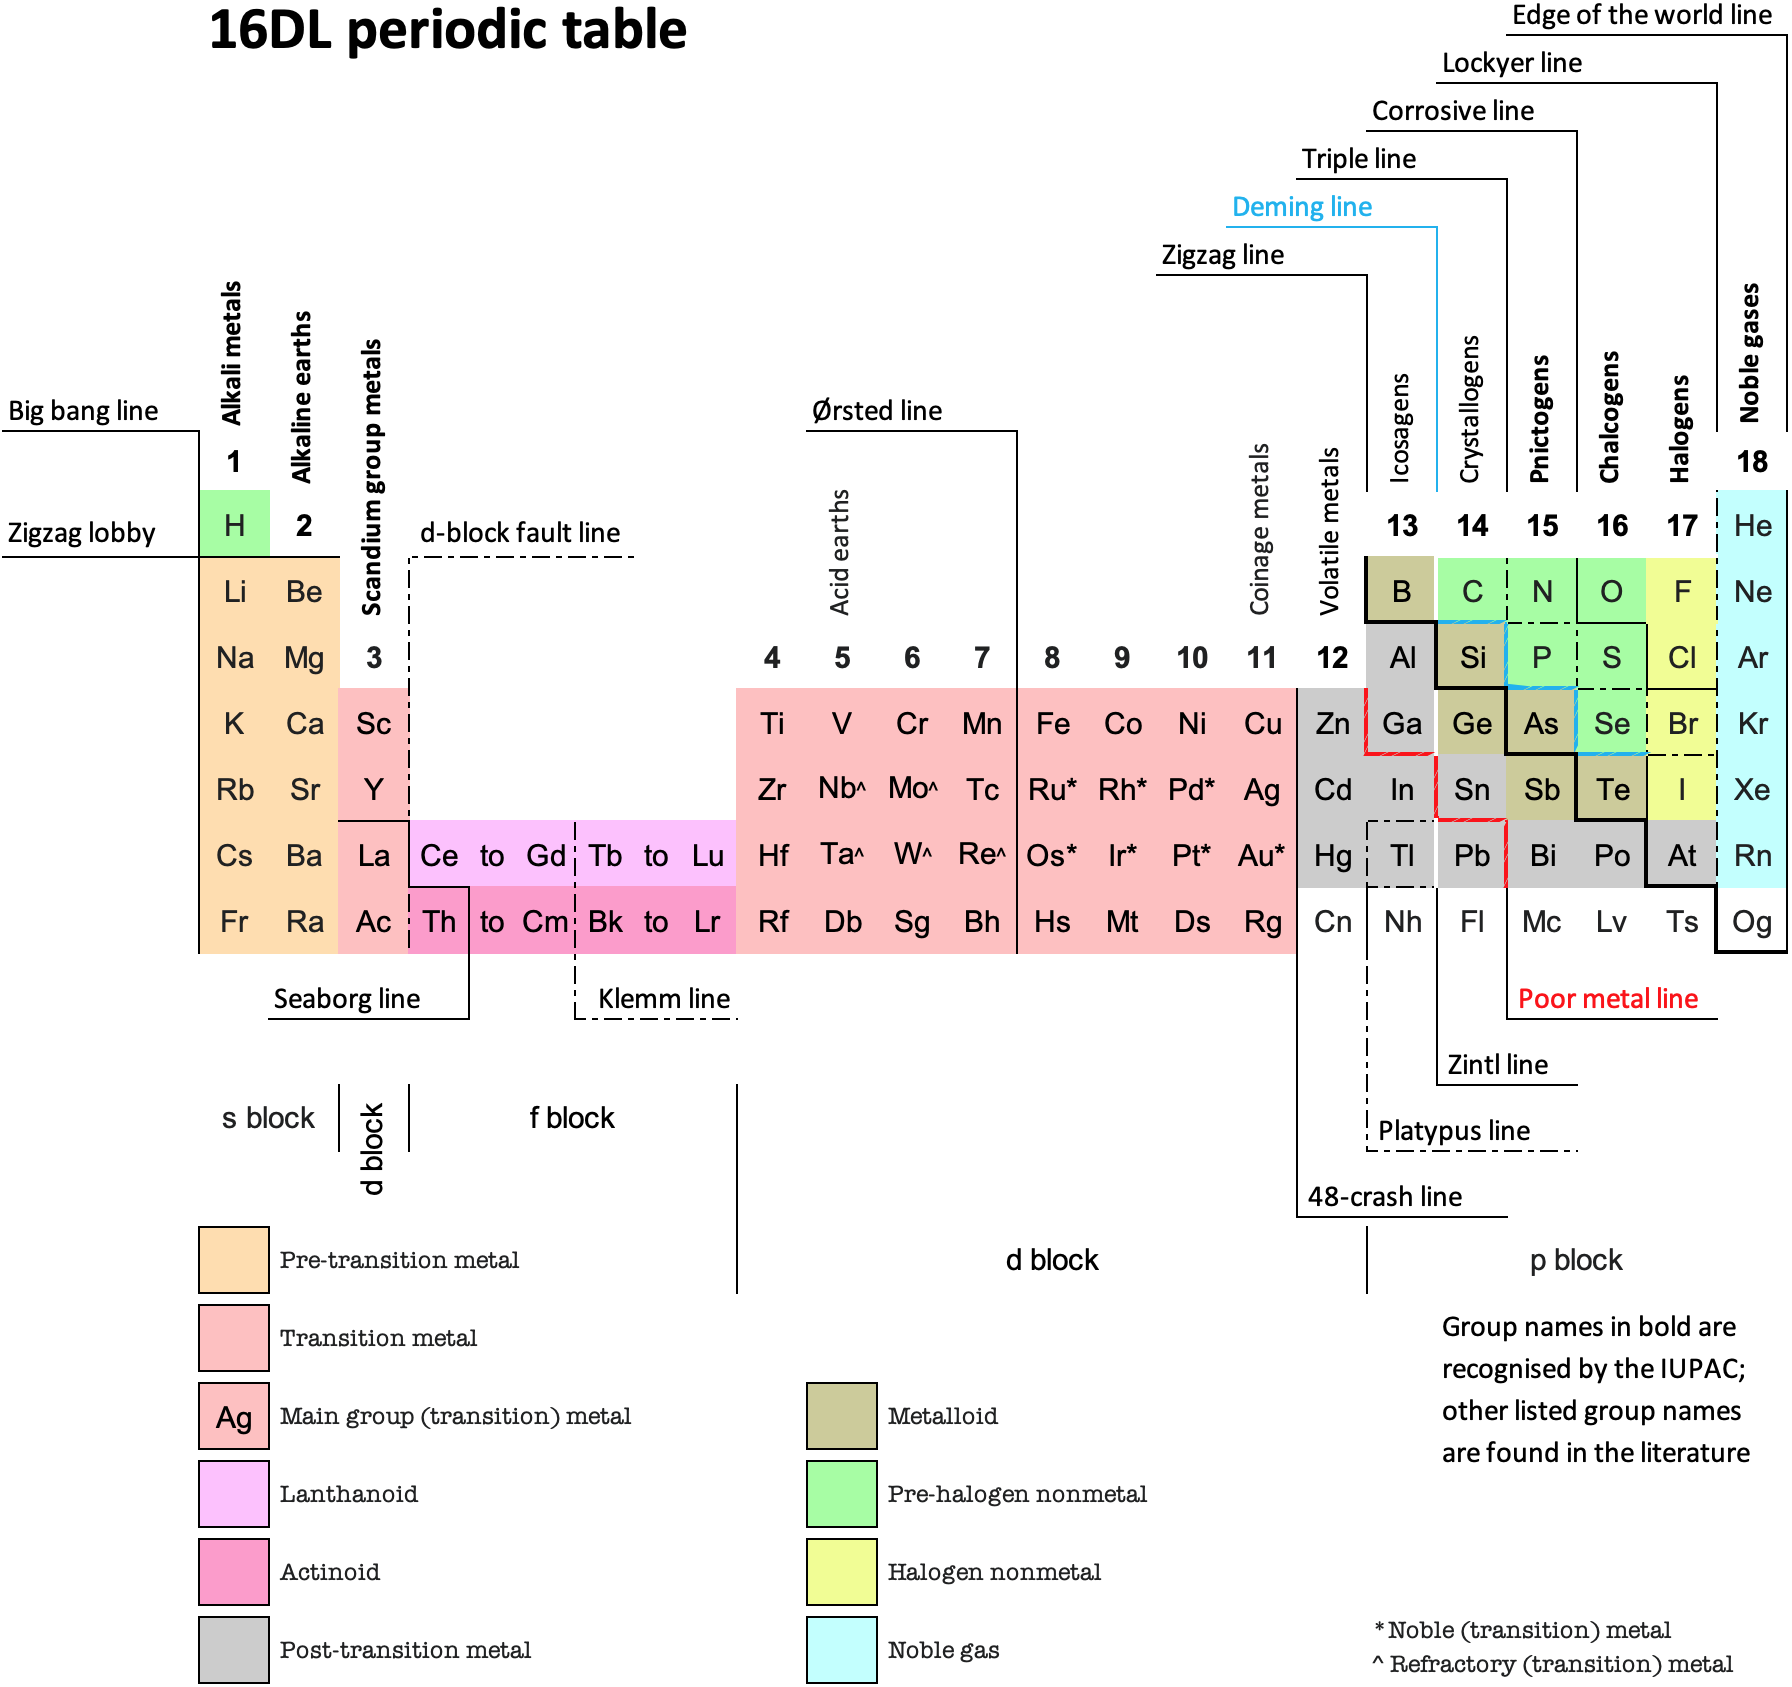
16 Dividing Lines Within The Periodic Table
René Vernon points out that there are 16 dividing lines within the periodic table.
A-Z Dividing Lines:
48-crash line: Named after the dramatic reduction in physical metallic character after group 11, Cd being Z = 48. Group 12 show few transition metal attributes and behave predominantly like post-transition metals.
Big bang line: H makes up about 73% of the visible universe.
Corrosive line: O, F, Cl = most corrosive nonmetals.
d-Block fault line: Group 3 show little d-block behaviour; group 4 is the first in which characteristic d-block behaviour occurs.
Deming line: Demarcates the metalloids from the pre-halogen nonmetals. The "reactive" nonmetals to the right of the metalloids each have a sub-metallic appearance (C, O, Se, I).
Edge of the world line: No guesses for this one.
Klemm line: Klemm, in 1929, was the first to note the double periodicity of the lanthanides (Ce to Lu). Lockyer line: After the discoverer of He, the first element not found on Earth.
Ørsted line: After the magnetic effects believed to be responsible for Mn having a crystalline structure analogous to white P; Tc: First radioactive metal; Re: Last of the refractory metals; "most radioactive" of the naturally occurring elements with stable isotopes. Fe: First of the ferromagnetic metals; Ru: First noble metal; Os: Densest of naturally occurring metals. The number of unpaired d electrons peaks in group 7 and reduces thereafter.
Platypus line: Tl shows similarities to Rb, Ag, Hg, Pb.
Poor metal line: Most metals (80%) have a packing factor (PF)3 68%. Ga: Has a crystalline structure analogous to that of iodine. BCN 1+6.* PF 39.1%. Melts in your hand. In: Partly distorted structure due to incompletely ionised atoms. BCN 4+8. PE 68.6%. Oxides in preferred +3 state are weakly amphoteric; forms anionic indates in strongly basic solutions. Tendency to form covalent compounds is one of the more important properties influencing its electro-chemical behaviour. Sn: Irregularly coordinated structure associated with incompletely ionised atoms. BCN 4+2. PF 53.5%. Oxides in preferred +2 state are amphoteric; forms stannites in strongly basic solutions. Grey Sn is electronically a zero band gap semimetal, although it behaves like a semiconductor. Diamond structure. BCN 4. PF 34.0%. Pb: Close-packed, but abnormally large inter-atomic distance due to partial ionisation of Pb atoms. BCN 12. PF 74%. Oxide in preferred +2 state is amphoteric; forms anionic plumbates in strongly basic solutions. Bi: Electronic structure of a semimetal. Open-packed structure (3+3) with bonding intermediate between metallic and covalent. PF 44.6%. Trioxide is predominantly basic but will act as a weak acid in warm, very concentrated KOH. Can be fused with KOH in air, resulting in a brown mass of potassium bismuthate.
Seaborg line: No f electrons in gas phase La, Ac and Th atoms.
Triple line: N = gas; S = solid; Br = liquid.
Zigzag lobby: H needs no intro. Li: Many salts have a high degree of covalency. Small size frequently confers special properties on its compounds and for this reason is sometimes termed 'anomalous'. E.g. miscible with Na only above 380° immiscible with molten K, Rb, Cs, whereas all other pairs of AM are miscible with each other in all proportions. Be: Has a covalent component to its otherwise predominately metallic structure = low ductility. Lowest known Poisson's ratio of elemental metals. Amphoteric; predominately covalent chemistry atypical of group 2. Some aspects of its chemical properties are more like those of a metalloid.
Zigzag line: Eponymous metal-nonmetal dividing line.
Zintl line: Hypothetical boundary highlighting tendency for group 13 metals to form phases with a various stoichiometries, in contrast to group 14+ that tend to form salts with polymeric anions.
* BCN = bulk coordination number
2012
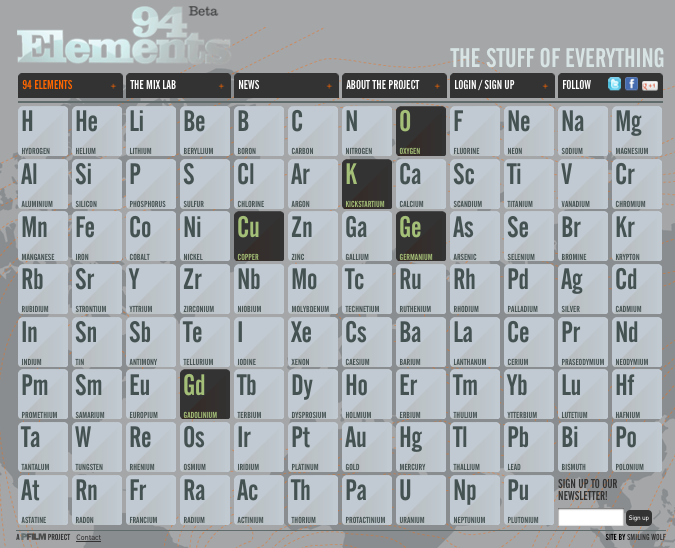
94 Elements: The Stuff of Everything
There are 94 naturally occuring elements, from hydrogen to plutonium. Together they make up everything in the world.
94 Elements is a global filmmaking project, exploring our lives through the lens of the elements. Everything that surrounds us is made from these 94 building blocks, each with its own properties and personality. Our own bodies are mostly made from just 6 of them.
The stories of the elements are the stories of our own lives. They reveal the patterns of our economies and the state of our relationships with our natural resources. The project is in part a celebration of the art of documentary film and some of the best filmmakers working today are making new films for the project. There'll also be opportunities for talented new and emerging filmmakers and animators to pitch their own films, with the winners chosen by you - the project community.
2022
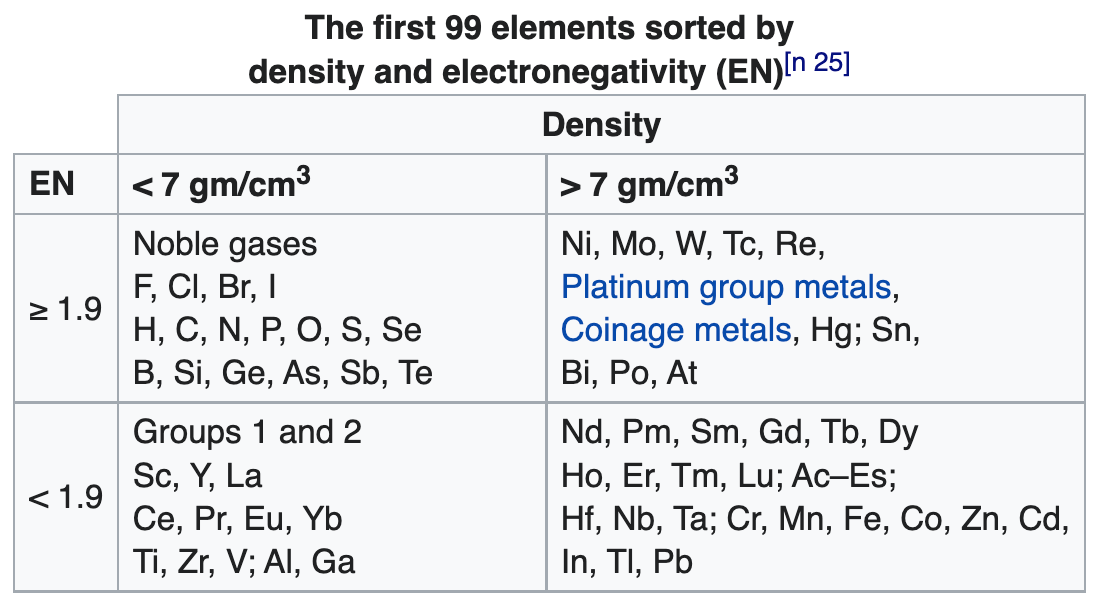
99 Elements Sorted by Density & Electronegativity
René Vernon writes:
"A little while I ago I noticed that a scatter plot of EN (revised Pauling) and density values of the elements resulted in a nice distribution, as per the table below.
"According to Hein and Arena (2013) nonmetals have low densities and relatively high EN values; the table bears this out. Nonmetallic elements occupy the top left quadrant, where densities are low and EN values are relatively high. The other three quadrants are occupied by metals. Of course, some authors further divide the elements into metals, metalloids, and nonmetals although Odberg argues that anything not a metal is, on categorisation grounds, a nonmetal.
Note 25 says:
(a) Weighable amounts of the extremely radioactive elements At (element 85), Fr (87), and elements with an atomic number higher than Es (99), have not been prepared.
(b) The density values used for At and Fr are theoretical estimates.
(c) Bjerrum (1936) classified "heavy metals" as those metals with densities above 7 g/cm^3.
(d) Vernon (2013) specified a minimum electronegativity of 1.9 for the metalloids.
- Bjerrum, N (1936). Bjerrum’s Inorganic Chemistry. London: Heinemann
- Hein, M; Arena, S (2013). Foundations of College Chemistry. Hoboken: John Wiley & Sons. pp. 226, G-6. ISBN 978-1-118-29823-7.
- Oderberg DS 2007, Real Essentialism, Routledge, New York, ISBN 978-1-134-34885-5
- Vernon R 2013, "Which elements are metalloids?", Journal of Chemical Education, vol. 90, no. 12, 1703?1707, doi:10.1021/ed3008457
2019
Abundance by Atomic Number, Z
An article in De Gruyter Conversations: The Periodic Table & The Lanthanides by Simon Cotton has this interesting chart of elemental abundance with respect to 106 atoms of Si.
The image source is http://upload.wikimedia.org/wikipedia/commons/0/09/Elemental_abundances.svg

Thanks to René Vernon for the tip.
1970
Abundance of the Elements
A 1970 periodic table by Prof. Wm. F. Sheehan of the University of Santa Clara that claims to show the elements according to relative abundance at the Earth's surface. [However, we dispute the relative areas given to the various elements; there is almost no helium at the Earth's surface, for example.] Click the image to enlarge:
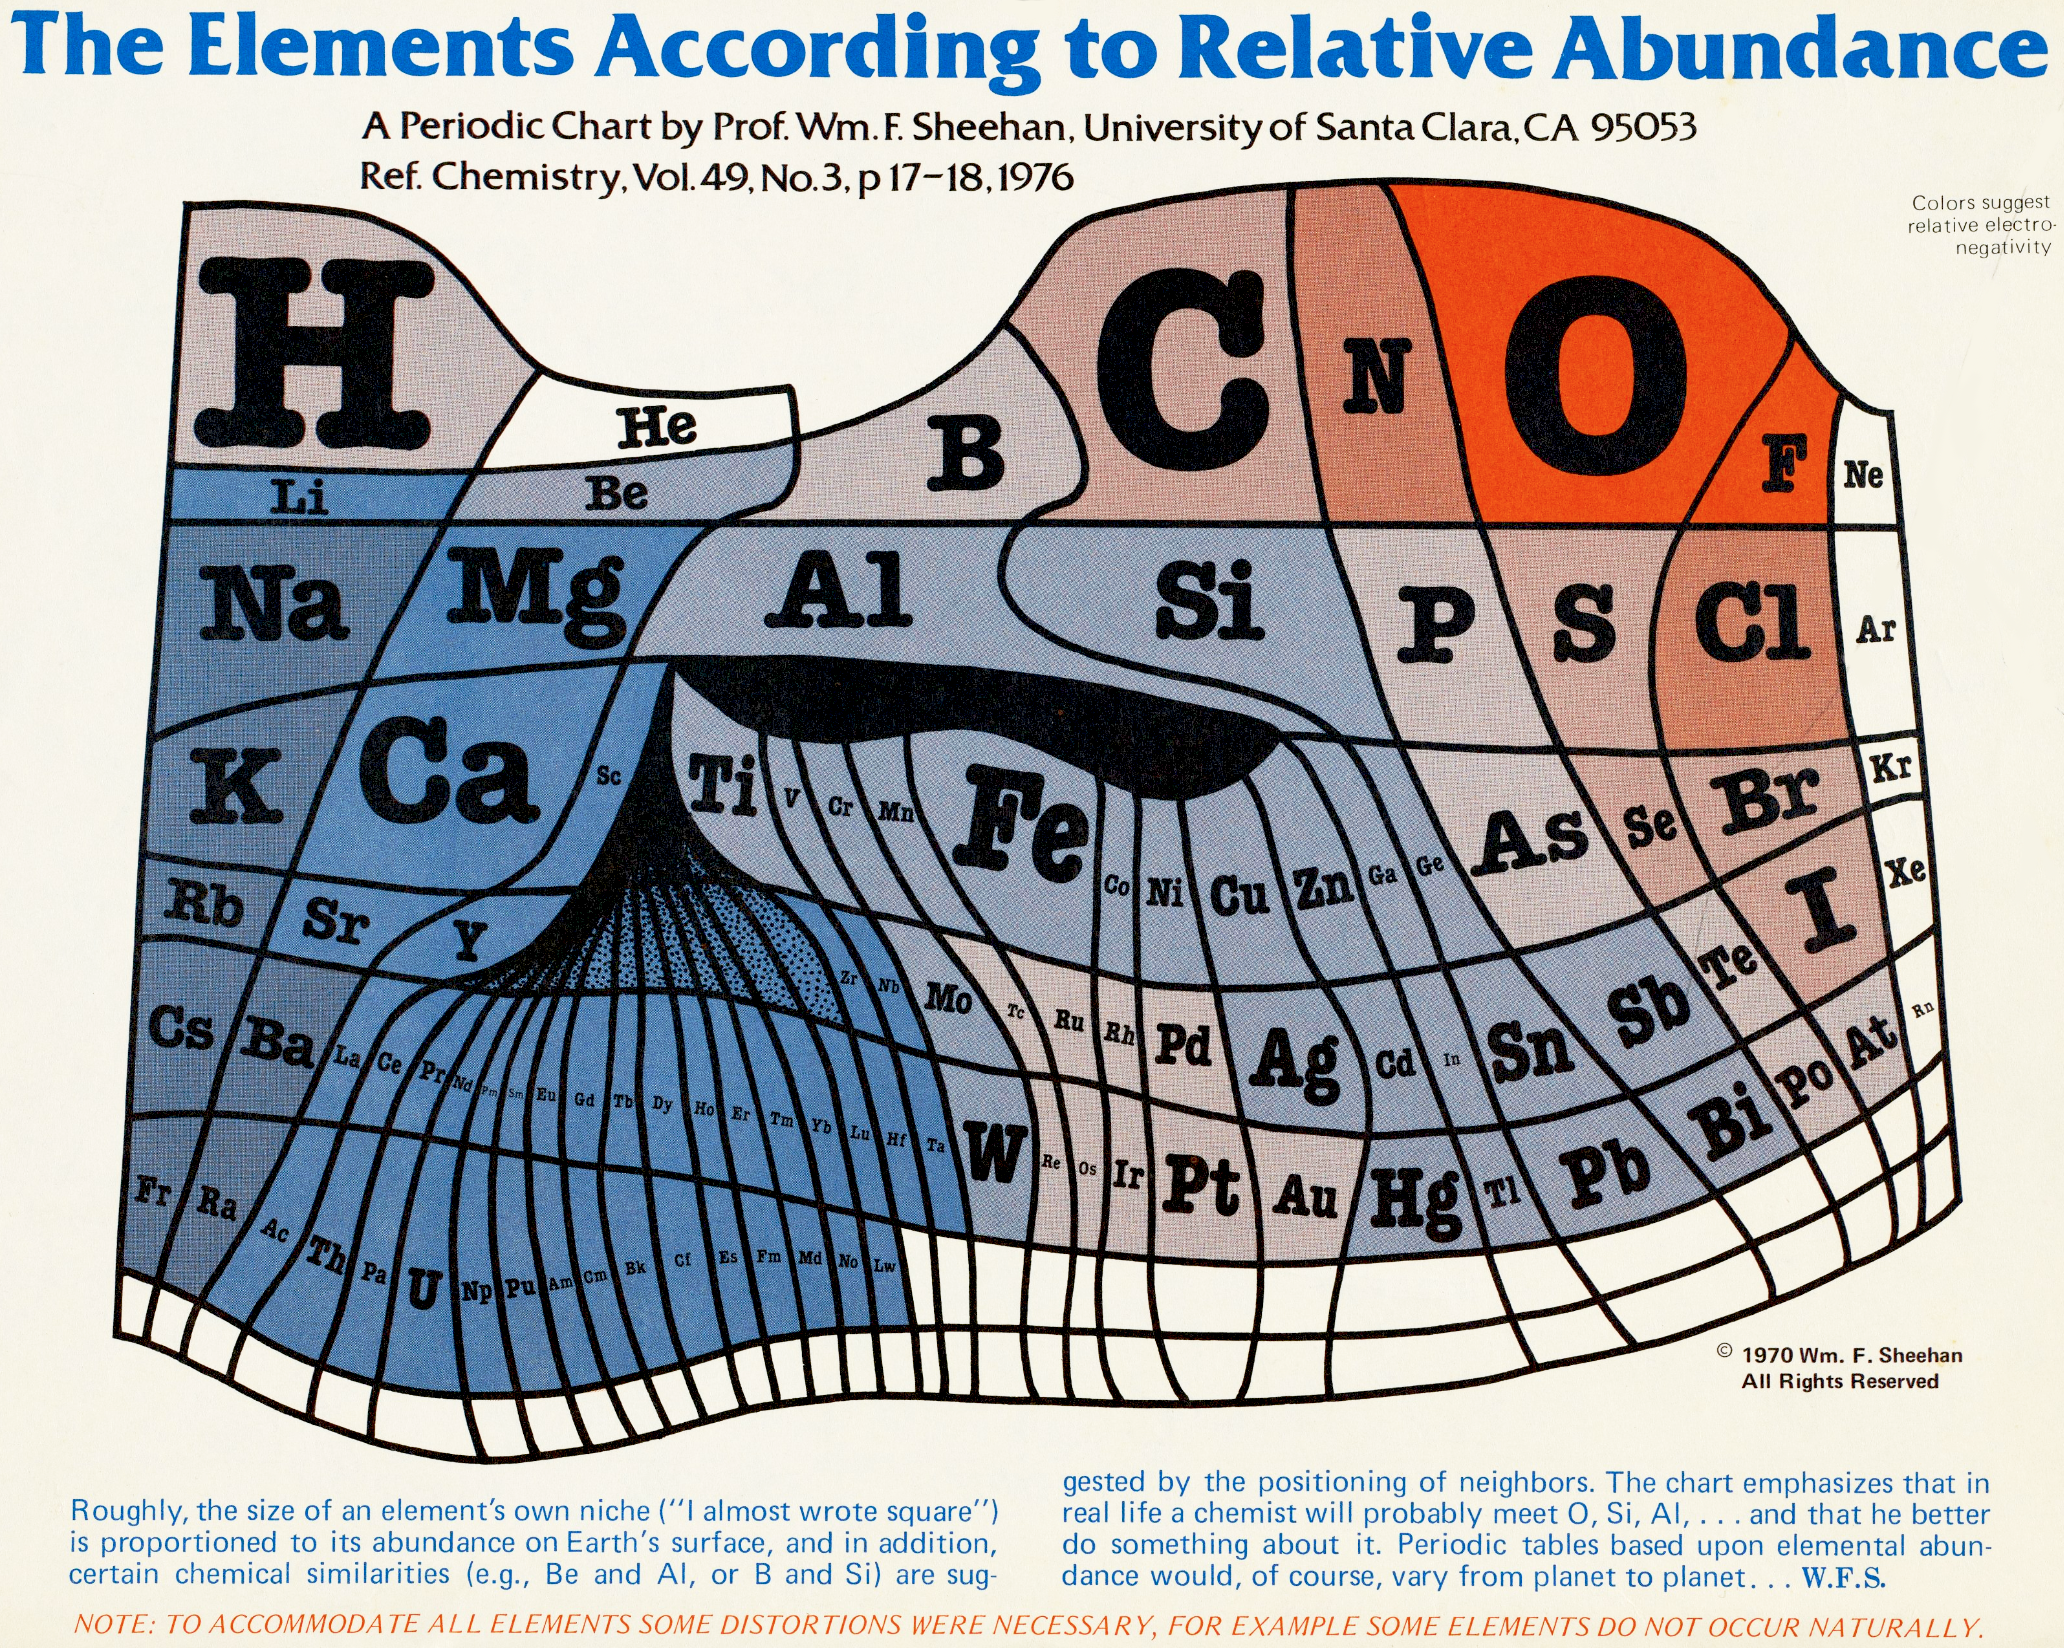
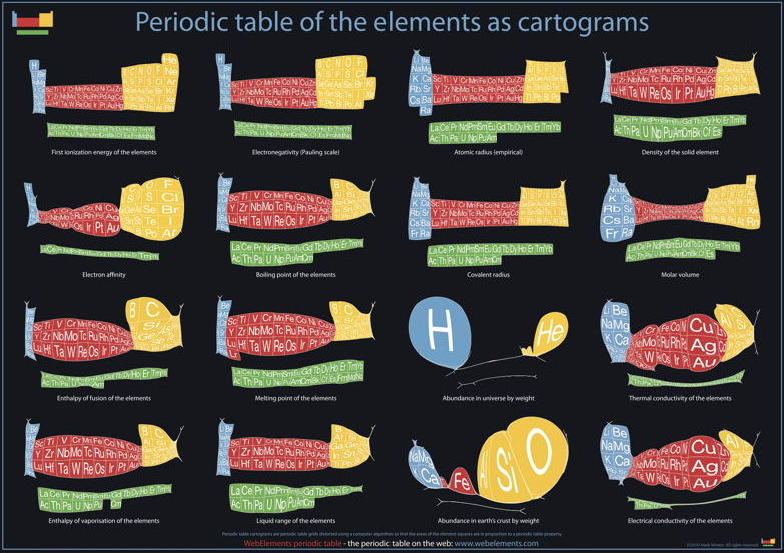
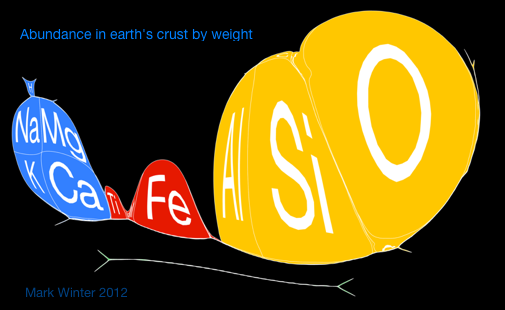
Below are some cartiogram representations, including the relative abundance of the elements in the Earth's crust, from Mark Winter's WebElements website:
2007
Abundance: Solar System
From Wikipedia, a chart of Solar System Abundances:

2018
Acid-Base Behavior of 100 Element Oxides
Acid-Base Behavior of 100 Element Oxides: Visual and Mathematical Representations by Mikhail Kurushkin and Dmitry Kurushkin. J. Chem. Educ. 95, 4, 678-681.
A novel educational chart that represents the acid-base behavior of 100 s-, p-, d-, and f-element oxides depending on the element's electronegativity and oxidation state was designed. An updated periodic table of said oxides was developed. A mathematical criterion based on the chart was derived which allows prediction of the behavior of unfamiliar oxides:
1998
American Elements
Supplier & Element Industrial Information: American Elements
2008
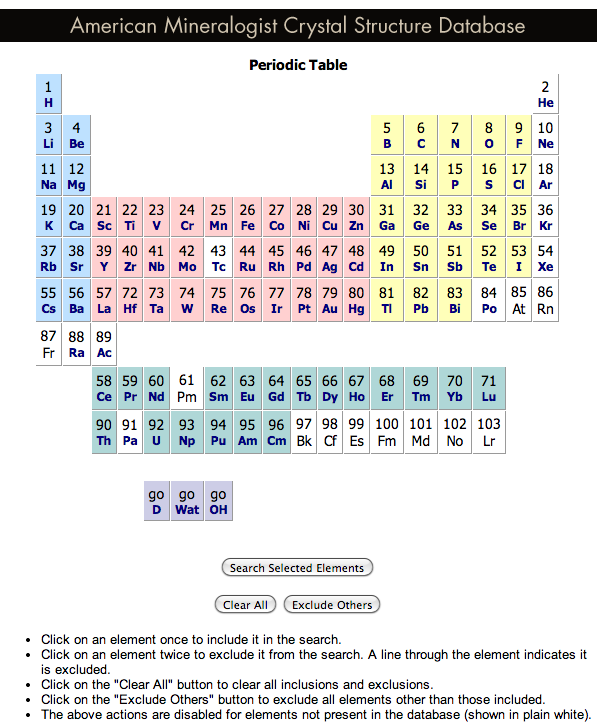
American Mineralogist Crystal Structure Database Periodic Table
A periodic table front end to the American Mineralogist Crystal Structure Database.
Clicking on an element gives access to the database searches. Conveniently, sets of elements can be selected or excluded:
2001
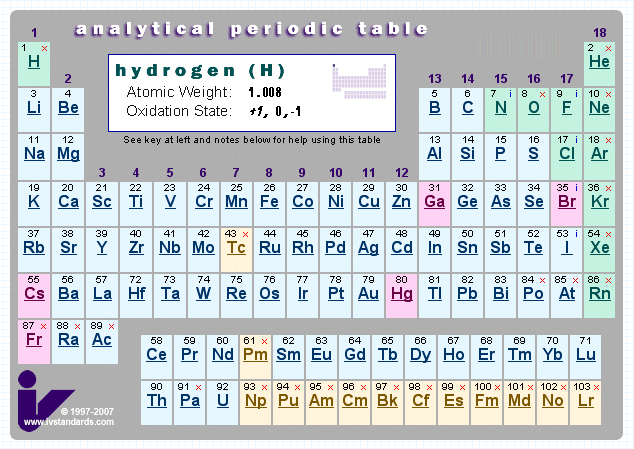
Analytical Chemist's Periodic Table
This PT gives information about storage and analysis of the elements.
2020
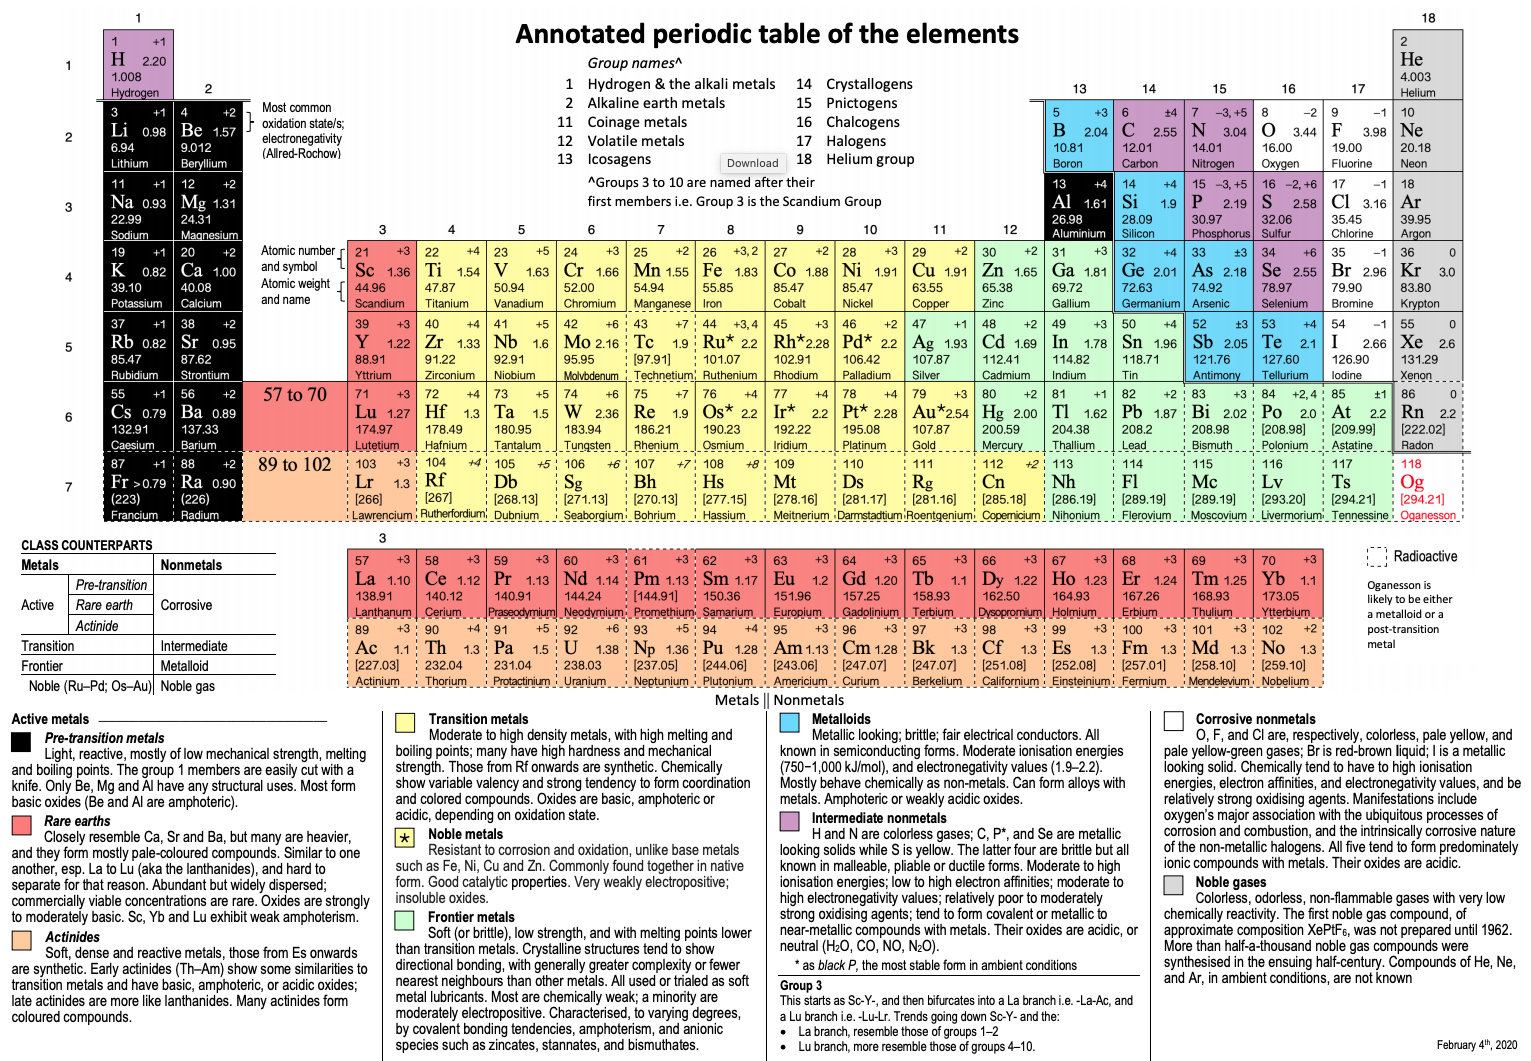
Annotated Periodic Table
From René Vernon's paper, Vernon, R.E. Organising the metals and nonmetals. Found Chem (2020). https://doi.org/10.1007/s10698-020-09356-6 (in the supplementary material).
Click image to enlarge.
2015
Anomalous Electronic Structures
Eric Scerri has supplied two periodic tables showing "anomalous configurations for gas phase atoms, highlighted in yellow, and for condensed phase atoms, purple." (The f-block anomalies for condensed phase are yet to be calculated.)
Read more in Eric's short article for the RSC.


2020
artlebedev's 100,000 Permutation Periodic Table of The Elements
Moscow-based design company Art. Lebedev Studio have released a new Periodic Table which can be adapted for any task.
- Since 1869, Mendeleev's periodic law has been widely regarded as one of the most ground-breaking advances in our understanding of the laws of nature. Used around the world in classes, lecture halls, and laboratories, the periodic table helps us to understand the elements that make up our world – and the relationships between them.
- Despite this, people have never been able to agree on which information the perfect table should include. What may be useful in a professional context, for example, would be unbearably complex for a student. On the other hand, showing each element's characteristics in full would make the table almost impossible to navigate. This has always resulted in an awkward compromise between simple and detailed.
- Art. Lebedev Studio made an adaptable table which lets users compare values, reveal patterns, and make their own discoveries. If a student only needs to see the element symbols, they can simply omit the other parameters. If someone wants to find out which country discovered the largest number of elements, they can include the flags of each nation's achievements (spoiler: it's the UK with 24).
- As well as liberating scientists from the limitations of fixed tables, the Studio also focused on improving the table's appearance. Designers came up with a clean, readable typeface which makes each element almost feel like a standalone design. They also made it highly adaptable, allowing users complete control over everything from nomenclature to background and cell colours.
- With over 100 000 permutations, users are sure to find the right table for them – whether they are a lab technician, lecturer, or student.
2006
Astronomer's Periodic Table
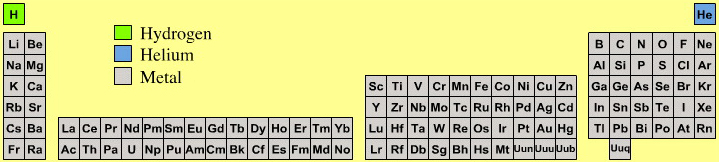
Highly amusing for chemists is the astronomer's periodic table because astronomers consider there to be three types of element:
- hydrogen
- helium
- metal
Yup, cosmologists and other professional star gazers consider all elements, atomic number three and up, to be metals.
By Mark Leach
2004
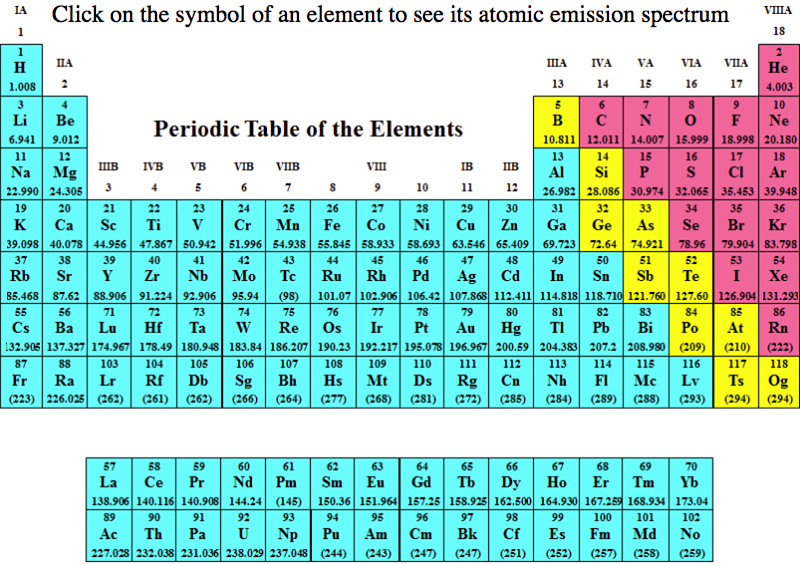
Atomic Emission Spectra Periodic Table
Department of Chemistry at PennState has a dynamic periodic table, here, which shows the atomic emission spectra of the elements:
2005
Atomic Radii Periodic Table
By Mark Leach
2012
Atoms, Orbitals & The Periodic Table
One of several animations and explanations/realisations of quantum physics from Data-Burger, scientific advisor: J. Bobroff, with the support of: Univ. Paris Sud, SFP, Triangle de la Physique, PALM, Sciences à l'Ecole, ICAM-I2CAM.
Mark Leach writes:
"What I particularly like about this video is that it shows the quantum fuzziness of the atoms. This explains/shows how and why induced-dipole/induced-dipole (London force) interactions occur, an important class of van der Waals interaction. At any moment, the electron distribution is not perfectly spherical, which means that there is an instantaneous dipole on the atom. This instantaneous dipole is able to induce a dipole on an adjacent atom, with the effect that the two atoms are attracted when they touch. It is as if atoms are 'sticky' like Velcro.
"This effect explains why the Group 18 noble gas elements are able to form liquids and solids [not He] at low temperatures, and why non-polar molecules, such as P4, S8 and hydrocarbons are able to condense."
2013
Averaged Ionisation Potential Periodic Table
By Leland Allen, a representation of the periodic table with the third dimension of energy derived from the averaged ionisation potentials of the s and p electrons. (Allen suggested that this was a direct measure of electronegativity). From J. Am. Chem. Soc. 1989, 111, 9004:
2022
BacklightPower Periodic Table of the First 21 Elements
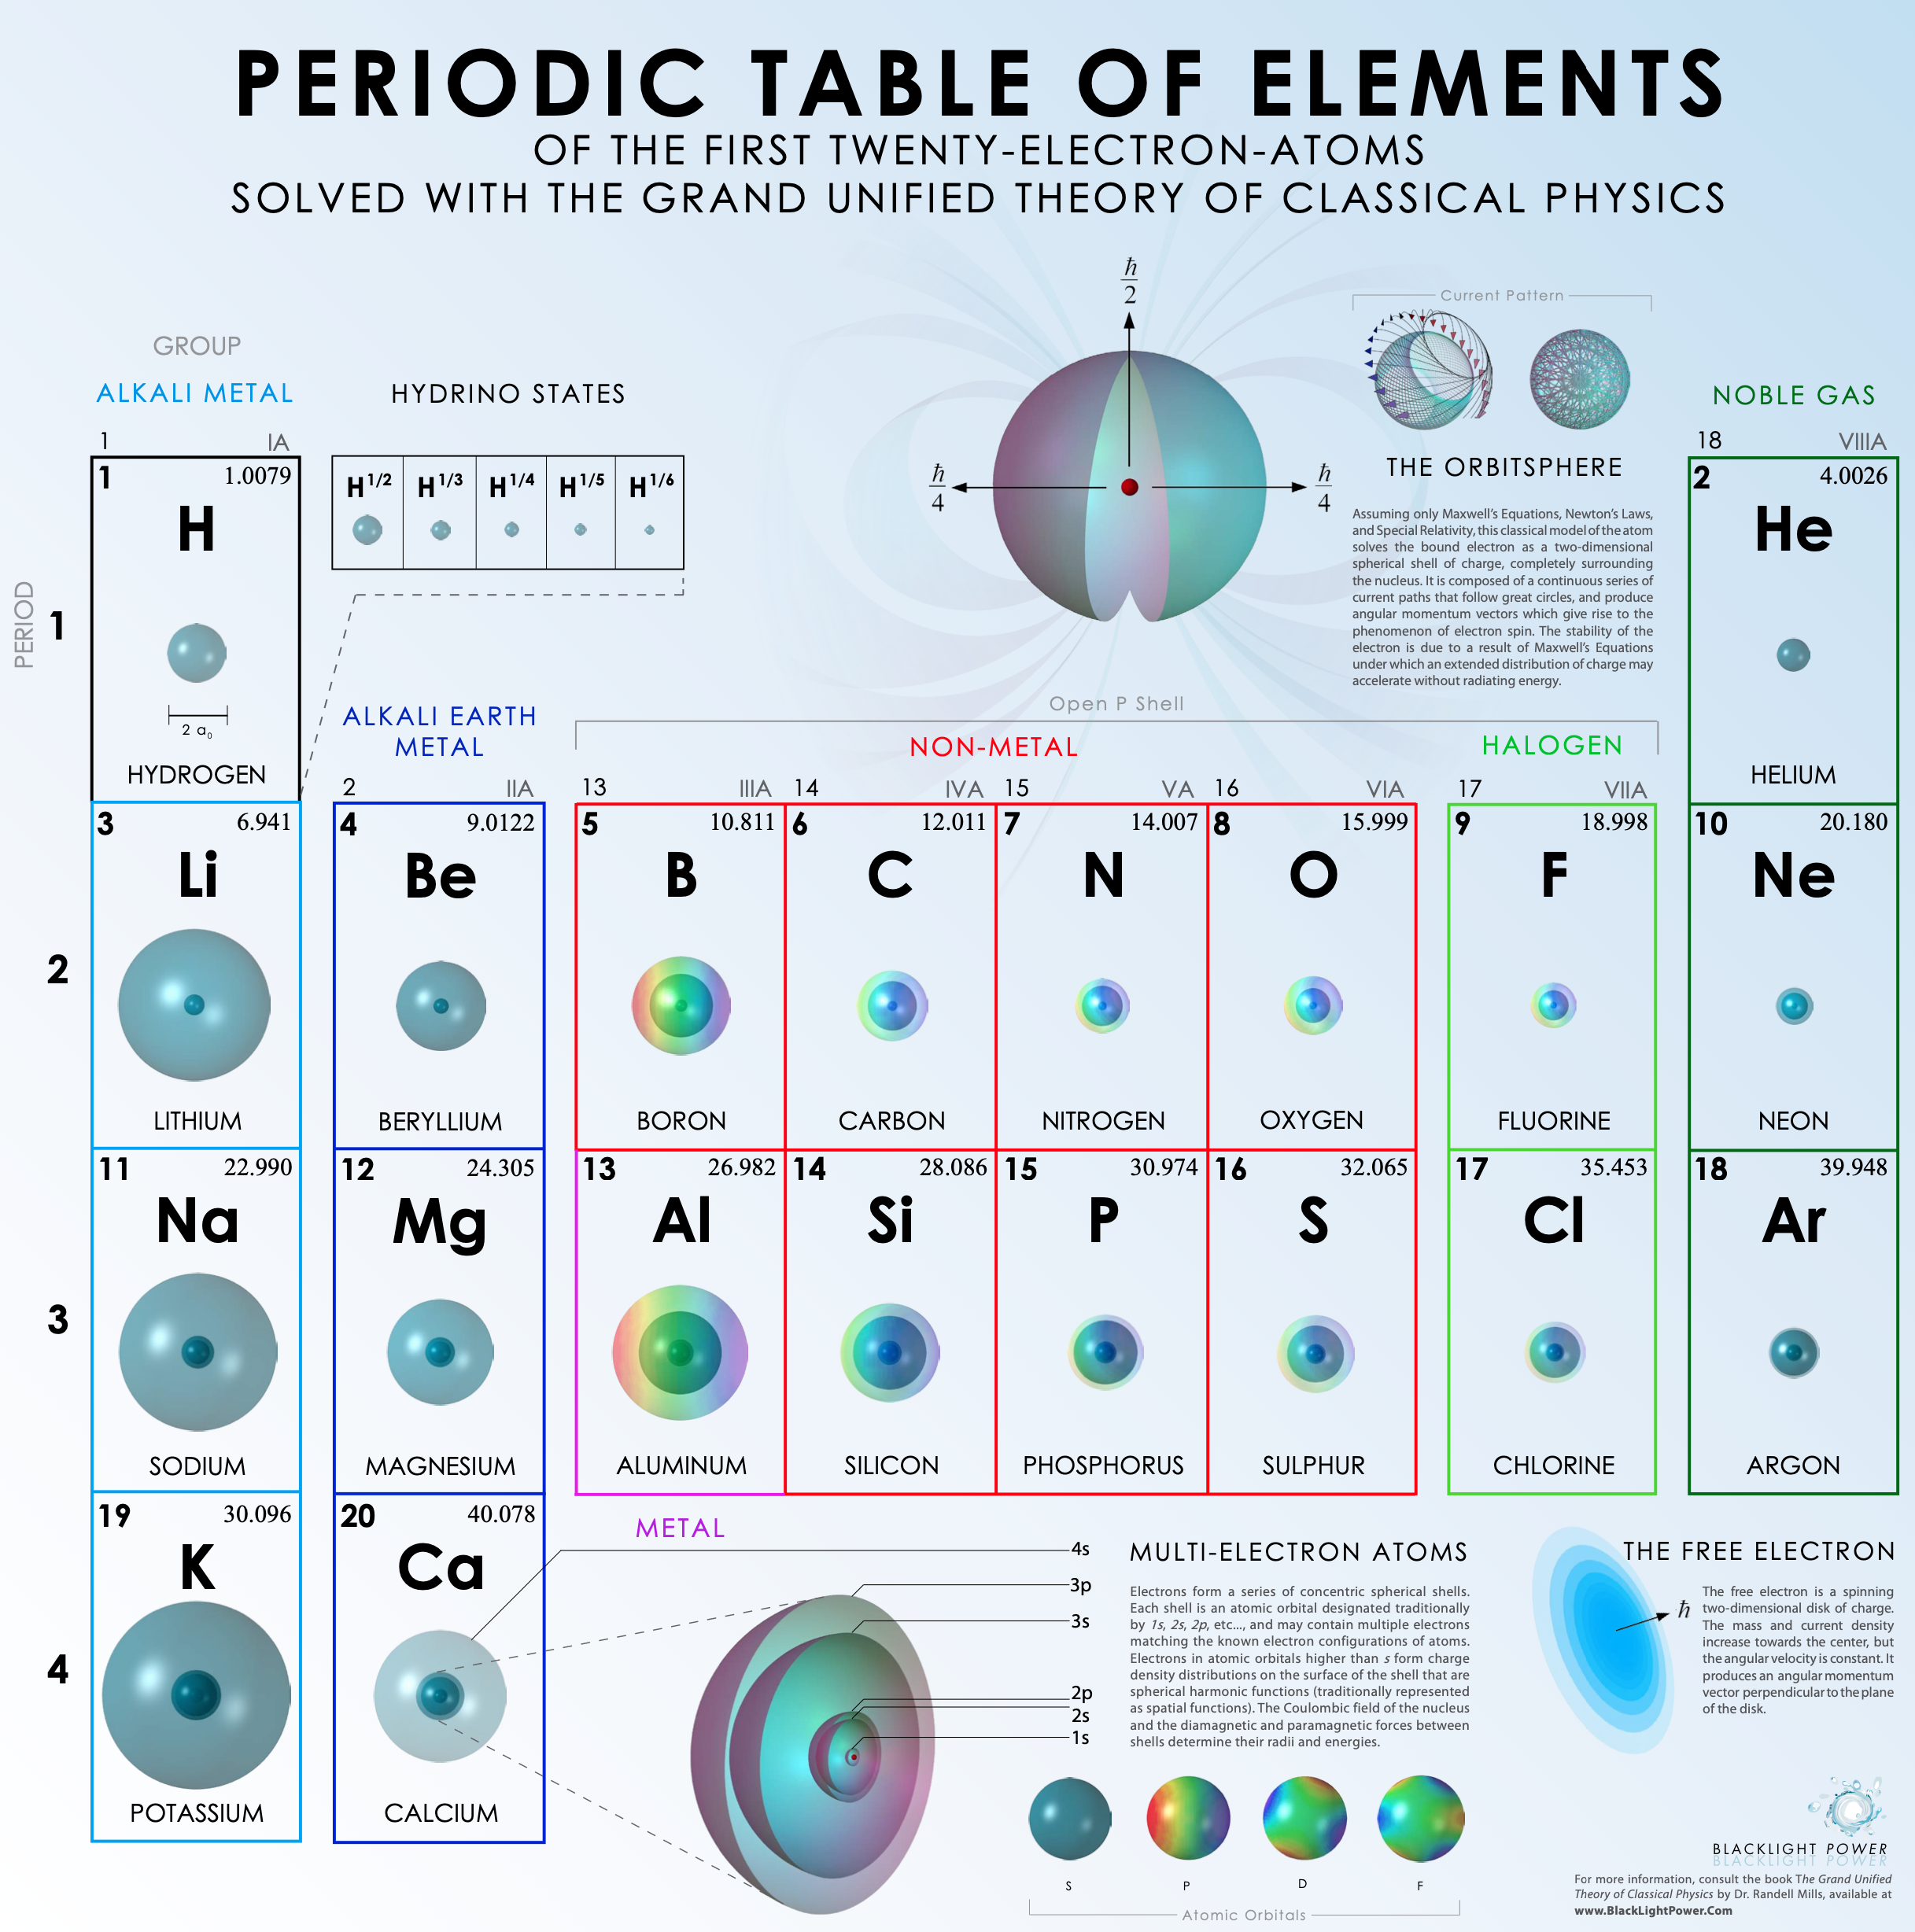
Periodic Table of The First Twenty-Electron-Atoms Solved With the Grand Unified Theory of Classical Physics by Backlight Power.
Click the image or here to go to the origional PDF:
1870
Baker's Electronegativity Table
Baker's electronegativity table of 1870 differs from Berzelius' listing of 1836 only by the addition of the newly discovered elements. Page 280 and ref. 5 from Bill Jensen's: Electronegativity from Avogadro to Pauling Part II: Late Nineteenth- and Early Twentieth-Century Developments, J. Chem. Educ., 80, 279-287 (2003):

1836
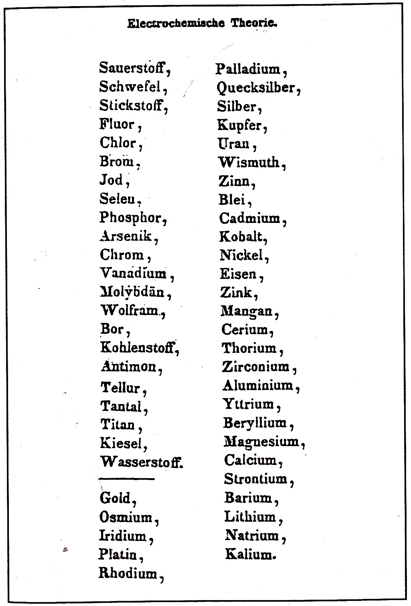
Berzelius' Electronegativity Table
Berzelius' electronegativity table of 1836.
The most electronegative element (oxygen or Sauerstoff) is listed at the top left and the least electronegative (potassium or Kalium) lower right. The line between hydrogen (Wasserstoff) and gold seperates the predomently electronegative elements from the electropositive elements. Page 17 and ref. 32 from Bill Jensen's Electronegativity from Avogadro to Pauling Part I: Origins of the Electronegativity Concept, J. Chem. Educ., 73, 11-20 (1996):
2010
Bing Periodic Table
Microsoft's Bing search engine has a rather extensive way of finding element data & information that avoids any formal PT representation:
2004
Biologist's Periodic Tables
A periodic table showing where biologically essential (green), essential trace (purple), toxic (red), radioactive (yellow) and of low – but not zero– biological impact (gray) elements are found. Only highly toxic elements are shown in red. Li (as Li+) is biologically active and is used as an antidepressant.
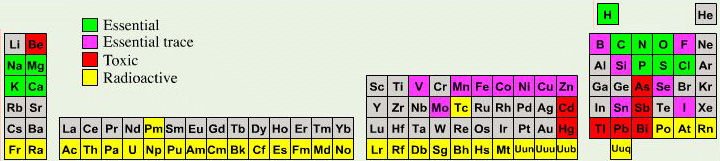
By Mark Leach
or here:
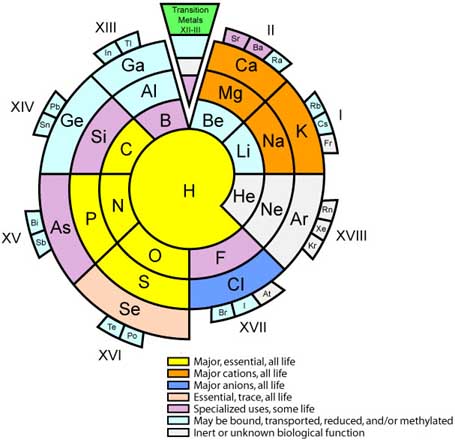
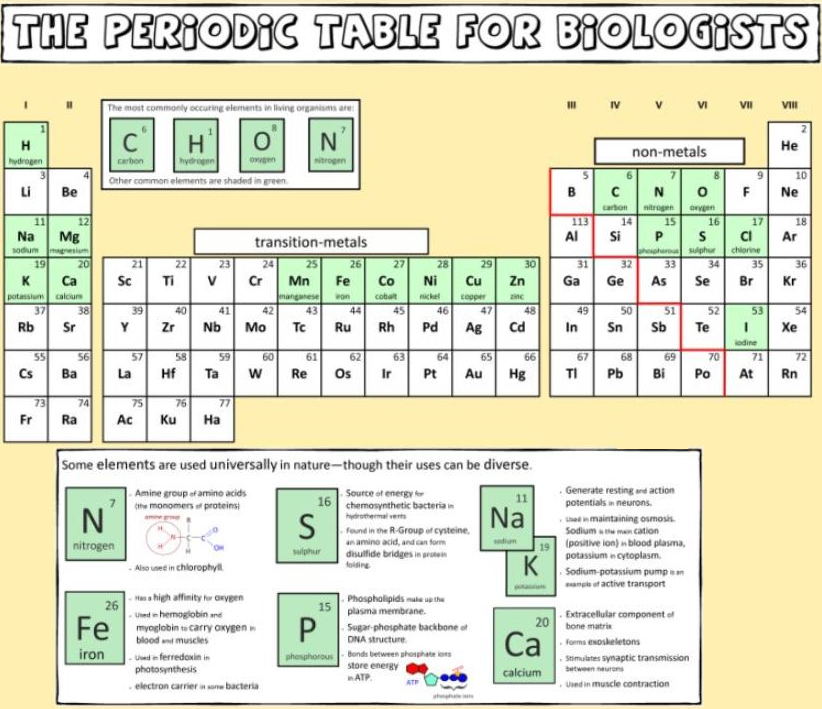
And a periodic table for biologists from Science Videos:
2019
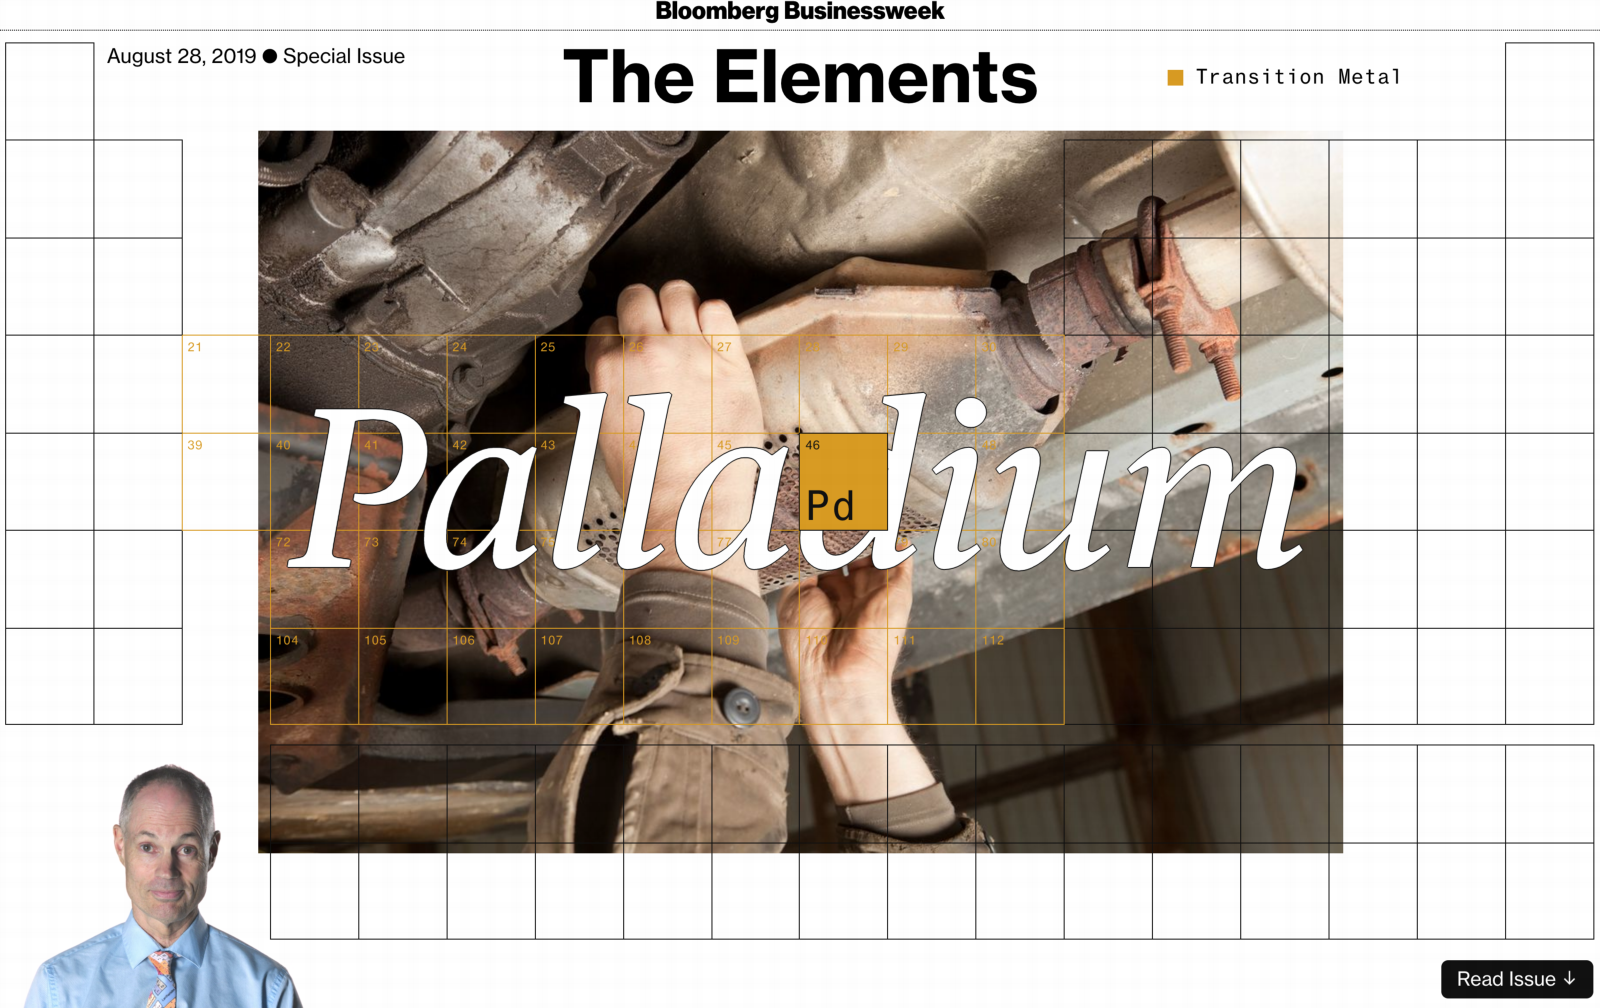
Bloomberg Businessweek Special Issue: The Elements
A Bloomberg Businessweek Special Issue on The Elements.
Using state of the art [2019] web graphics, and packed with interesting business stories:
Thanks to Eric Scerri for the tip!
See the website EricScerri.com and Eric's Twitter Feed.
2019
Bloomberg Businessweek: Why the Periodic Table of Elements Is More Important Than Ever
A Bloomberg Businessweek article on the chemical elements: Mendeleev's 150-year-old periodic table has become the menu for a world hungry for material benefits. (This story is from Bloomberg Businessweek's special issue The Elements.)
Thanks to Roy Alexander for the tip!
1858
Cannizzaro's Letter
Letter of Professor Stanislao Cannizzaro to Professor S. De Luca: Sketch of a Course of Chemical Philosophy given in the Royal University of Genoa, Il Nuovo Cimento, vol. vii. (1858), pp. 321-366.
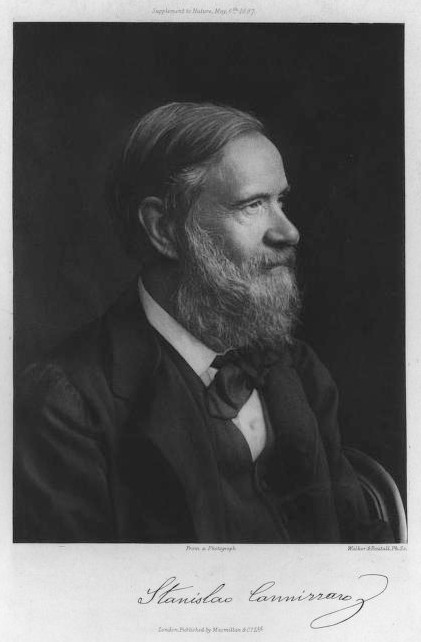
Many thanks to Carmen Giunta, Professor of Chemistry Emeritus, Le Moyne College who provided the information about, and link to, Cannizzaro's Letter. See a list of other classic chemistry papers.
"I believe that the progress of science made in these last years has confirmed the hypothesis of Avogadro, of Ampère, and of Dumas on the similar constitution of substances in the gaseous state; that is, that equal volumes of these substances, whether simple or compound, contain an equal number of molecules: not however an equal number of atoms, since the molecules of the different substances, or those of the same substance in its different states, may contain a different number of atoms, whether of the same or of diverse nature."
From the Science History of Science Institute:
"In 1858 Cannizzaro outlined a course in theoretical chemistry for students at the University of Genoa,where he had to teach without benefit of a laboratory. He used the hypothesis of a fellow Italian, Amedeo Avogadro, who had died just two years earlier, as a pathway out of the confusion rampant among chemists about atomic weights and the fundamental structure of chemical compounds."
Mark Leach writes:
"Before a periodic table of the chemical elements – which orders the elements by atomic weight and then groups them by property – could be developed it was necessary to know the atomic weight values. However, to deduce the atomic weights was a problem as it was necessary to know the ratios of how the elements combined, the stoichiometry.
"Tables of atomic weight data by Dalton (1808), Wollaston (1813) and Daubeny (1831) show progress, but the 1858 Cannizzaro letter was the first where the atomic weight data is more or less both complete and accurate.
"I have extracted the element atomic weight data from the paper, and given the % error with respect to modern atomic weight/mass data. Only titanium is significantly out! It is clear that Cannizzaro knew that hydrogen, nitrogen, oxygen, chlorine, bromine & iodine existed as diatomic molecules."
| Element | Symbol | Cannizzaro's Weight | Modern Weight/Mass | % error |
| Hydrogen | H | 1 | 1.008 | -0.8% |
| Boron | B | 11 | 10.81 | 1.7% |
| Carbon | C | 12 | 12.011 | -0.1% |
| Nitrogen | N | 14 | 14.007 | 0.0% |
| Oxygen | O | 16 | 15.999 | 0.0% |
| Sodium | Na | 23 | 22.99 | 0.0% |
| Magnesium | Mg | 24 | 24.305 | -1.3% |
| Aluminium | Al | 27 | 26.982 | 0.1% |
| Silicon | Si | 28 | 28.085 | -0.3% |
| Sulphur | S | 32 | 32.06 | -0.2% |
| Phosphorus | P | 32 | 30.974 | 3.2% |
| Chlorine | Cl | 35.5 | 35.45 | 0.1% |
| Potassium | K | 39 | 39.098 | -0.3% |
| Calcium | Ca | 40 | 40.078 | -0.2% |
| Chromium | Cr | 53 | 51.996 | 1.9% |
| Manganese | Mn | 55 | 54.938 | 0.1% |
| Iron | Fe | 56 | 55.845 | 0.3% |
| Titanium | Ti | 56 | 47.867 | 14.5% |
| Copper | Cu | 63 | 63.546 | -0.9% |
| Zinc | Zn | 66 | 65.38 | 0.9% |
| Arsenic | As | 75 | 74.922 | 0.1% |
| Bromine | Br | 80 | 79.904 | 0.1% |
| Zirconium | Zr | 89 | 91.224 | -2.5% |
| Silver | Ag | 108 | 107.87 | 0.1% |
| Tin | Sn | 117.6 | 118.71 | -0.9% |
| Iodine | I | 127 | 126.9 | 0.1% |
| Platinum | Pt | 197 | 195.08 | 1.0% |
| Mercury | Hg | 200 | 200.59 | -0.3% |
| Lead | Pb | 207 | 207.2 | -0.1% |
| Diatomic Molecule | Formula | Cannizzaro's Weight | Modern Weight/Mass | % error |
| Hydrogen | H2 | 2 | 2.016 | -0.8% |
| Oxygen | O2 | 32 | 31.998 | 0.0% |
| Sulphur | S2 | 64 | 64.12 | -0.2% |
| Chlorine | Cl2 | 71 | 70.9 | 0.1% |
| Bromine | Br2 | 160 | 159.808 | 0.1% |
| Iodine | I2 | 254 | 253.8 | 0.1% |
| Molecule | Formula | Cannizzaro's Weight | Modern Weight/Mass | % error |
| Water | H2O | 18 | 18.015 | -0.1% |
| Hydrochloric Acid | HCl | 36.5 | 36.458 | 0.1% |
| Methane | CH4 | 16 | 16.043 | -0.3% |
| Hydrogen sulphide | H2S | 34 | 34.076 | -0.2% |
| Diethyl ether | CH3CH2OCH2CH3 | 74 | 74.123 | -0.2% |
| Carbon disulphide | CS2 | 76 | 76.131 | -0.2% |
| Chloroethane | CH3CH2Cl | 64.5 | 64.512 | 0.0% |
2010
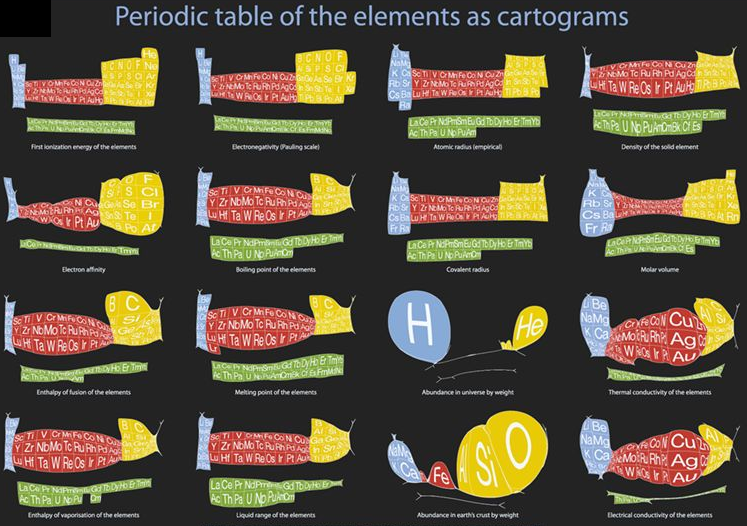
Cartogram Periodic Tables
Webelements have produced a poster with various atomic & elemental properties represented in cartographic form. From the Webelements shop:
"Periodic table cartograms are periodic table grids distorted using a computer algorithm so that the areas of the element squares are in proportion to a periodic table property. This is the first poster to show periodic properties plotted in this way".
2011
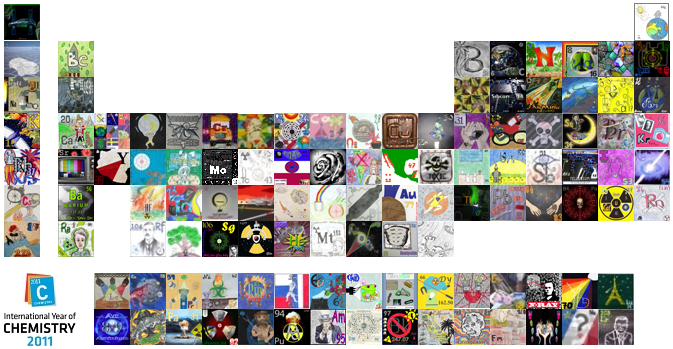
Chem 13 News Periodic Table Project
The Chem 13 News Periodic Table Project celebrates the International Year of Chemistry in 2011.
This collaborative periodic table is designed by chemistry students from all Canadian provinces and territories, 20 US states and 14 different countries. Chem 13 News readers registered their chemistry students to artistically interpret one element. Combined these tiles form one innovative and unique periodic table. A poster of the table and a traveling display are currently being constructed.
2023
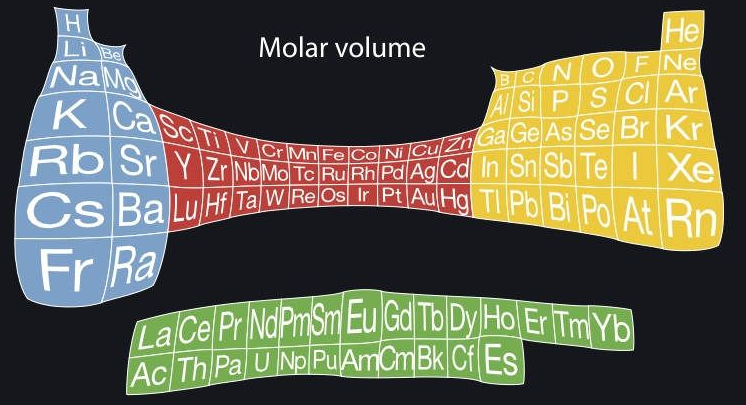
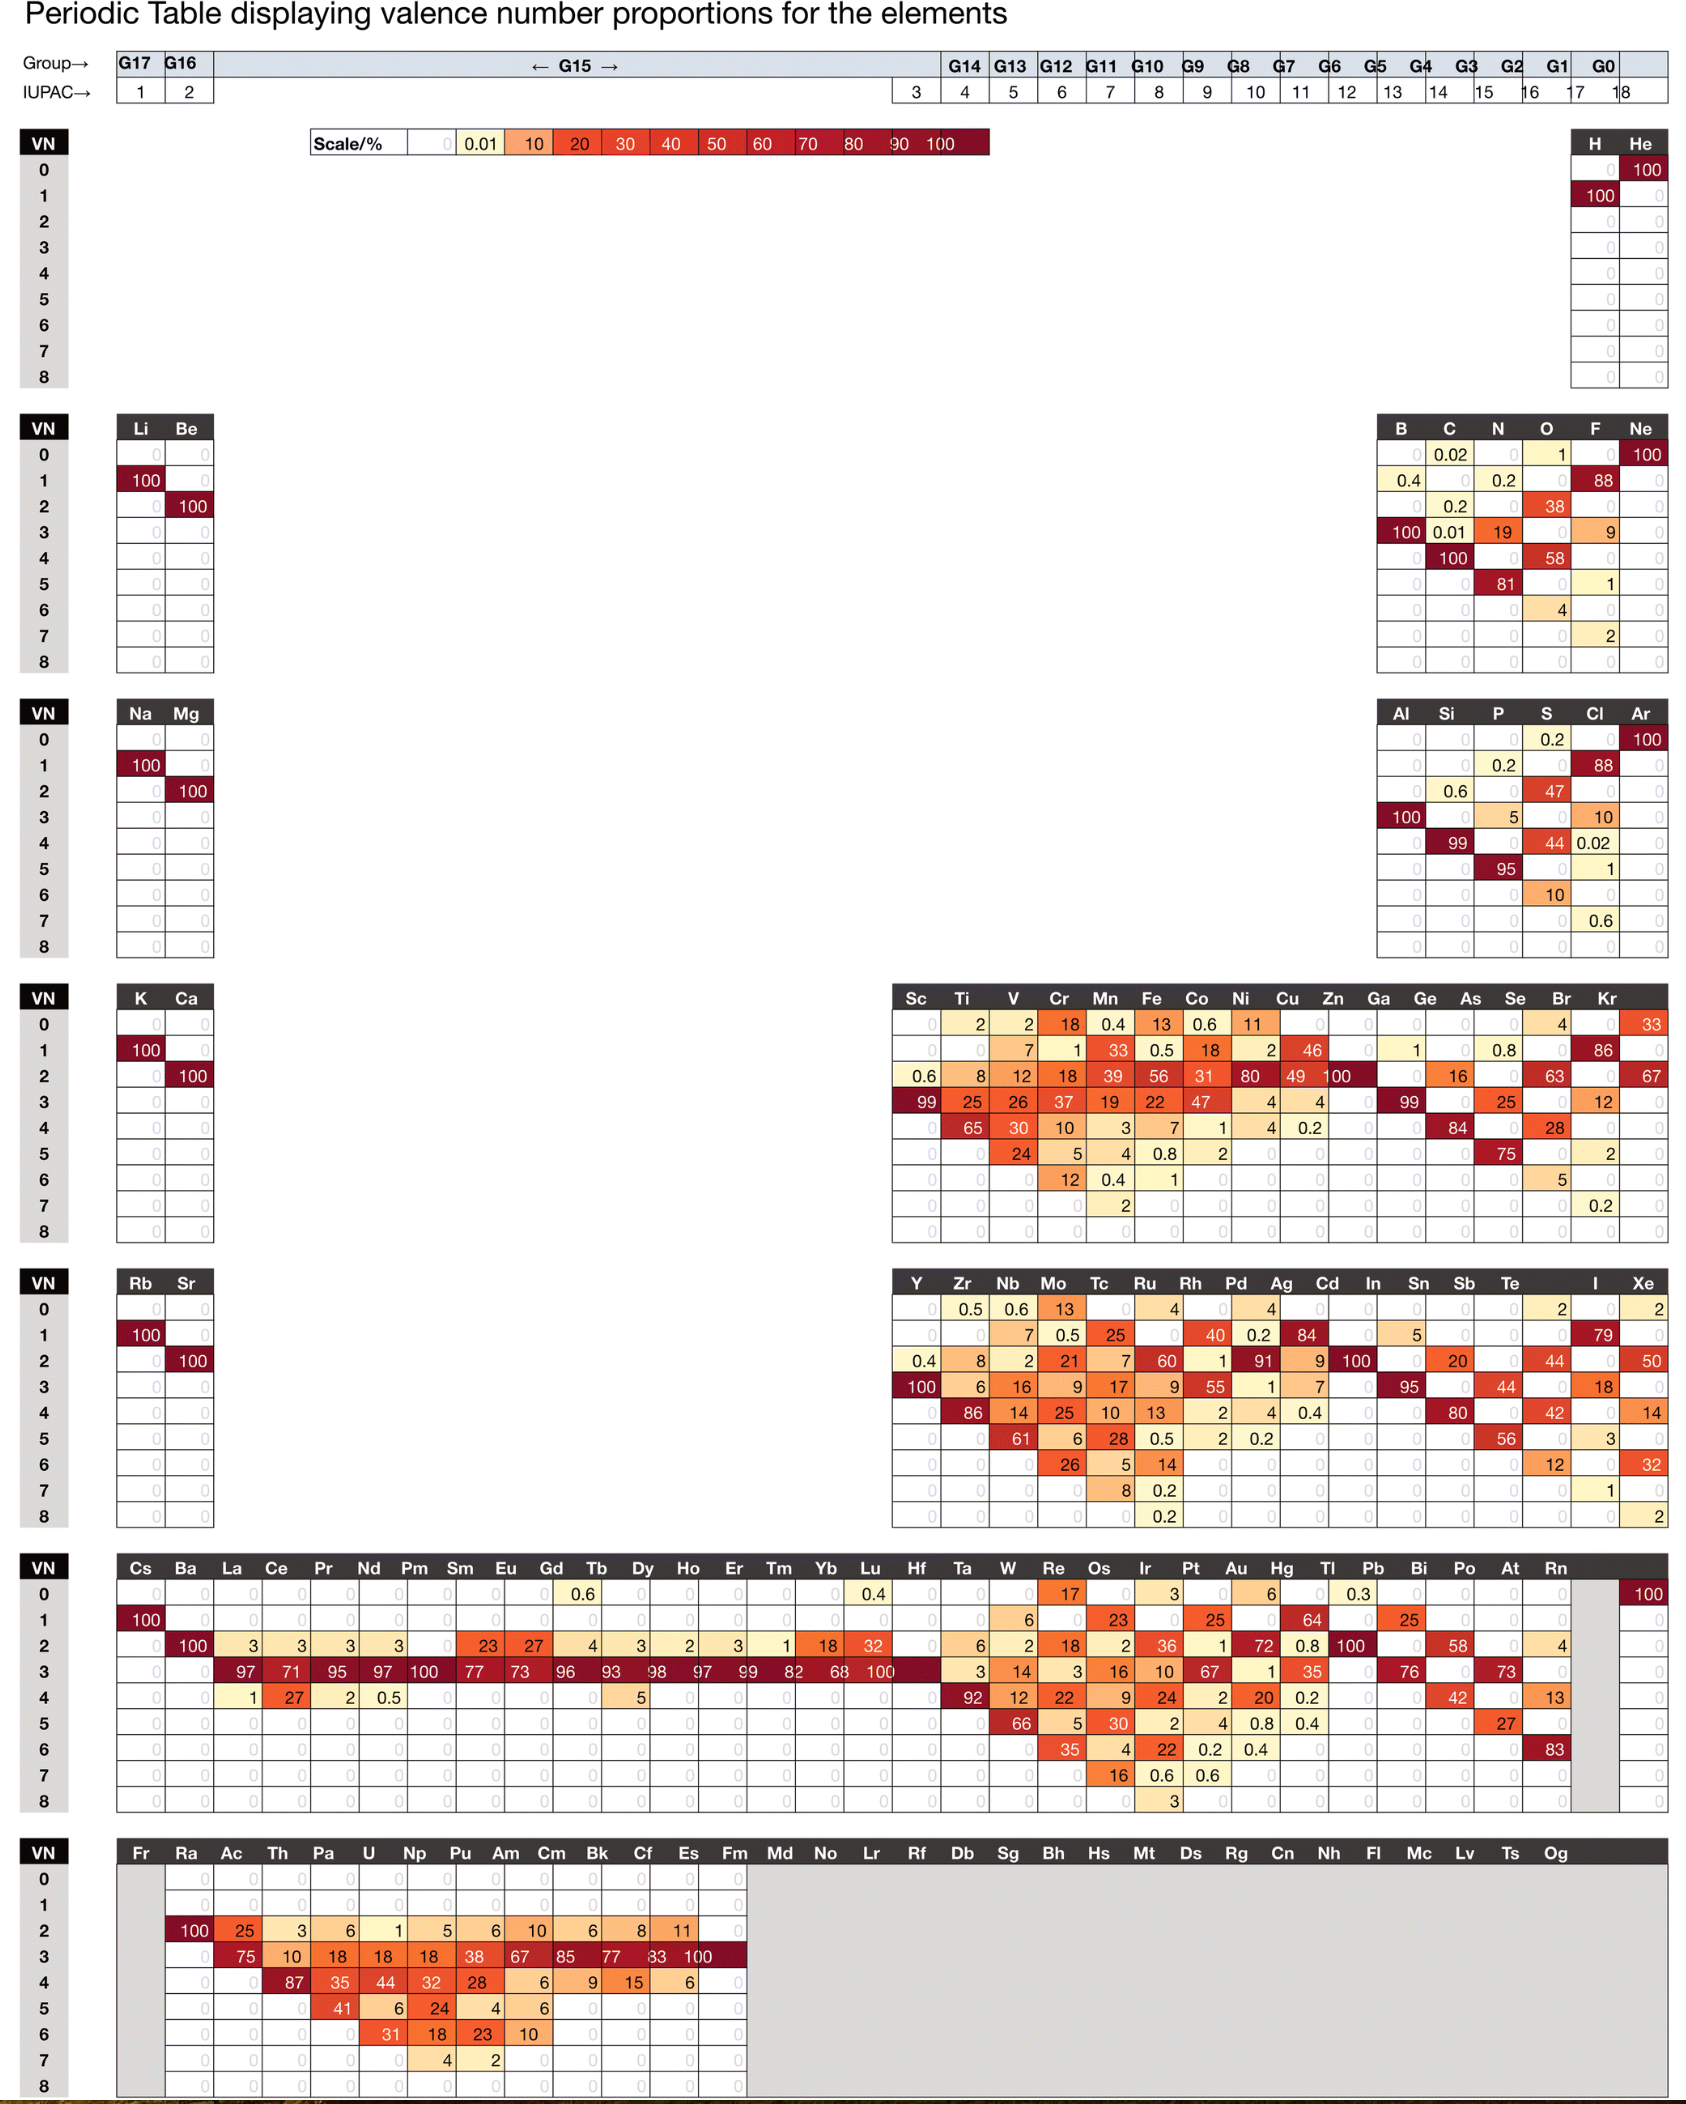
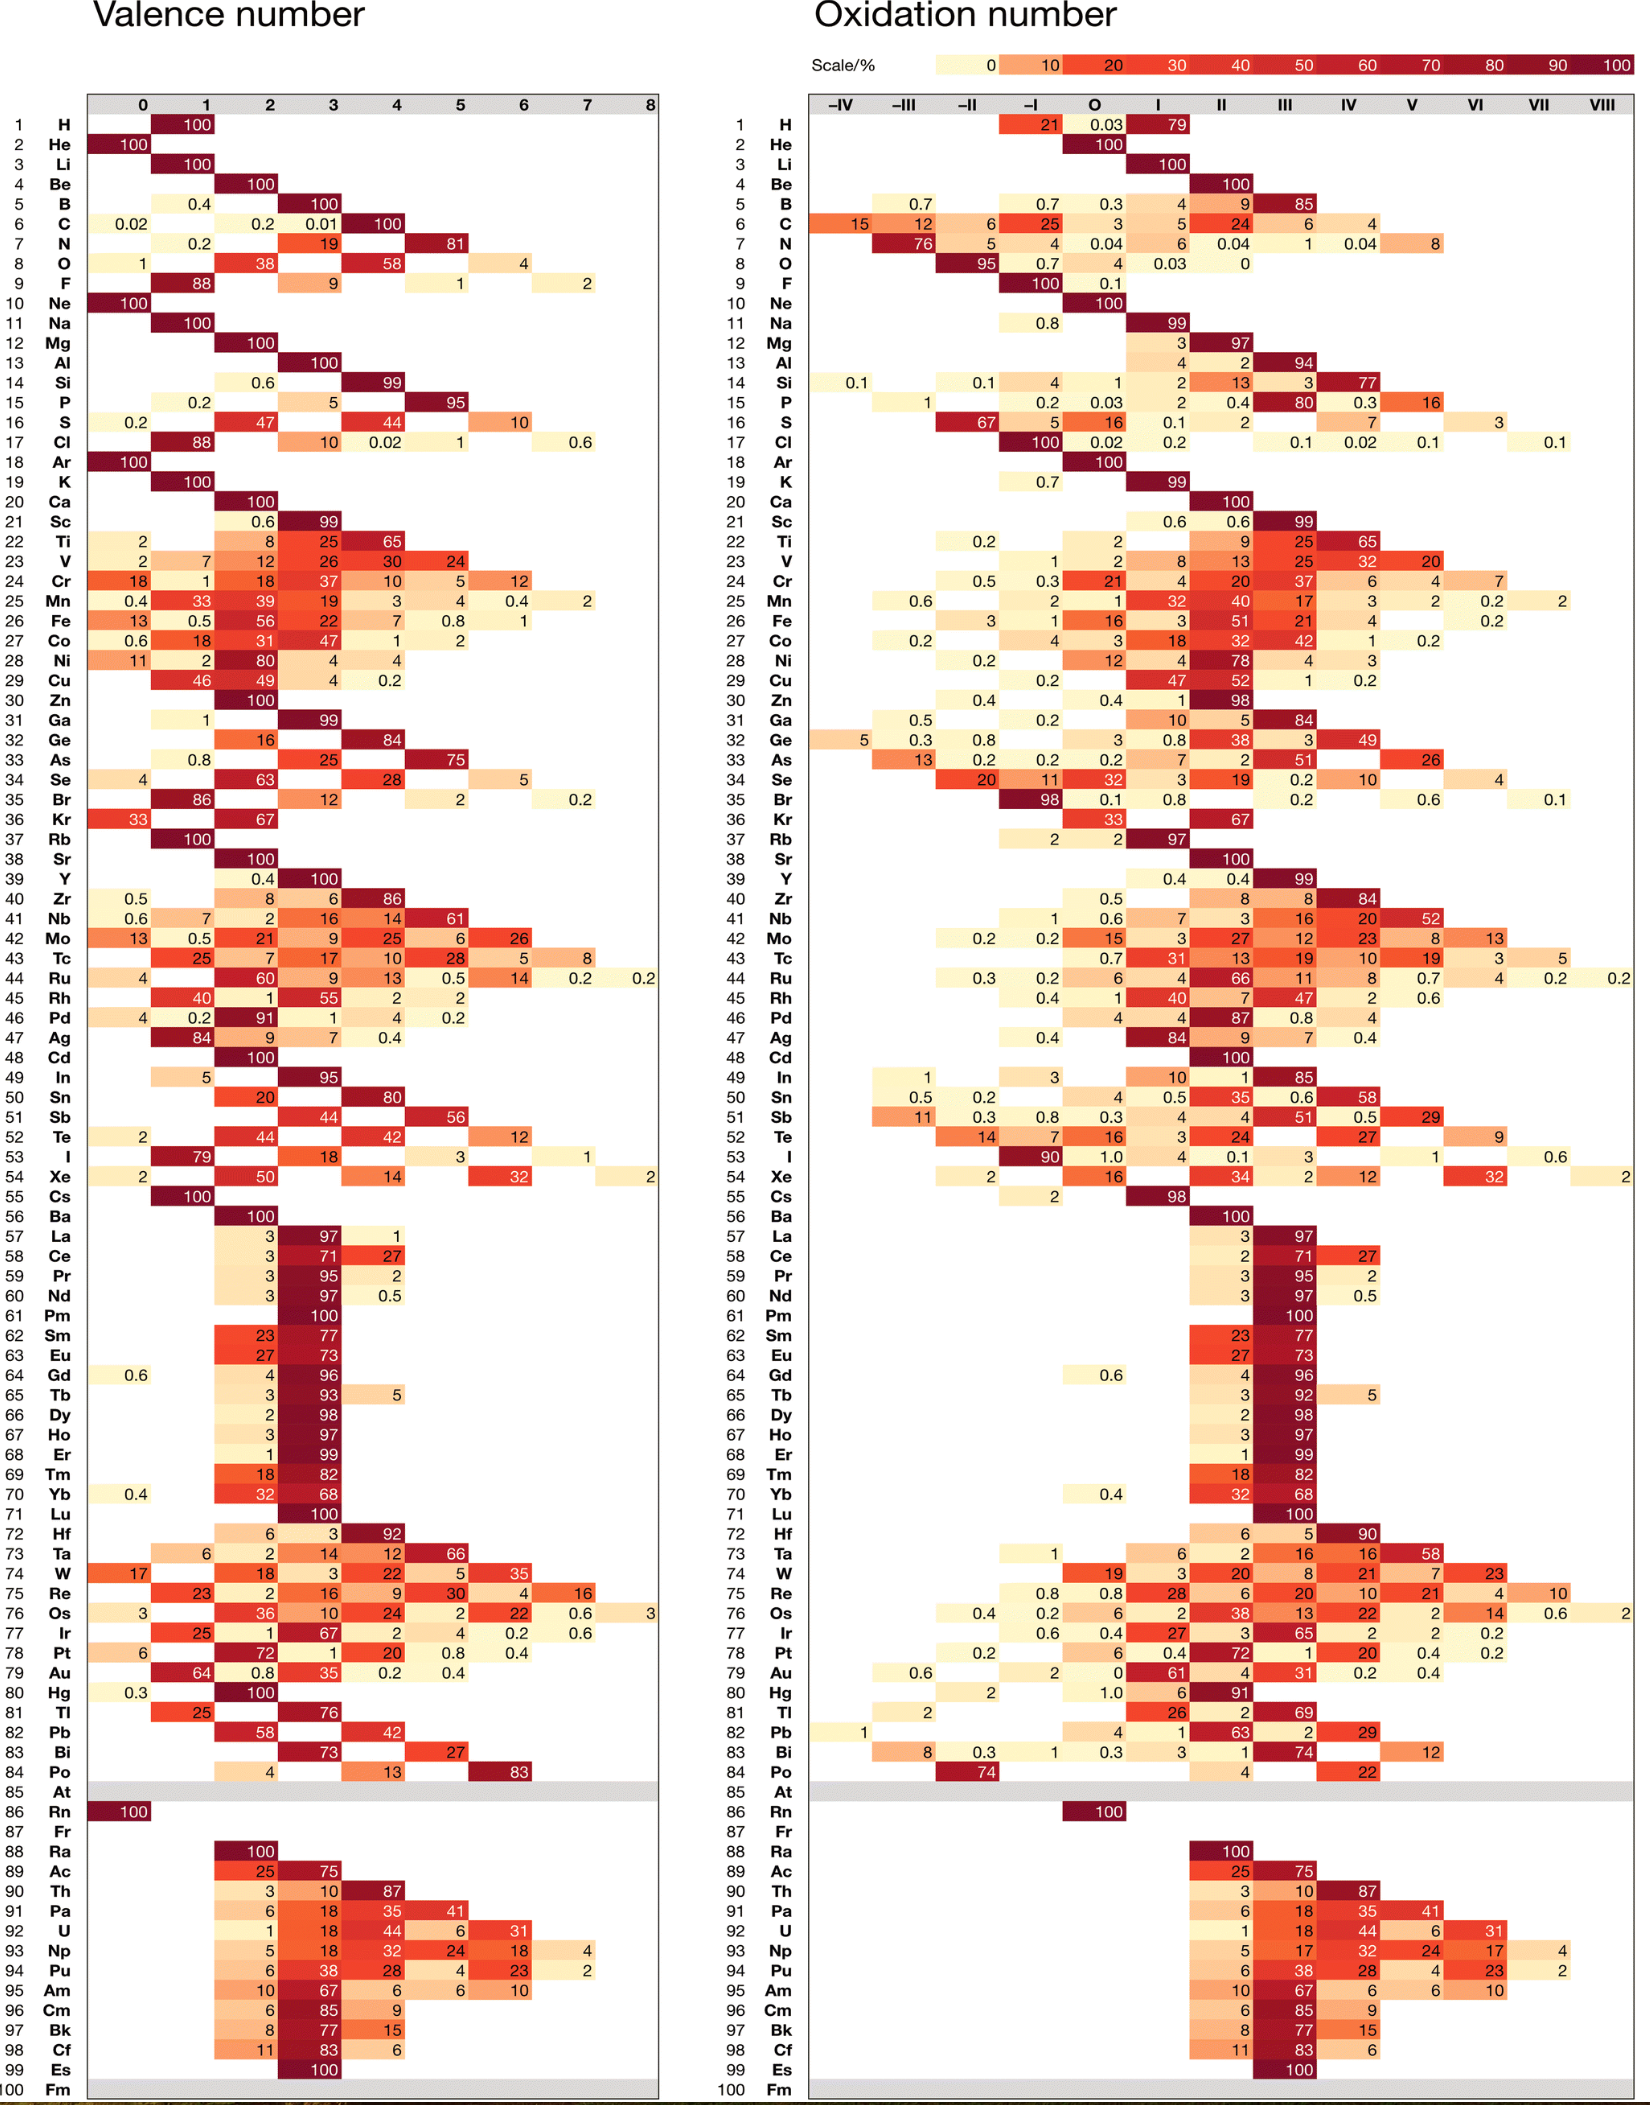
Chemdex: Valence & Oxidation Number Trends
From Mark Winter's review paper Chemdex: quantification and distributions of valence numbers, oxidation numbers, coordination numbers, electron numbers, and covalent bond classes for the elements Dalton Trans., 2024,53, 493-511 https://doi.org/10.1039/D3DT03738J.
The images below show the Valence number (VN) and oxidation number (ON) proportions as percentages for the elements; and Periodic tables displaying valence number proportions (%). (There are few data for Pm and no data for Fr and elements beyond Es.)
The position of H and the group numbers are addressed in the paper.
2003
Chemical & Engineering News Periodic Table
A periodic table from C&EN with links to fascinating stories about the chemical elements:
2019
Chemical Bonds, Periodic Table of
The Max Planck Society (M-P-G, Max-Planck-Gesellschaft) has an article about the hidden structure of the periodic system.
Guillermo Restrepo, MPI for Mathematics in the Sciences:
"A periodic table of chemical bonds: Each of the 94 circles with chemical element symbols represents the bond that the respective element forms with an organic residue. The bonds are ordered according to how strongly they are polarized. Where there is a direct arrow connection, the order is clear: Bonds of hydrogen, for example, are more polarized than bonds of boron, phosphorus, and palladium. The same applies to rubidium in comparison to caesium, which has particularly low polarized bonds and is therefore at the bottom of the new periodic table. If there is no direct arrow between two elements, they may still be comparable – if there is a chain of arrows between them. For example, the bonds of oxygen are more polarized than the bonds of bromine. Bonds represented by the same colour have the same binding behaviour and belong to one of the 44 classes.":

Thanks to René for the tip!
2010
Chemical Elements as a Collection of Images
Using Google Translate (German -> English):
"The periodic table of chemical elements as a collection of images [click to zoom in]. A collection of images of materials constitute the basic components of the whole universe. This is a periodic table of chemical elements (also called short PSE) with a difference! Visible in pure form, as it really looks like. Not only naked dry boring data. There are the alkali metals, alkaline earth metals, boron group, carbon group, nitrogen group, chalcogens, halogens, noble gases, hard metals, ferrous metals, precious metals, lanthanides..." from the website, here:
2004
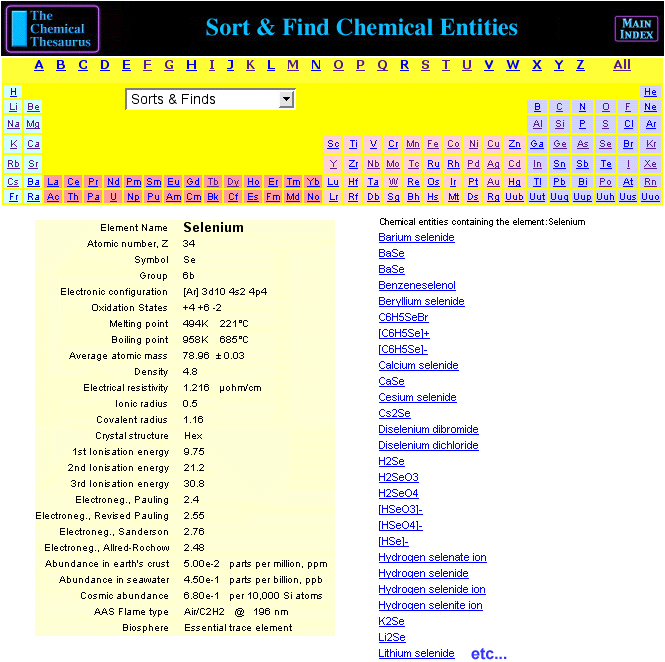
Chemical Thesaurus Periodic Table
Search for chemical reagents, atomic and molecular ions, minerals, isotopes, elemental data, etc., using the periodic table built into The Chemical Thesaurus reaction chemistry database:
By Mark Leach
2005
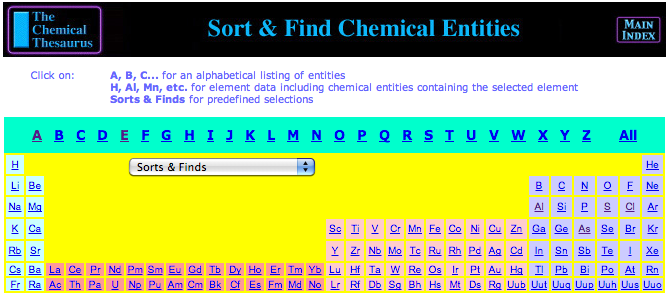
Chemical Thesaurus Reaction Chemistry Database Periodic Table
A periodic table front end to the Chemical Thesaurus Reaction Chemistry Database Periodic Table. Clicking on an element gives access to database searches of chemical species and their interactions.
A quote neatly sums up what the ChemThes reaction chemistry database project is trying to achieve:
"The Chemical Thesaurus is a reaction chemistry information system that extends traditional references by providing hyperlinks between related information. The program goes a long way toward meeting its ambitious goal of creating a nonlinear reference for reaction information. With its built-in connections, organizing themes, and multiple ways to sort and view data, The Chemical Thesaurus is much greater than the sum of the data in its database.
"The program does an excellent job of removing the artificial barriers between different subdisciplinary areas of chemistry by presenting a unified vision of inorganic and organic reaction chemistry."
By Mark Leach
2021
Chemogenesis In 700 Seconds
The Chemogenesis analysis – by Mark Leach – tells the story of how chemical structure and reactivity emerge from the periodic table of the elements. This video is a rapid dash through the story... which unfolds over many pages of the Chemogenesis Web Book.
2004
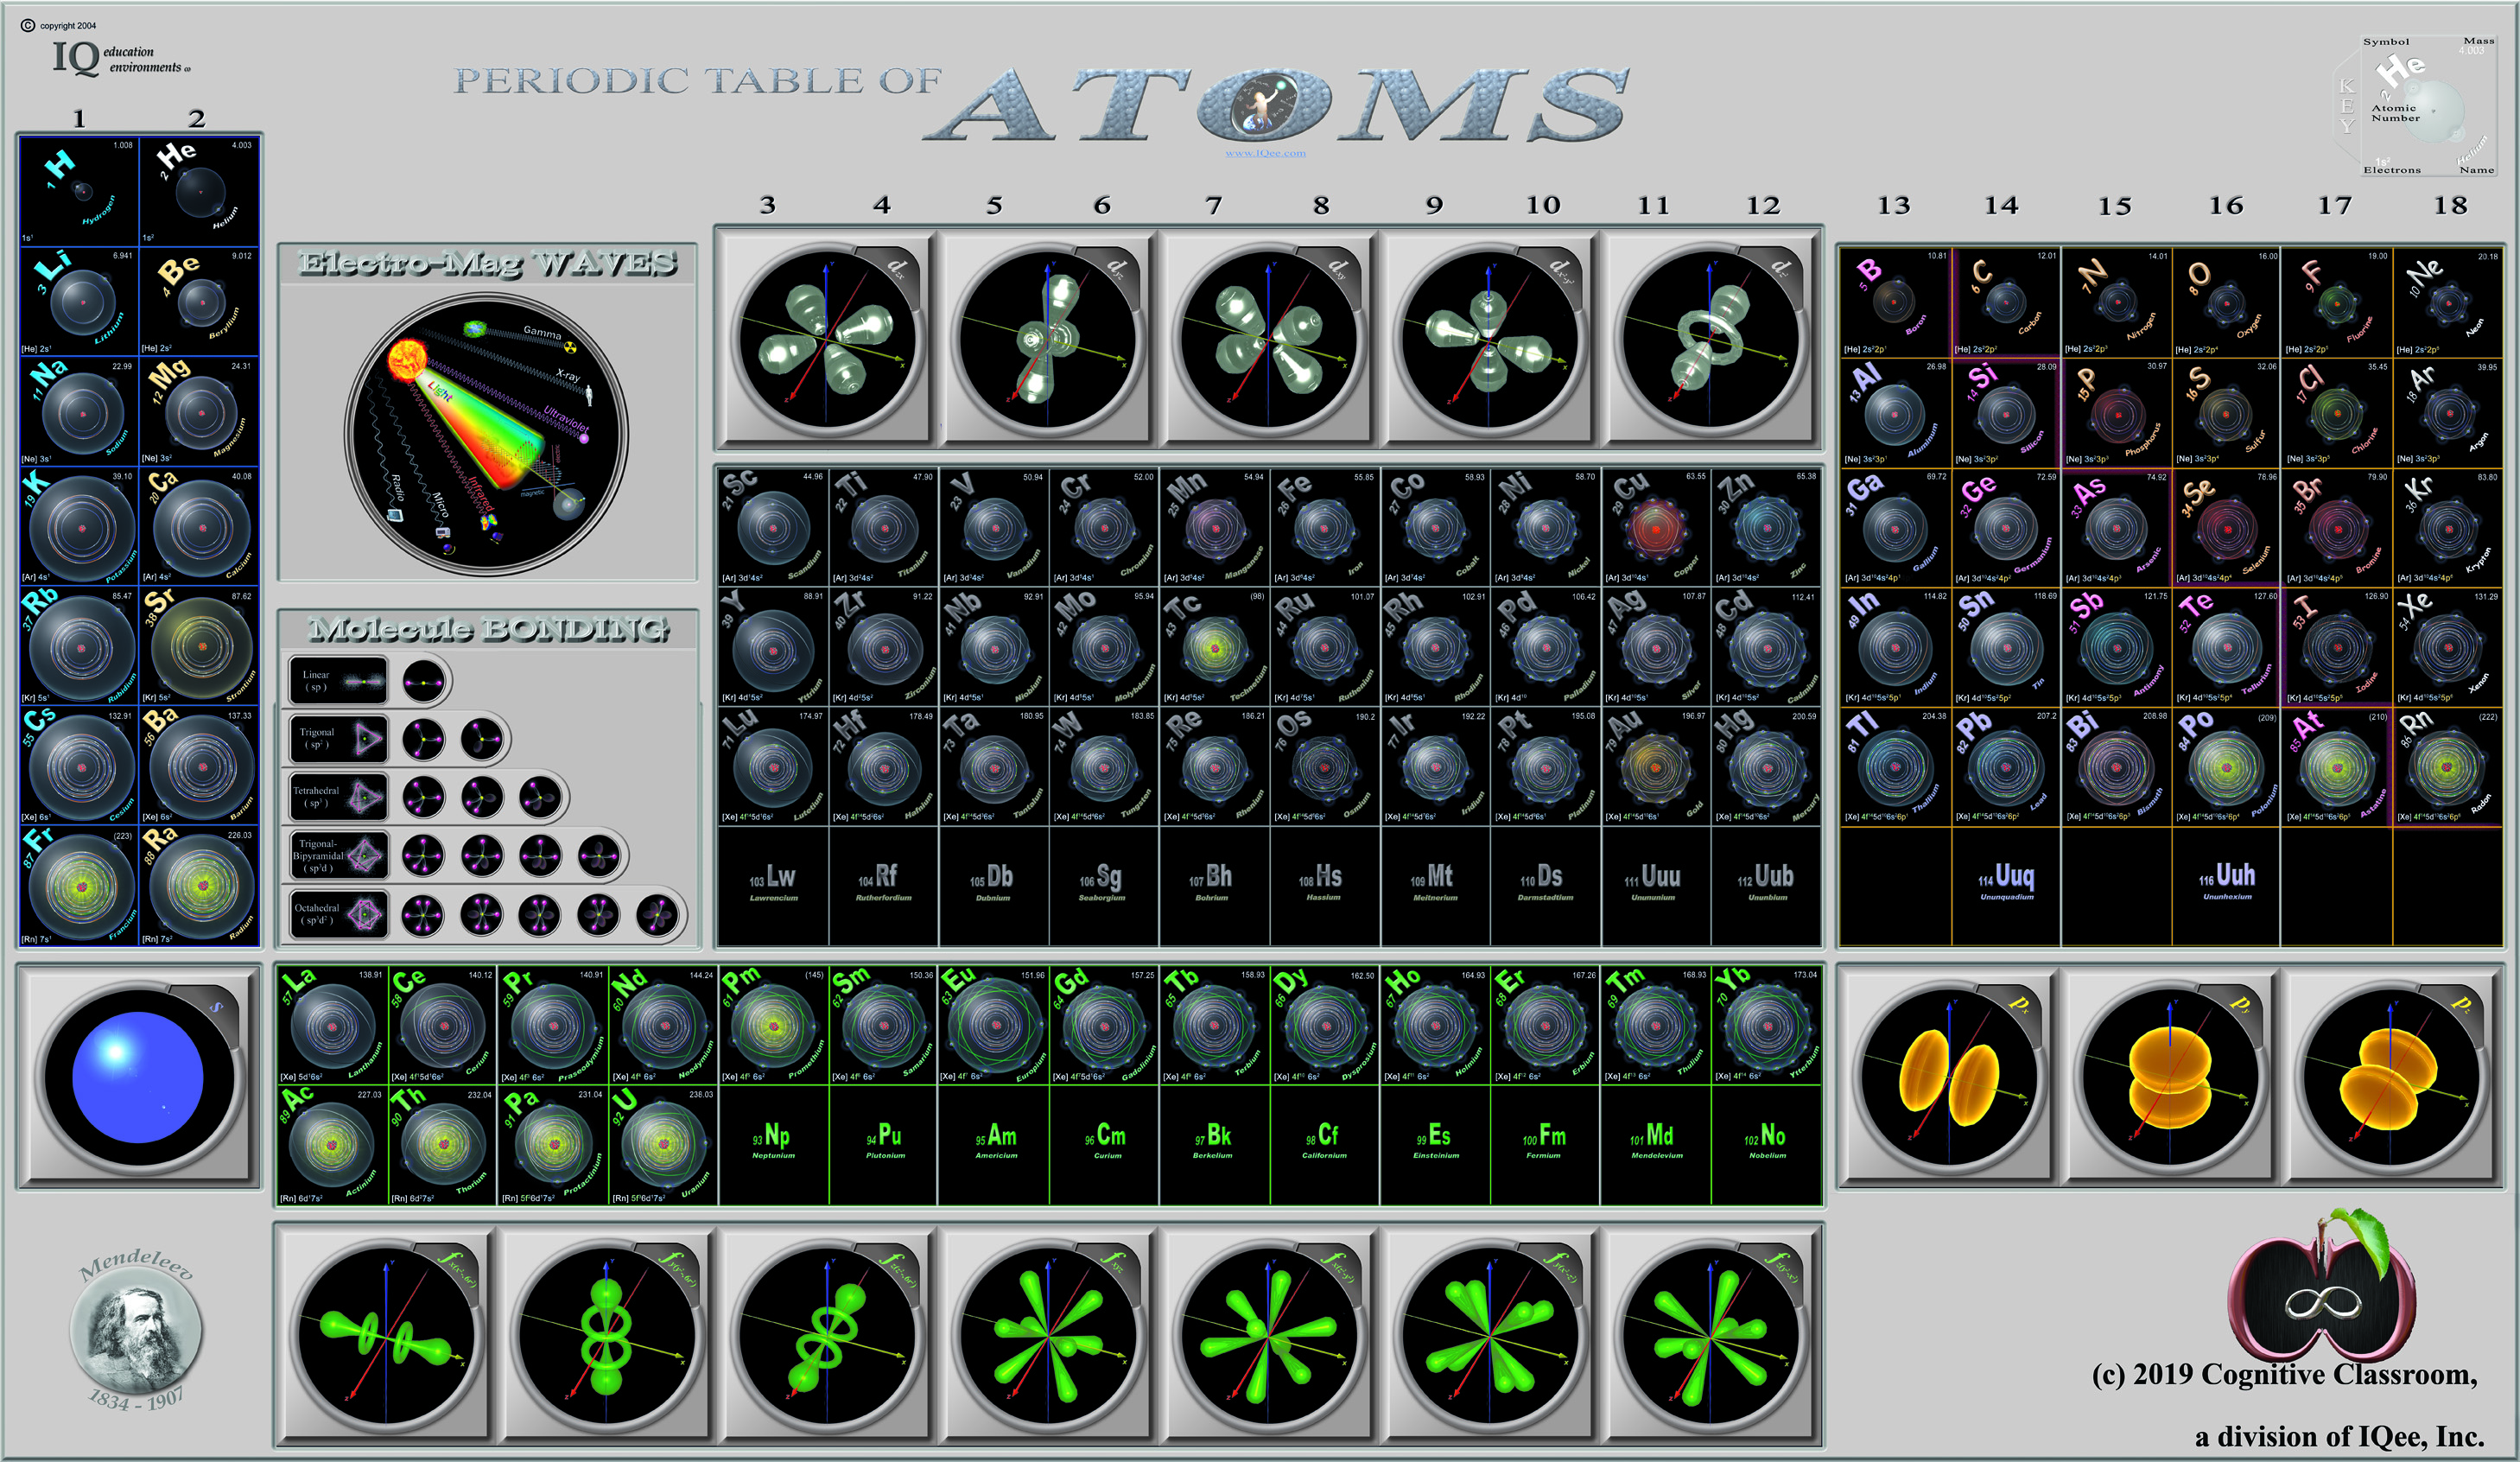
Cognitive Classroom's Periodic Table of Atoms
From Cognitive Classroom, a Periodic Table of Atoms. Richard Lambrecht writes:
"We have developed a visual periodic table that groups by orbitals, making He no longer contentious. But by including an orbital cloud, we give the student a great offset to the Bohr model used to place each and every single electron in the periodic table."
Click image or here to enlarge:
2016
Collective Work of Chemists
From an article on LinkedIn:
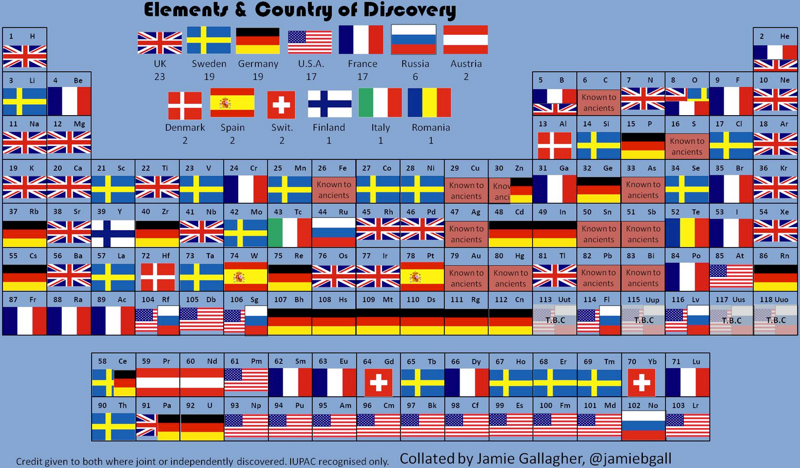
Twelve elements were known from the Ancient Times, and were described by Romans and Greeks. The remaining 106 elements have been discovered by scientists of 15 different countries during the last 4 centuries. In addition, 19 elements of those 106 (18%) have been co-discovered by researchers of two countries.
Although some of them (like Bromine or Thallium) were isolated separately at the same time by chemists of different nationalities within the race to discover new elements in 18th-21st centuries, most of them have been obtained since then through collaborative research, like the recently discovered Ununpentium, Ununseptium and Ununoctium.
Another example is the isolation of Radium and Polonium by the Polish Maria Skłodowska-Curie and her French husband, Pierre Curie.
Thus, Periodic Table is the result of a collective and long-term work of hundreds of scientists.
It is noteworthy to see that Russia and United States have discovered mainly artificial elements.


2010
Compilation of Minimum and Maximum Isotope Ratios of Selected Elements
Documented variations in the isotopic compositions of some chemical elements are responsible for expanded uncertainties in the standard atomic weights published by the Commission on Atomic Weights and Isotopic Abundances of the International Union of Pure and Applied Chemistry.
This report summarizes reported variations in the isotopic compositions of 20 elements that are due to physical and chemical fractionation processes (not due to radioactive decay) and their effects on the standard atomic weight uncertainties. For 11 of those elements (hydrogen, lithium, boron, carbon, nitrogen, oxygen, silicon, sulfur, chlorine, copper, and selenium), standard atomic weight uncertainties have been assigned values that are substantially larger than analytical uncertainties because of common isotope abundance variations in materials of natural terrestrial origin. For 2 elements (chromium and thallium), recently reported isotope abundance variations potentially are large enough to result in future expansion of their atomic weight uncertainties. For 7 elements (magnesium, calcium, iron, zinc, molybdenum, palladium, and tellurium), documented isotope-abundance variations in materials of natural terrestrial origin are too small to have a significant effect on their standard atomic weight uncertainties.
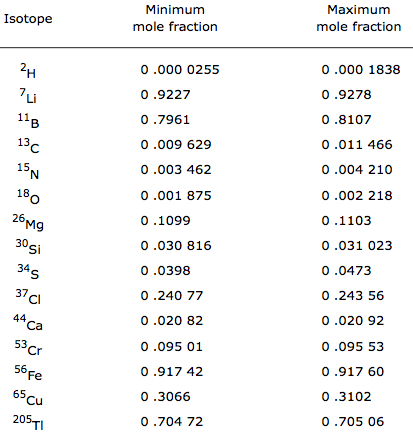
Compilation of Minimum and Maximum Isotope Ratios of Selected Elements in Naturally Occurring Terrestrial Materials and Reagents
This report is available as a pdf.
U.S. GEOLOGICAL SURVEY
Water Resources Investigation Report 01-4222
2020
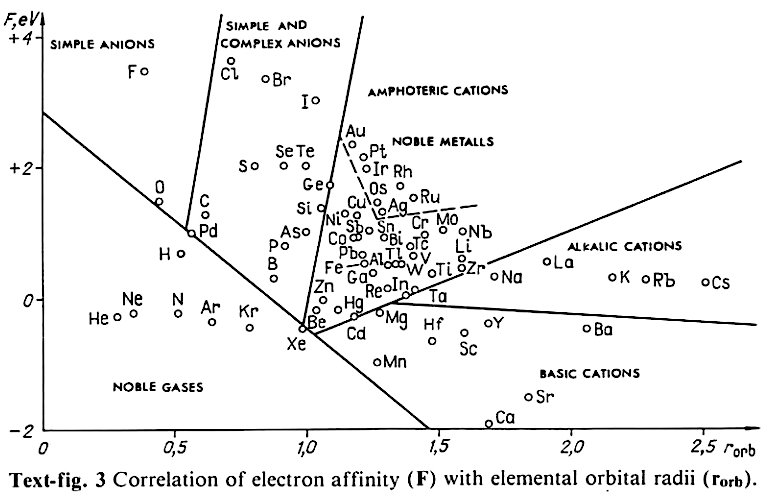
Correlation of Electron Affinity (F) with Elemental Orbital Radii (rorb)
From Jour. Fac. Sci., Hokkaido Univ., Ser. IV. vol. 22, no. 2, Aug., 1987, pp. 357-385, The Connection Between the Properties of Elements and Compounds; Mineralogical-Crystallochemical Classification of Elements by Alexander A. Godovikov & Yu Hariya and expanded by René Vernon who writes.
René Vernon writes:
I was delighted to read about two properties that account for nearly everything seen in the periodic table.
Two properties
While researching double periodicity, I happened upon an obscure article, which simply correlates electron affinity with orbital radius, and in so doing reproduces the broad contours of the periodic table. Having never thought much about the value or significance of EA, and its absence of easily discernible trends, I was suitably astonished. The authors left out the Ln and An and stopped at Bi. They were sitting on a gold mine but provided no further analysis.Development
I added the data up to Lr, updated the EA values, and have redrawn their graph. It is a thing of beauty and wonderment in its simplest sufficient complexity and its return on investment. I've appended 39 observations, covering all 103 elements.
Observations
- Very good correspondence with natural categories
- Largely linear trends seen along main groups; two switchbacks seen in group 13; also falloffs (6p sub-shell) seen in groups 14-17
- First row anomalies seen for Li (in amphoteric territory), Be (ditto), C (misaligned), N (in noble gas territory), O (misaligned), F (ditto) and He (ditto)
- For group 13, the whole group is anomalous, no doubt due to the scandide contraction impacting Ga and the double whammy of the lanthanide and 5d contraction impacting Tl
- Nitrogen was called a noble gas before the discovery of the real noble gases and appropriately enough falls into that territory
- Rn is metallic enough to show cationic behaviour and falls just outside of noble gas territory
- F and O are the most corrosive of the corrosive nonmetals
- The rest of the corrosive nonmetals (Cl, Br and I) are nicely distributed, across the border from F
- The rest of the simple and complex anions, funnily enough, comprise the intermediate nonmetals
- The metalloids are nicely aligned; Ge falls a little outside of the metalloid line, being still occasionally referred to as a metal; Sb, being the most metallic of the metalloids falls outside the border; At is inside; Po is just outside
- Pd is located among the nonmetals due to its absence of 5s electrons; see here
- The proximity of H to Pd is astonishing given the latter's capacity to adsorb the former
- The post-transition metals (PTM) form an "archipelago of amphoterism" bounded by transition metals: Ni and C to the west; Fe and Re to the south; V, Tc and W to the east; noble metals to the north
- Curiously, Zn, Cd, and Hg are collocated with Be, and distant from the PTM and the TM proper (aside from Mn)
- Zn is shown as amphoteric, which it is. Cd is shown as cationic but is not too far away from amphoteric territory; it does show amphoterism, reluctantly; Hg is shown as amphoteric which is the case, weakly, for HgO, as is the congener sulfide HgS, which forms anionic thiomercurates (such as Na2HgS2 and BaHgS3) in strongly basic solutions
- The ostensibly noble metals are nicely delineated; Ag is anomalous given its greater reactivity; Cu, as a coinage metal, is a little further away
- The proximity of Au and Pt to the halogen line is remarkable given the former's capacity to form monovalent anions
- The ferromagnetic metals (Fe-Co-Ni) form a nice line
- The TM from groups 4-12 form switchback patterns e.g. Ti-Zr and the switchback to Hf
- The refractory metals, Nb, Ta, Mo, W and Re are in a wedge formation
- Tc is the central element of the periodic table in terms of mean radius and EA values; V is close, Cr is a little further away
- Ti is just inside the basic cation line; while Ti(IV) is amphoteric, Ti3+ is ionic
- Sc-Y-La shows a main group pattern up to La, when there is a switchback to Ac
- Sc-Y-Lu-Lr shows a TM switch back pattern
- La, and to lesser extent Ce are rather separated from the rest of the Ln, consistent with Restrepo and here.
- Sc and Lu are close to the amphoteric territory and are both in fact, weakly amphoteric
- The post-cerium Ln and An (but for Th) all fall within basic cation territory
- EA values for the An are estimates and need to be treated with due caution
- The light actinides (Th to Cm) occupy a tight locus, with the exception of Th, where the 5f collapse is thought to occur, and Pu, which sits on the border of 5f delocalisation and localisation
- While the light actinides U to Cm are shown as being cationic they are all known in amphoteric forms
- The heavy actinides, Bk to Lr, are widely dispersed
- All the Ln, bar Tm, are located within close proximity of the light An locus; Tm is the least abundant stable Ln
- The gap between La and Ce, and rest of the Ln is consistent with Restrepo's findings and here
- Nobelium in this edition of the chart falls off the bottom, having a radius 1.58 (cf Es) and an EA of -2.33
- There is an extraordinary alignment between He and the Group 2 metals
- Magnesium is on the cationic-amphoteric boundary; some of its compounds show appreciable covalent character
- Li, being the least basic of the alkali metals, is located just outside the alkalic zone; Li compounds are known for their covalent properties
- The reversal of the positions of Fr and Cs is consistent with Cs being the most electronegative metal
- A similar, weaker pattern is seen with Ba and Ra.
Conclusion
So there it is, just two properties account for nearly everything.
Click images below to enlarge:

2014
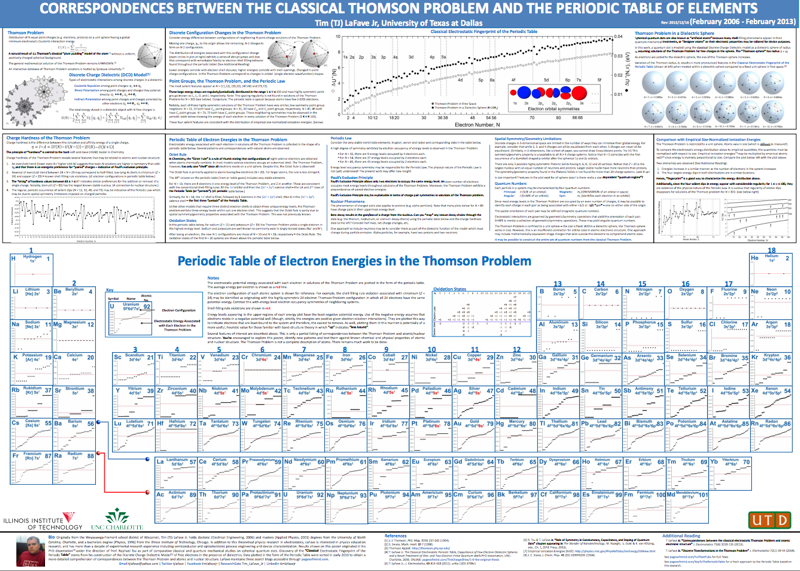
Correspondences Between The Classical Thomson Problem and The Periodic Table of The Elements
By Tim (TJ) LaFave, a very detailed pdf discussing the correspondences between the classical Thomson Problem and the Periodic Table of the Elements. You will need to click thru and zoom in:
2013
County of Discovery Periodic Table
Jamie Gallagher – scientist, engineer, science communicator, salsa teacher and part time comic – has produced a periodic table showing the county of origin of the discoverer:
2021
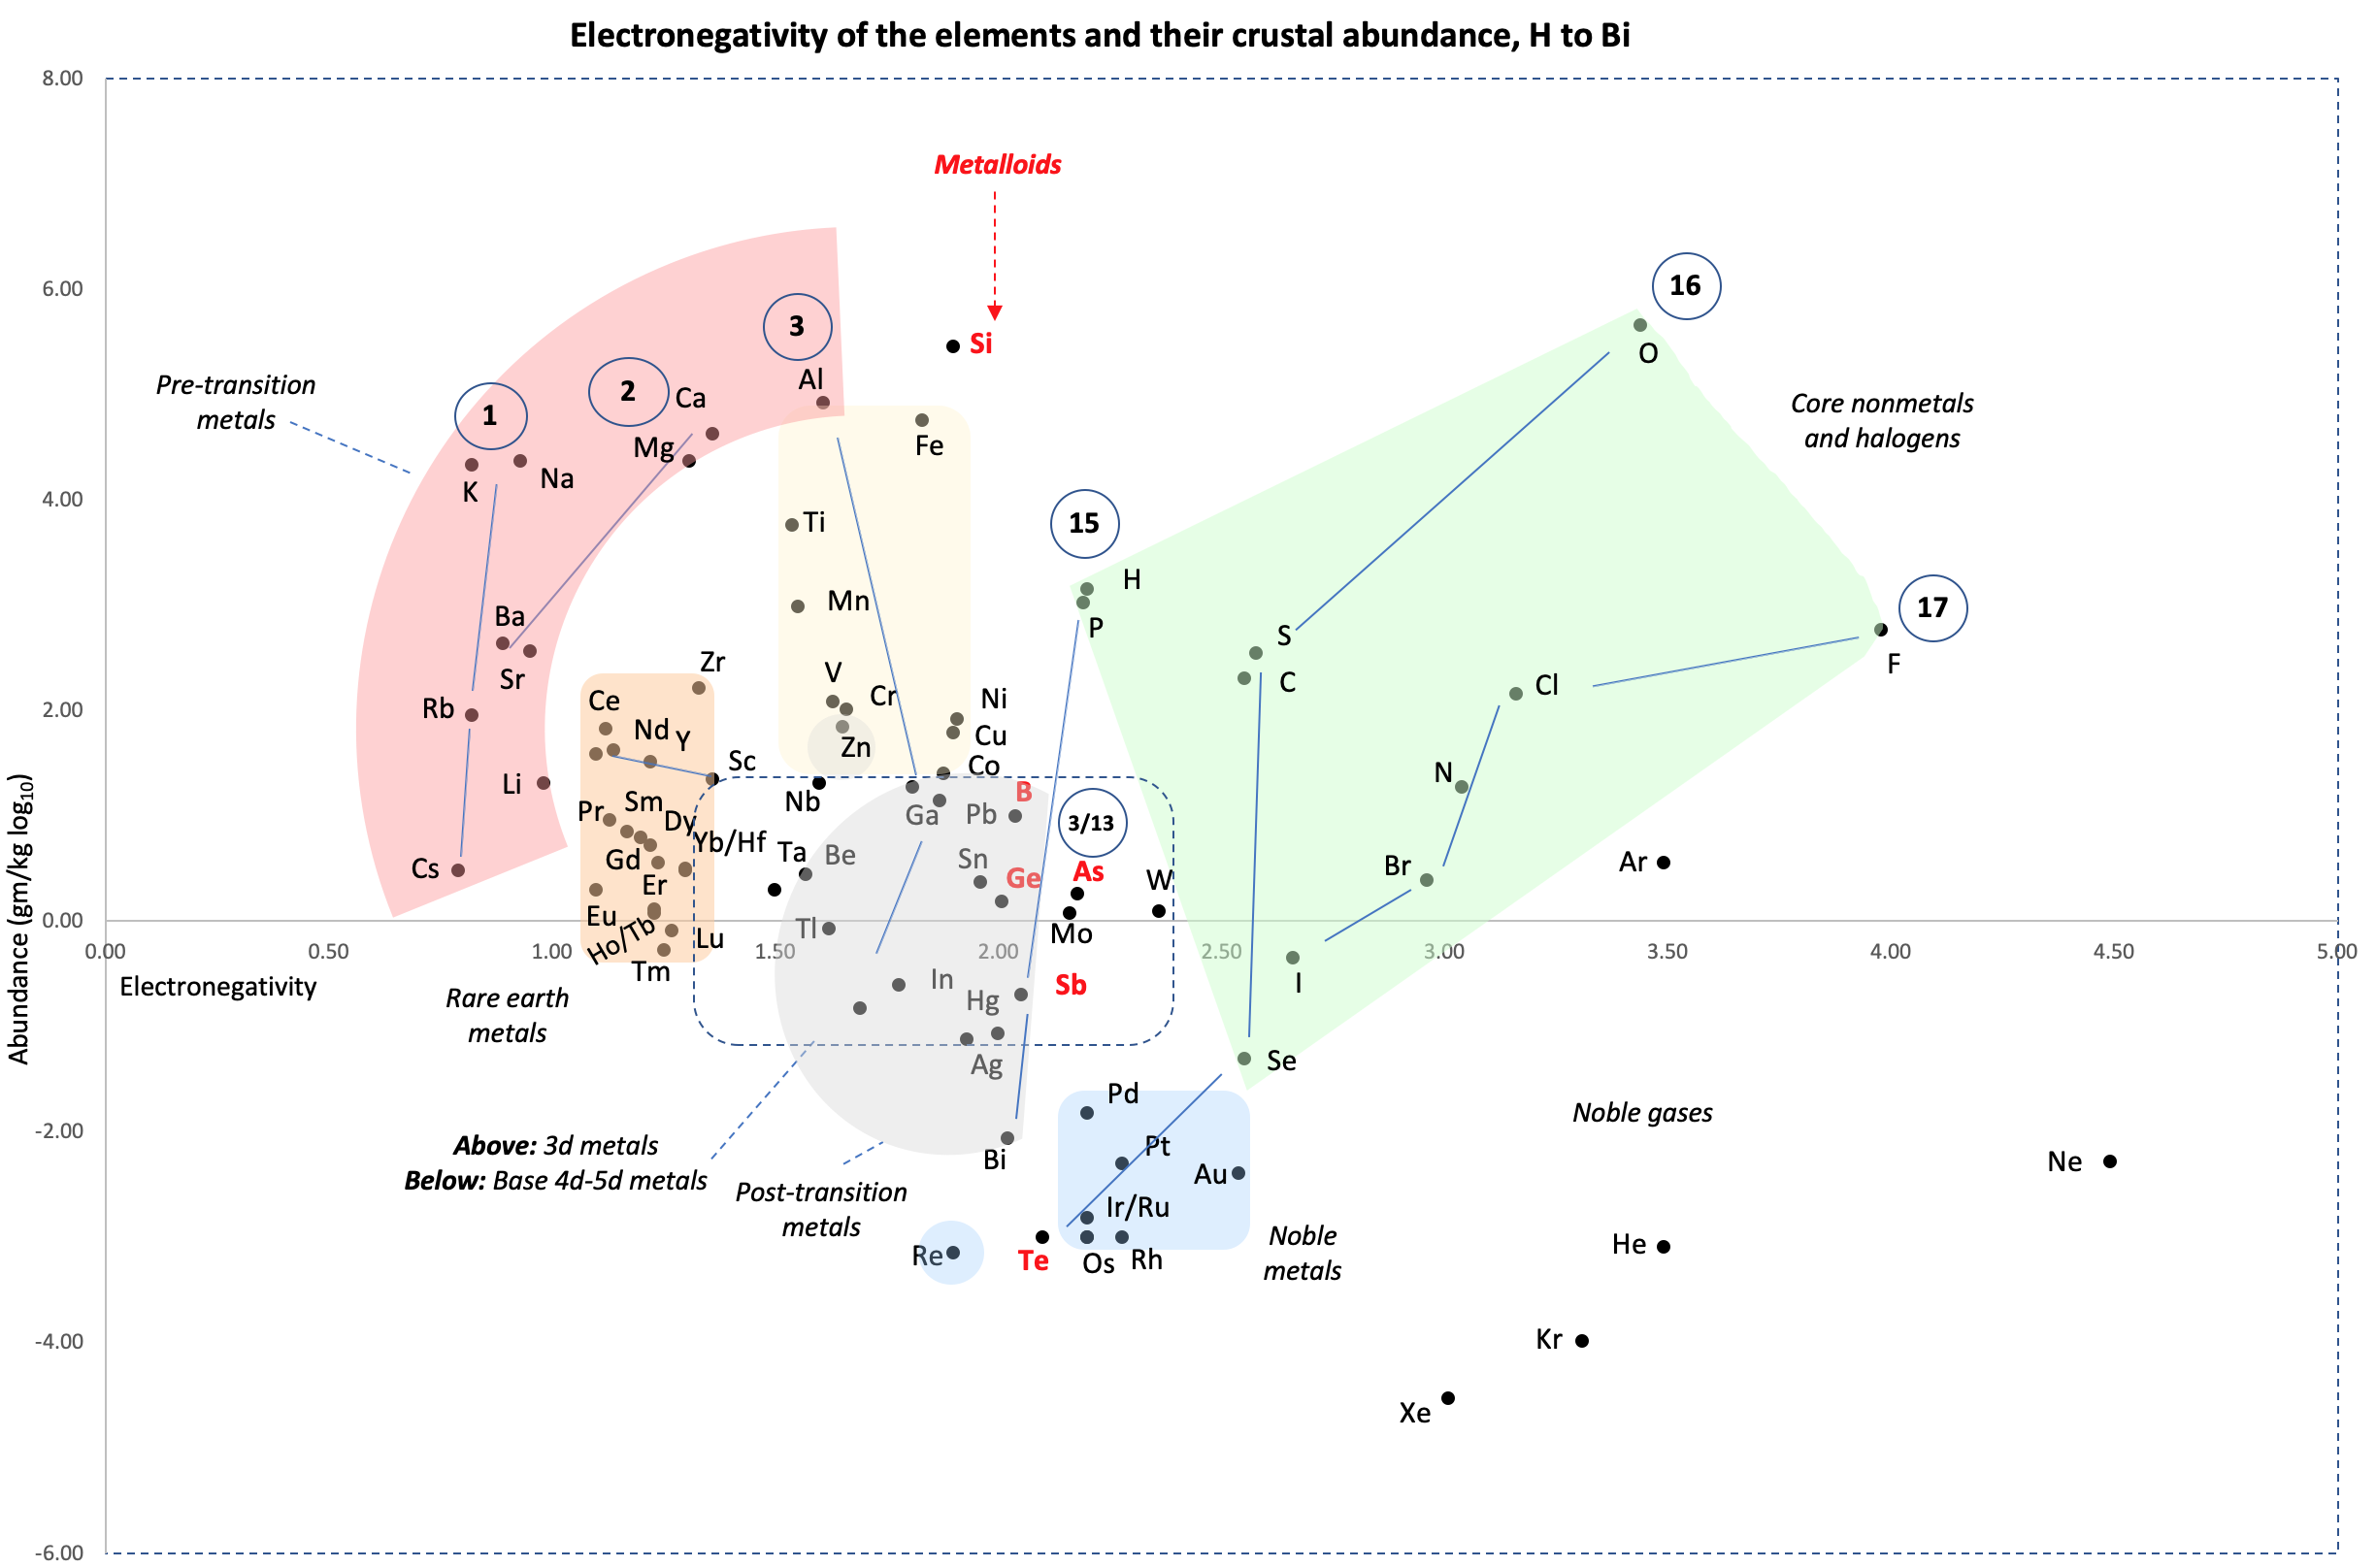
Crustal Abundance vs. Electronegativity
A chart by René Vernon of Elemental Abundance (g/kg log10) vs. Electronegativity, H to Bi.
René writes:
Below is a remarkable XY chart where x = electronegativity and y = crustal abundance (log10). It stops at the end of the s-process, at Bi. The abundance figures are from the CRC Hanbook of Physics and Chemistry (2016-2017).
I say remarkable as I had little idea what the chart would end up looking like when I started plotting the values.
As well as its coloured regions, I've marked out track lines for six of the main groups and one for group 3.
Observations
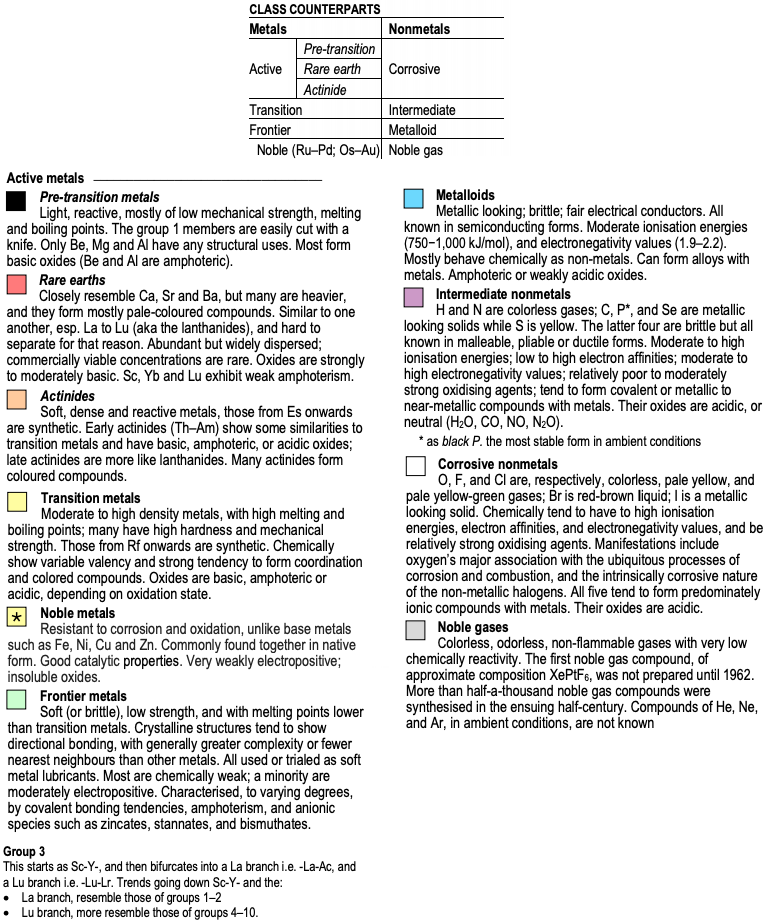
The rose-coloured arc on the left encompasses the pre-transition metals i.e. the alkali and alkaline earth metals and aluminium, followed by, in the orange rectangle, the rare earth metals. Opposite these regions, along the southern boundary of the green paddock, are the halogens.
In the pale yellow field sheltered by the pre-transition metals and the REM, are the 3d transition metals and, in the white corral, are 4d and 5d base transition metals. Opposite these regions, in the green paddock, are the core nonmetals H, C, N, O, P and S, with Se as an outlier.
Following in the grey blob are the post-transtion or poor metals, immediately adjacent to the bulk of the metalloids or poor nonmetals.
Finally, in the light blue patch, the noble metals are complemented by the noble gases frolicking in the open.
Abundance tends to decrease with increasing Z. Notable exceptions are Li, B, N and Si.
Curiosities
- H and P are almost on top of one another
- The proximity of Be to the post-transition metals, and its relative scarcity in the crust
- The metalloids, with their intermediate values of electronegativity, go down the middle. At the same time they span nearly the full range of abundance.
- B-Ga-Sc-Y-La are in a row
- N falls along the halogen line
- The abundance of O and Si, which we see in the form of silica
- F is more abundant in the crust than 85 percent of metals
- Al is the most abundant metal. Al and Fe are in the same vicinity: "Curiously, the chemistry of aluminium also resembles that of the iron(III) ion... These similarities may be ascribed to the same 3+ charge and near-identical ion radii (and hence charge density)." (Rayner-Canham 2020, p. 191)
- The abundance of Ar compared to the rest of the noble gases. Apparently this is influenced by the radioactive decay of potassium-40 in Earth's core, which is considered one of the main sources of heat powering the geodynamo that generates Earth's magnetic field. It has been suggested that a large amount of Ar may be present in the core, as the compound ArNi with an L11 Laves structure (similar to an intermetallic phase, and related to a cubic close packed lattice). ArNi is stabilised by notable electron transfer from Ni to Ar, changing their electron configurations toward 3d7 and 4s1. (Adeleke et al. 2019)
- Ti, a light yet strong metal, is about 2,500 times as abundant as Sn, a weak heavy metal
- Zn is an outlaw post-transition metal
- The most active 4d-5d transition metals (Zr, Hf) occupy a boundary overlap with the rare earth metals
- Ag, which has a largely main-group chemistry, is located in the PTM region. It is about 20 times as abundant as the noble meals
- Re is an outlaw noble metal
Comment
I was intrigued by the article referring to Ni and Ar, and the suggestion of Ar becoming somewhat anionic, albeit in extreme conditions (140 GPa, 1500 K)
References
- Adeleke AA, Kunz M, Greenberg E, Prakapenka VB, Yao Y, Stavrou R 2019, A high-pressure compound of argon and nickel: Noble gas in the Earth's core?, ACS Earth and Space Chemistry, vol. 3 no. 11, pp. 2517-2544, https://pubs.acs.org/doi/10.1021/acsearthspacechem.9b00212
- Rayner-Canham G, 2020, The periodic table: Past, present, future, World Scientific, Singapore
Correlations
I wasn't looking for these but they at least exist as follows:
- Metals with lower EN, i.e. < 1.7, or active nonmetals with higher EN, tend to be concentrated in silicate or oxide phases that are more easily found in the crust due to their lower density, and hence have higher abundances.
- Metals with moderate EN 1.7 to 2.1, say the later transition metals and post-transition metals, tend to form sulfide liquid phases; are less easily found in the crust due to their relatively higher densities; and are less abundant by about two orders of magnitude compared to the metals found in silicate or oxide phases.
- Metals with EN > 2.2, i.e. the noble metals, have an affinity for a metallic liquid phase, and are depleted in the crust since they generally sank to the core and hence have very low abundances. They are about two orders of magnitude less abundant than the sulfide metals.
My references are:
- Cox PA 1997, The elements: Their origin, abundance and distribution;
- Gill R 2014, Chemical fundamentals of geology and environmental geoscience;
- White WA 2020, Geochemistry
Thus the abundance of the metals in the crust tends to fall with increasing EN.
- For the nonmetals, the relative average abundance proportions are about 5: 700: 250: 1 for, respectively, the metalloids; the core nonmetals H, C, N, P, S, and Se; the halogen nonmetals; and the noble gases. Si and O were left out as outliers, in terms of their massive abundances.
- Thus, metalloids aside, the abundance of the nonmetals tends to fall with increasing EN. I don't know what's going on with the metalloids.
- The chart may prompt some further appreciative enquiry:
- In the case of exceptions to the initial three generalisations why do these occur?
- Why is Li so rare, compared to the other alkali metals?
- Why is Si good at forming a planetary crust?
An answer from L. Bruce Railsback, creator of the Earth Scientist's Periodic Table https://www.meta-synthesis.com/webbook/35_pt/pt_database.php?PT_id=142:
"I think I can answer one of the questions. 'Why is Si good at forming a planetary crust?' – because it's so bad at staying in the core. Silicon isn't sufficiently metallic to stay in the core. Even in the mantle and crust, it doesn't go into non-metal solids well: in cooling magmas, it's only a lesser member of the early-forming minerals (e.g., Mg2SiO4, forsterite, where it's outnumbered two to one). The mineral only of Si as a cation, SiO2 (quartz), is the LAST mineral to form as a magma cools, in essence the residuum of mineral-forming processes. At least some this thinking is at Bowen's Reaction Series and Igneous Rocks at http://railsback.org/FundamentalsIndex.html#Bowen"
- Why do the metalloids span such a wide range of abundances?
- If H is supposed to make up ca. 74% of the universe why does it have the same abundance in the Earth's crust as P?
- In what form is H found in Earth's crust—water, hydroxides?
- If H is supposed to make up ~ 74% of the universe why does it have the same abundance in the Earth's crust as P?
- Are there any chemical similarities between H and P, given both have some metalloidal character? The have virtually identically electron affinities. H is sometimes positioned above B due to chemical similarities. It then forms a diagonal relationship with C, which in turn has a diagonal relationship with P, which has a diagonal relationship with Se e.g. P reacts with Se to form a large number of compounds characterised by structural analogies derived from the white phosphorus P4 tetrahedron.
- The rare earth metals are relatively rare, having an average abundance of 1% that of the 3d metals. That being so, why is their rareness sometimes questioned? Why does the crustal abundance of the REM plummet by two orders of magnitude towards the end of the lanthanides?
Which Electronegativity Scale?
The wide variety of methods for deriving electronegativities tend to give results similar to one another.
1808
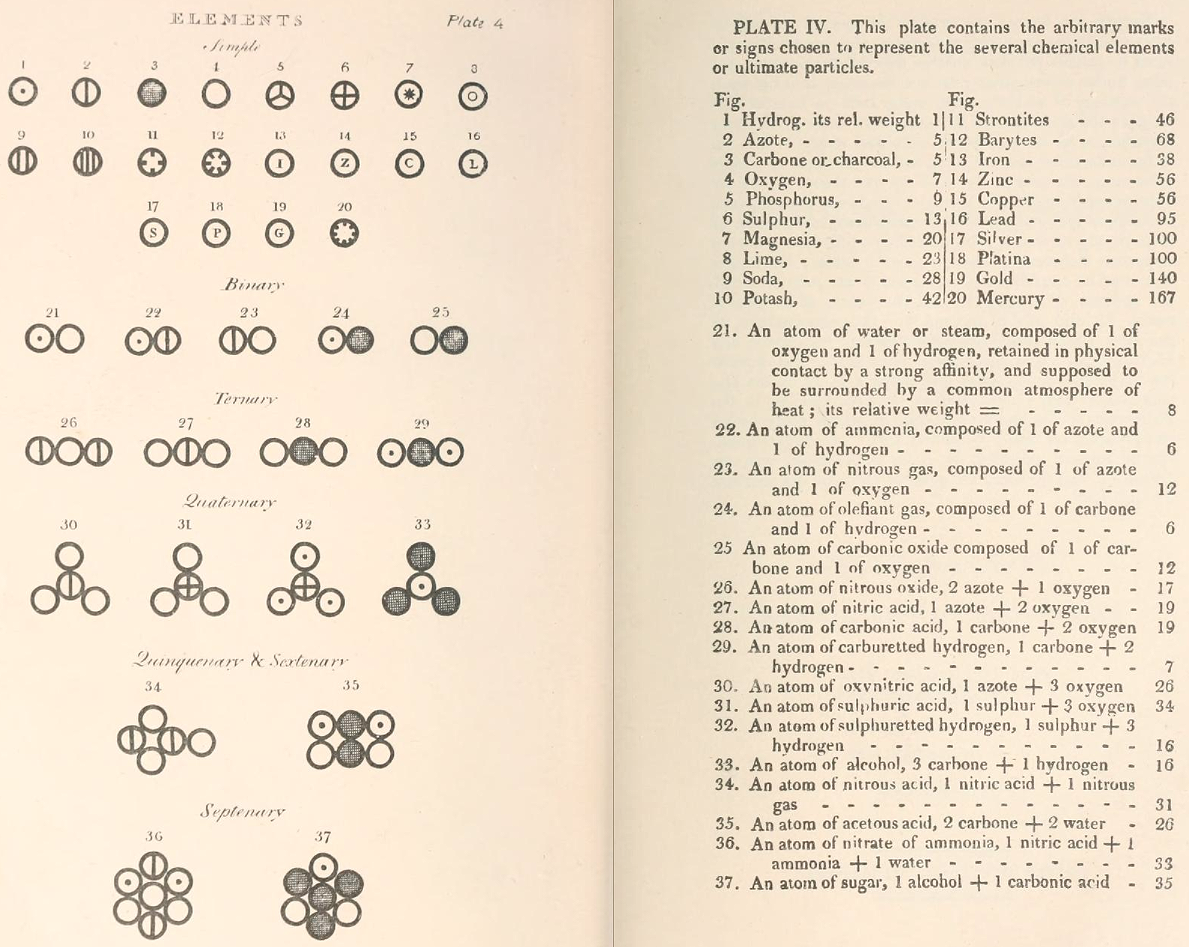
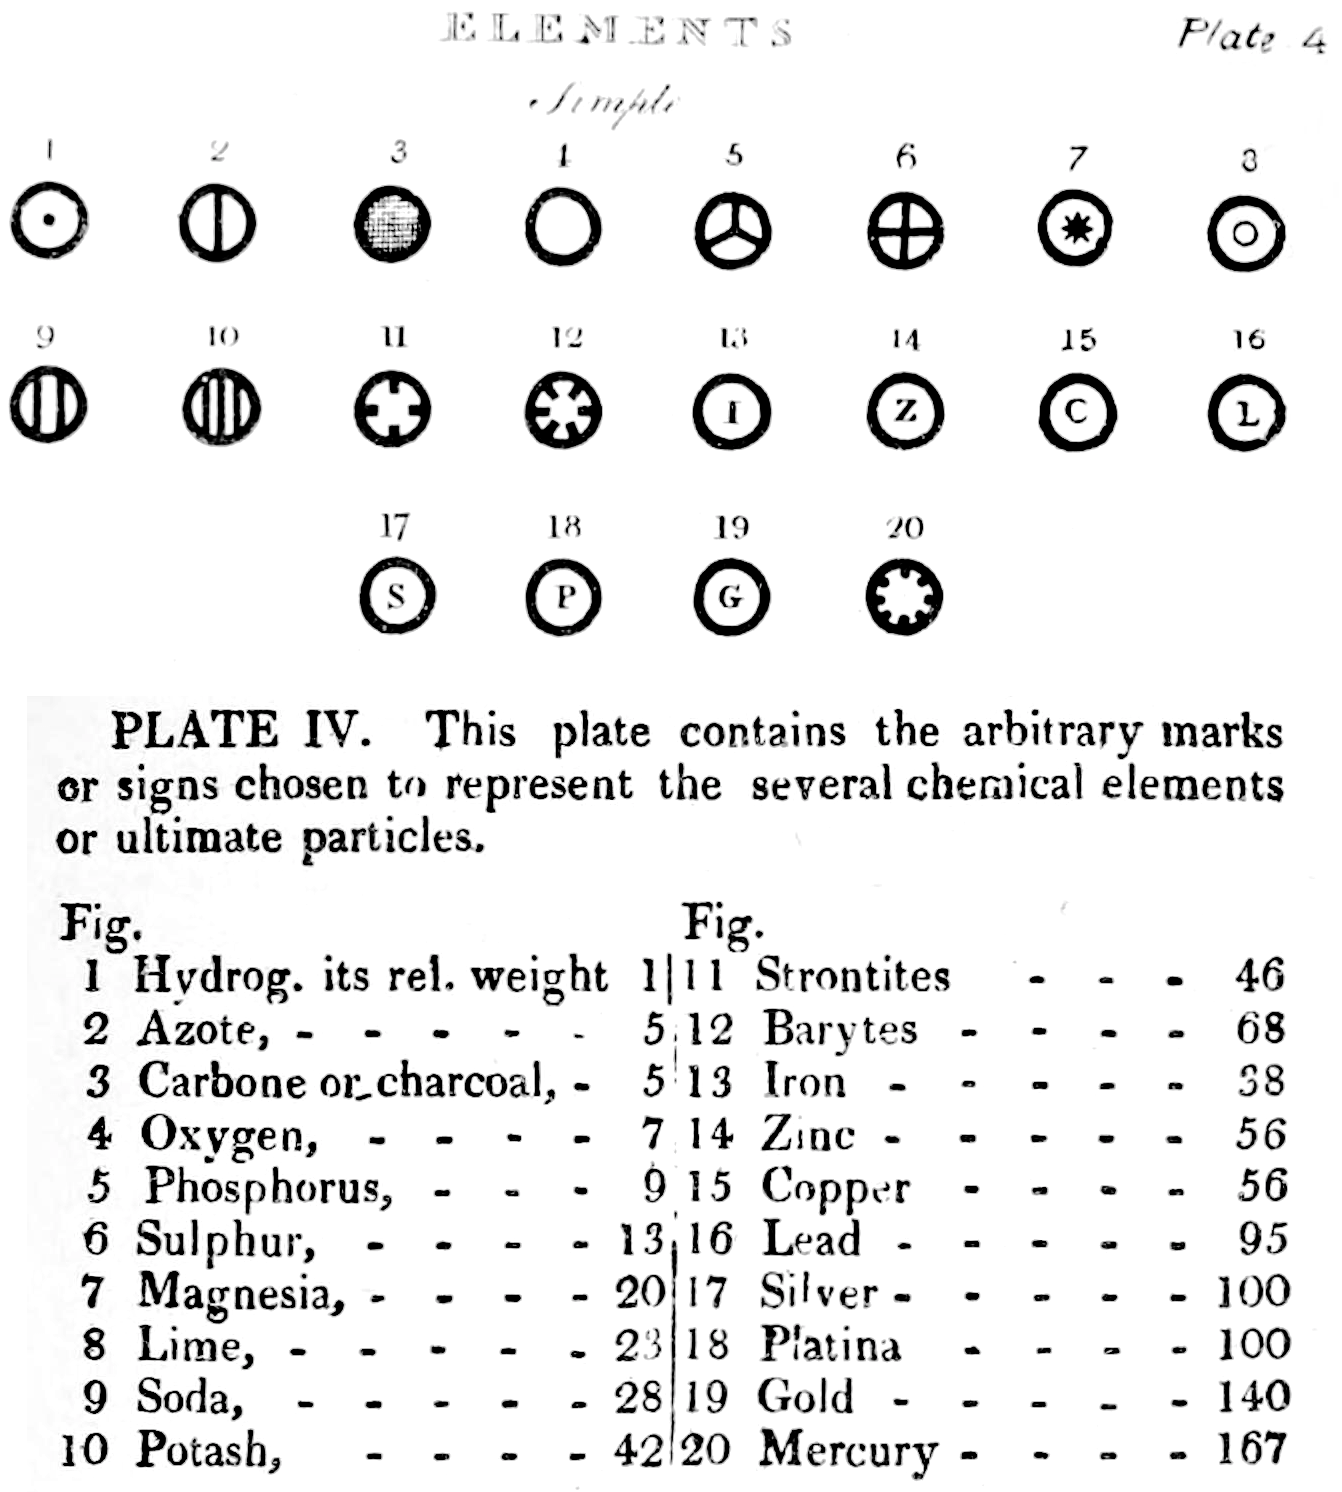
Dalton's Elements
Two pages from John Dalton's A New System of Chemical Philosophy in which he proposed his version of atomic theory based on scientific experimentation (see the scanned book, page 219):
| Name | Modern Symbol | Dalton's Data | Modern Values | % error |
| Hydrog. | H | 1 | 1 | 0% |
| Azote | N | 5 | 14 | -180% |
| Carbone | C | 5 | 12 | -140% |
| Oxygen | O | 7 | 16 | -129% |
| Phosphorus | P | 9 | 31 | -244% |
| Sulphur | S | 13 | 32.1 | -147% |
| Magnesia | Mg | 20 | 24.3 | -22% |
| Lime | Ca | 24 | 40.1 | -67% |
| Soda | Na | 28 | 23 | 18% |
| Potash | K | 42 | 39.1 | 7% |
| Strontites | Sr | 46 | 87.6 | -90% |
| Barytes | Ba | 68 | 137.3 | -102% |
| Iron | Fe | 50 | 55.8 | -12% |
| Zinc | Zn | 56 | 65.4 | -17% |
| Copper | Cu | 56 | 63.5 | -13% |
| Lead | Pb | 90 | 200.6 | -123% |
| Silver | Ag | 190 | 107.9 | 43% |
| Gold | Au | 190 | 197 | -4% |
| Platina | Pt | 190 | 195.1 | -3% |
| Mercury | Hg | 167 | 200.6 | -20% |
- Dalton states that he is considering "chemical elements or ultimate particles"
- Dalton assigns hydrogen as having a relative weight of 1.
- Note the seemingly huge % errors in the atomic weights, compared with modern values.
- These errors occurred because while Dalton had deduced that atoms combine in fixed (stoichiometric) ratios in compounds, he not always know what the ratios were. Thus there were two unknowns: the atomic weights (masses) and the stoichiometric ratios.
By Mark Leach
2018
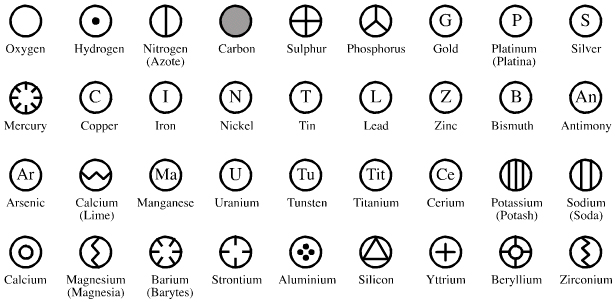
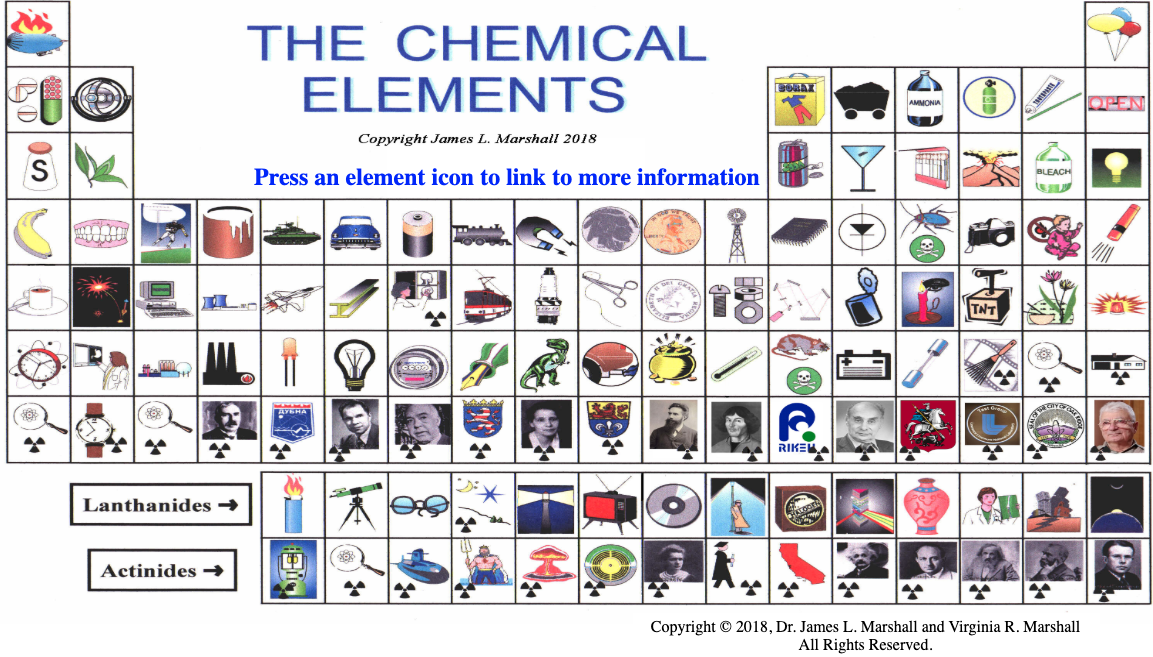
Data Rich Periodic Table
Explore James L. Marshall's data rich periodic table.
Dr. Marsall provided the location data for Carmen Giunta's interactive, searchable Google map of places associated with the developers of the periodic table and the chemical elements.
2012
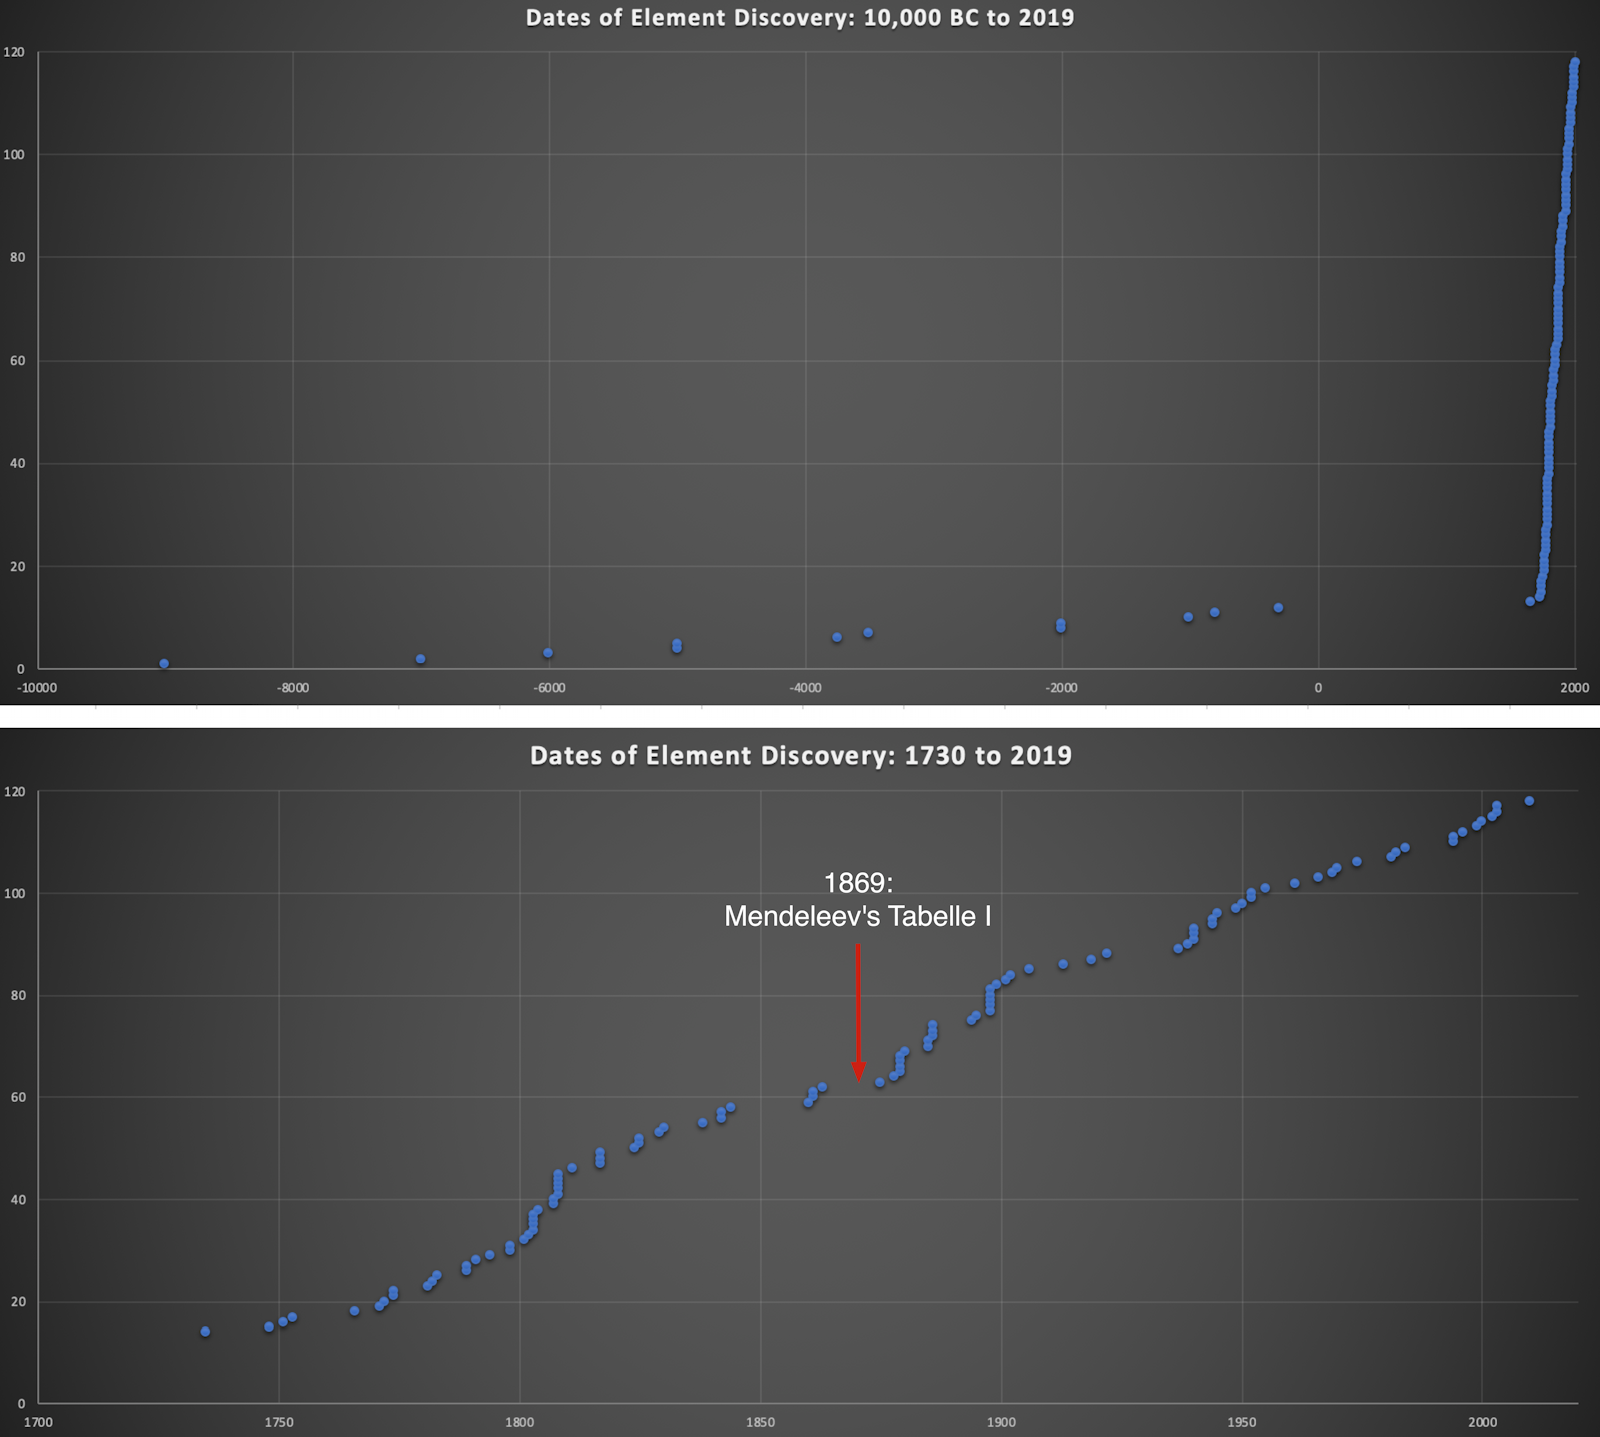
Dates of Discovery of the Elements
The Elements and their dates of discovery, taken from this Wikipedia page:
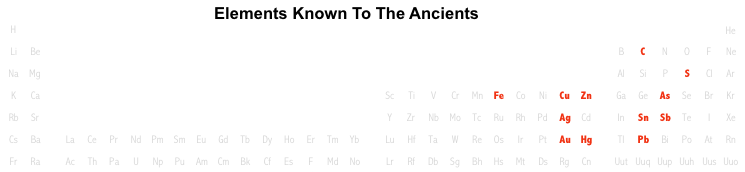
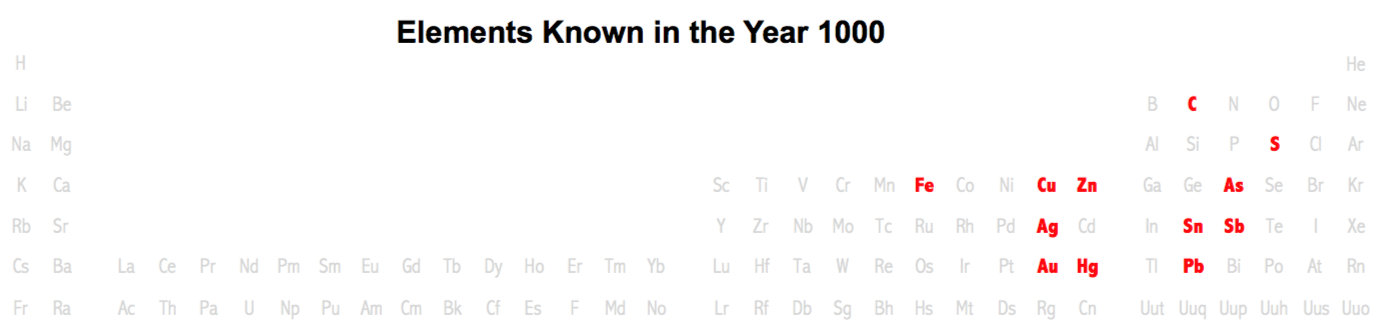
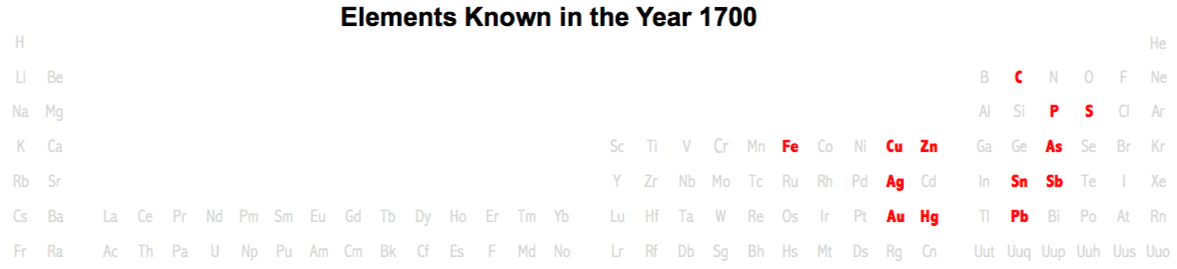
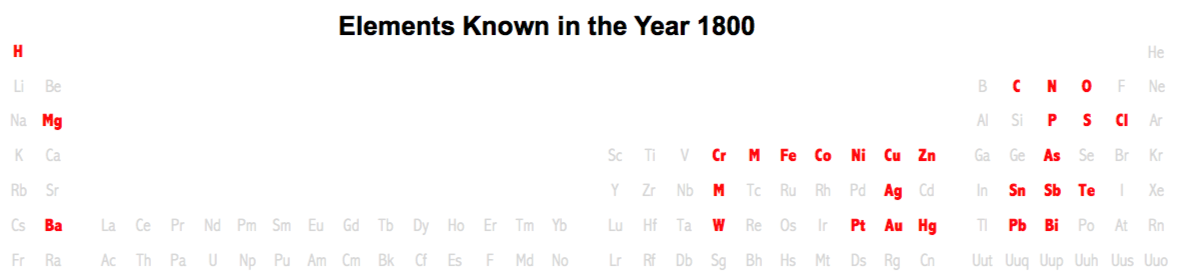
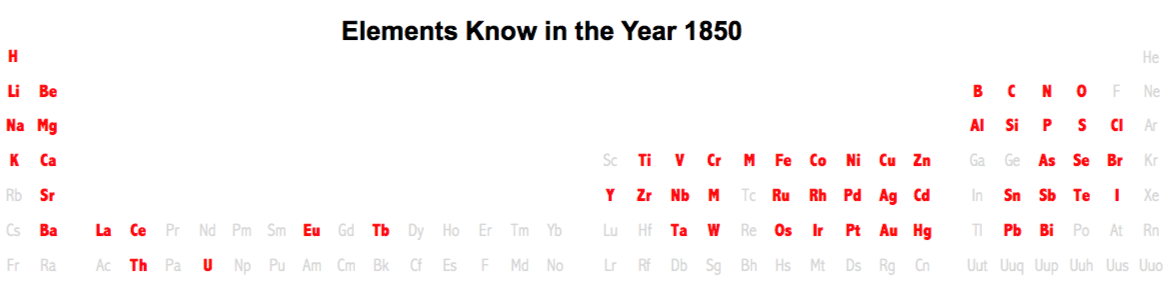
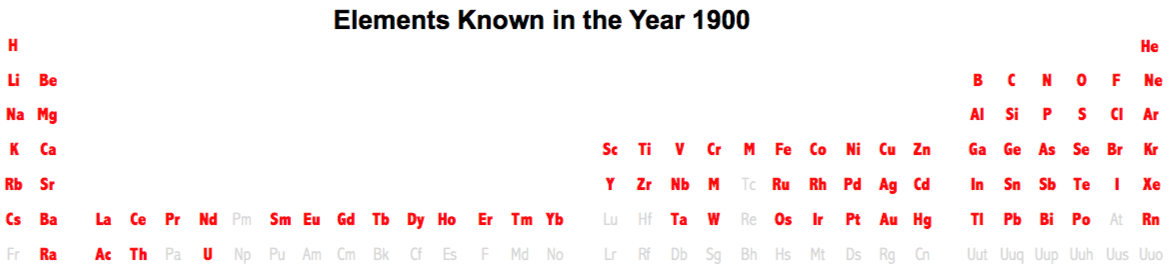
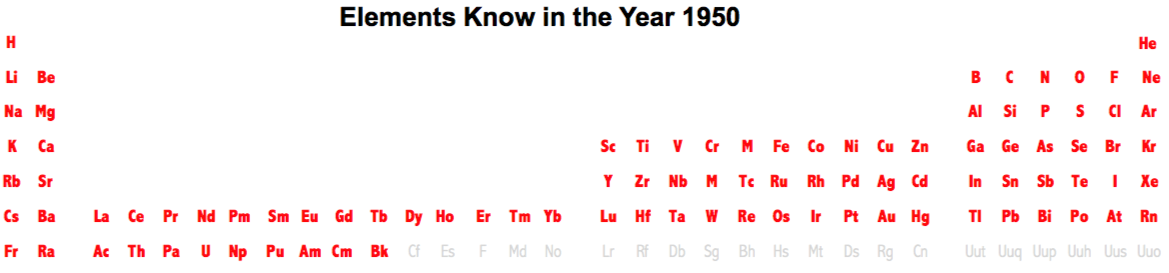
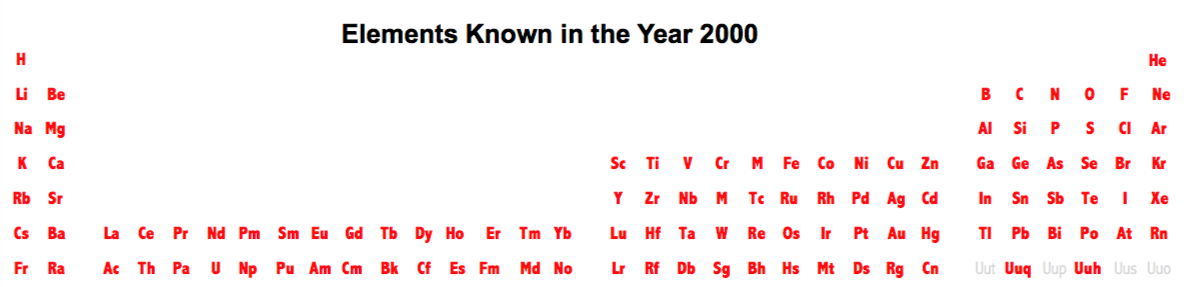
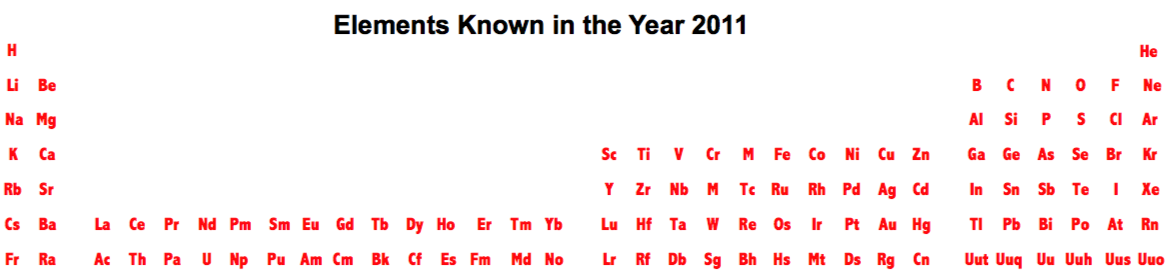
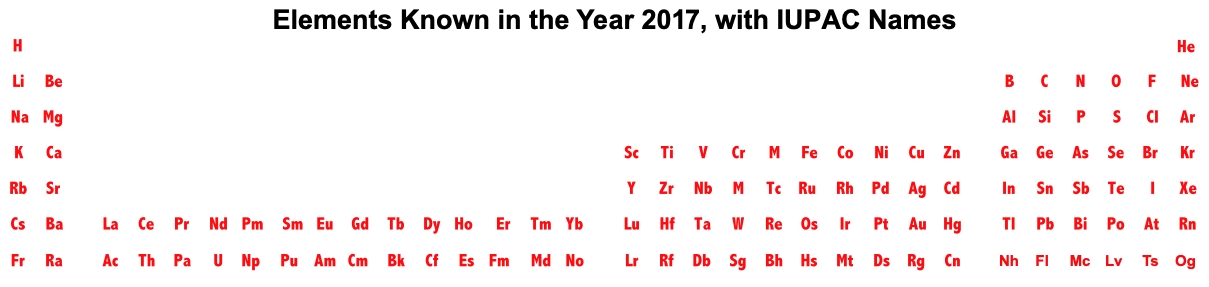
Two charts showing the dates of discovery of the elements, one from the 'time of the ancients' (10,000 BC) to the present day, and the second from 1700 to the present day.
These show that there were two distinct phases for the discovery of the 118 known elements:
- The first from about 10,000 BC to 1000 AD when 12 elements were discovered/used; one every 900 years or so.
- From 1669 until the present day when the other 106 have been rather steadily (and formally) discovered; one every couple of years.
- The last element to be made/discovered was in 2010.
Data from: this Wikipedia page.
| Discovery of Copper | -9000 |
| Discovery of Lead | -7000 |
| Discovery of Gold | -6000 |
| Discovery of Iron | -5000 |
| Discovery of Silver | -5000 |
| Discovery of Carbon | -3750 |
| Discovery of Tin | -3500 |
| Discovery of Sulfur (Sulphur) | -2000 |
| Discovery of Mercury | -2000 |
| Discovery of Zinc | -1000 |
| Discovery of Antimony | -800 |
| Discovery of Arsenic | -300 |
| Discovery of Phosphorus | 1669 |
| Discovery of Cobalt | 1735 |
| Discovery of Platinum | 1748 |
| Discovery of Nickel | 1751 |
| Discovery of Bismuth | 1753 |
| Discovery of Hydrogen | 1766 |
| Discovery of Oxygen | 1771 |
| Discovery of Nitrogen | 1772 |
| Discovery of Chlorine | 1774 |
| Discovery of Manganese | 1774 |
| Discovery of Molybdenum | 1781 |
| Discovery of Tellurium | 1782 |
| Discovery of Tungsten | 1783 |
| Discovery of Zirconium | 1789 |
| Discovery of Uranium | 1789 |
| Discovery of Titanium | 1791 |
| Discovery of Yttrium | 1794 |
| Discovery of Beryllium | 1798 |
| Discovery of Chromium | 1798 |
| Discovery of Niobium | 1801 |
| Discovery of Tantalum | 1802 |
| Discovery of Palladium | 1803 |
| Discovery of Cerium | 1803 |
| Discovery of Osmium | 1803 |
| Discovery of Iridium | 1803 |
| Discovery of Rhodium | 1804 |
| Discovery of Sodium | 1807 |
| Discovery of Potassium | 1807 |
| Discovery of Boron | 1808 |
| Discovery of Magnesium | 1808 |
| Discovery of Calcium | 1808 |
| Discovery of Strontium | 1808 |
| Discovery of Barium | 1808 |
| Discovery of Iodine | 1811 |
| Discovery of Lithium | 1817 |
| Discovery of Selenium | 1817 |
| Discovery of Cadmium | 1817 |
| Discovery of Silicon | 1824 |
| Discovery of Aluminium (Aluminum) | 1825 |
| Discovery of Bromine | 1825 |
| Discovery of Thorium | 1829 |
| Discovery of Vanadium | 1830 |
| Discovery of Lanthanum | 1838 |
| Discovery of Terbium | 1842 |
| Discovery of Erbium | 1842 |
| Discovery of Ruthenium | 1844 |
| Discovery of Cesium | 1860 |
| Discovery of Rubidium | 1861 |
| Discovery of Thallium | 1861 |
| Discovery of Indium | 1863 |
| Discovery of Gallium | 1875 |
| Discovery of Ytterbium | 1878 |
| Discovery of Scandium | 1879 |
| Discovery of Samarium | 1879 |
| Discovery of Holmium | 1879 |
| Discovery of Thulium | 1879 |
| Discovery of Gadolinium | 1880 |
| Discovery of Praseodymium | 1885 |
| Discovery of Neodymium | 1885 |
| Discovery of Fluorine | 1886 |
| Discovery of Germanium | 1886 |
| Discovery of Dysprosium | 1886 |
| Discovery of Argon | 1894 |
| Discovery of Helium | 1895 |
| Discovery of Neon | 1898 |
| Discovery of Krypton | 1898 |
| Discovery of Xenon | 1898 |
| Discovery of Polonium | 1898 |
| Discovery of Radium | 1898 |
| Discovery of Radon | 1899 |
| Discovery of Europium | 1901 |
| Discovery of Actinium | 1902 |
| Discovery of Lutetium | 1906 |
| Discovery of Protactinium | 1913 |
| Discovery of Rhenium | 1919 |
| Discovery of Hafnium | 1922 |
| Discovery of Technetium | 1937 |
| Discovery of Francium | 1939 |
| Discovery of Astatine | 1940 |
| Discovery of Neptunium | 1940 |
| Discovery of Plutonium | 1940 |
| Discovery of Americium | 1944 |
| Discovery of Curium | 1944 |
| Discovery of Promethium | 1945 |
| Discovery of Berkelium | 1949 |
| Discovery of Californium | 1950 |
| Discovery of Einsteinium | 1952 |
| Discovery of Fermium | 1952 |
| Discovery of Mendelevium | 1955 |
| Discovery of Lawrencium | 1961 |
| Discovery of Nobelium | 1966 |
| Discovery of Rutherfordium | 1969 |
| Discovery of Dubnium | 1970 |
| Discovery of Seaborgium | 1974 |
| Discovery of Bohrium | 1981 |
| Discovery of Meitnerium | 1982 |
| Discovery of Hassium | 1984 |
| Discovery of Darmstadtium | 1994 |
| Discovery of Roentgenium | 1994 |
| Discovery of Copernicium | 1996 |
| Discovery of Flerovium | 1999 |
| Discovery of Livermorium | 2000 |
| Discovery of Oganesson | 2002 |
| Discovery of Nihonium | 2003 |
| Discovery of Moscovium | 2003 |
| Discovery of Tennessine | 2010 |
By Mark Leach
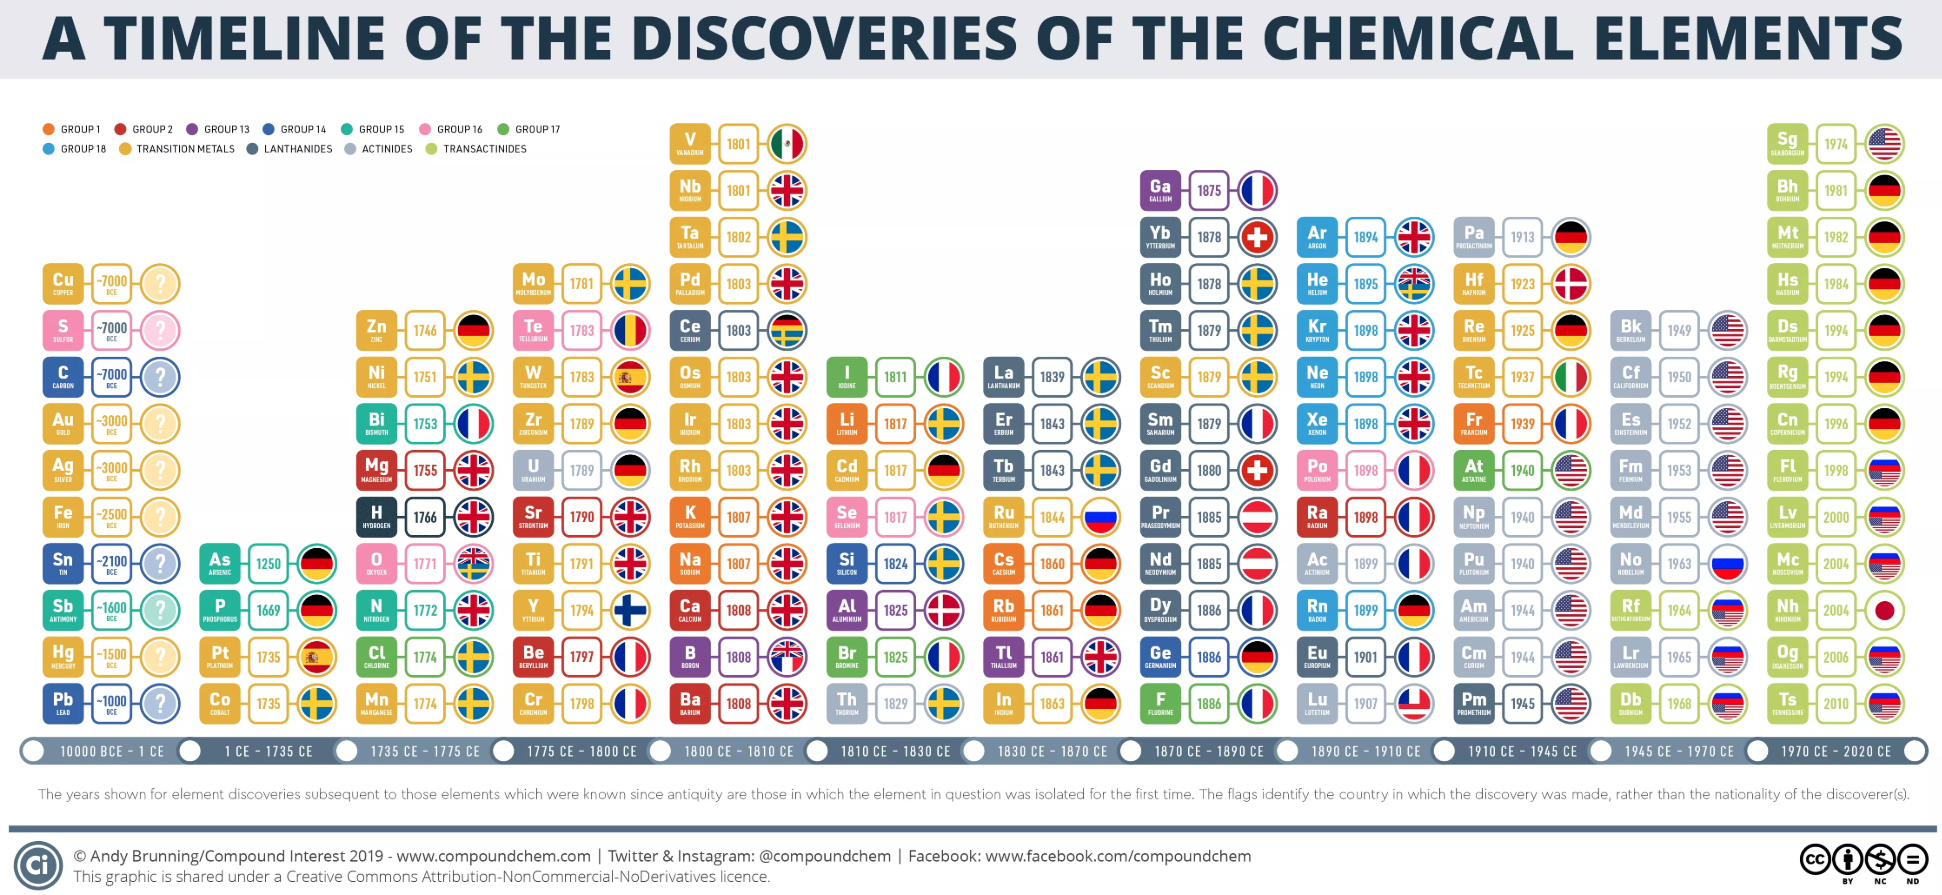
A nice graphic from Compound Interest: (click image to enlarge)
1831
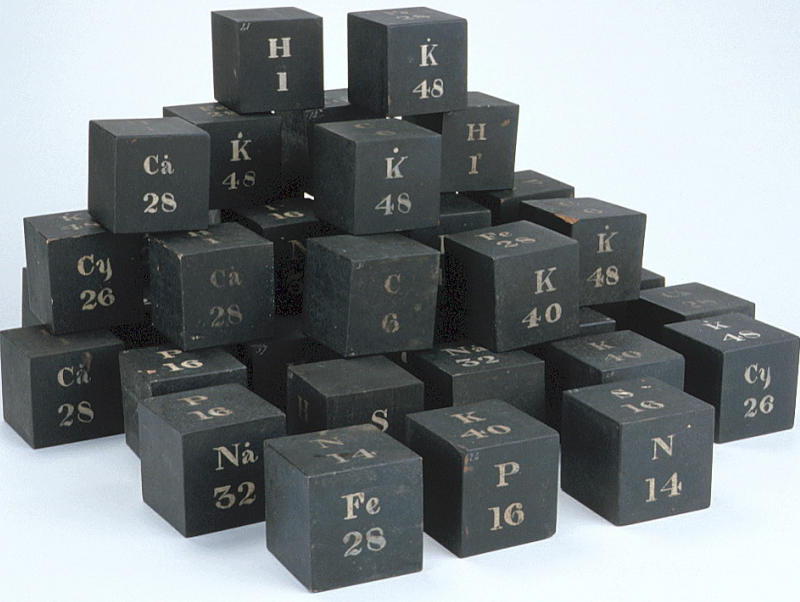
Daubeny's Teaching Display Board & Wooden Cubes of Atomic Weights
The Museum of the History of Science, Oxford, has a display of Charles Daubeny's teaching materials, including a black painted wooden board with "SYMBOLS OF SIMPLE BODIES": showing symbols, atomic weights and names of elements in two columns, and a small pile of cubes with element symbols.
Charles Daubeny and Chemistry at the Old Ashmolean
Charles Daubeny (1795-1867) was appointed Aldrichian Professor of Chemistry at Oxford in 1822. In 1847 he moved from the original laboratory in this basement [in the museum] to a new one built at his own expense at the Botanic Garden. His apparatus went with him and was preserved there. Daubeny actively campaigned for the teaching of science in Oxford and held several professorships in addition to chemistry. He also conducted research on subjects such as photosynthesis.
From the HSM Database (Inventory no. 17504):
DAUBENY'S LIST OF ATOMIC WEIGHTS Wooden panel, black with white lettering, listing in two columns the symbols and names of twenty elements. This lecture board is identical to the table in the third edition (1831) of E. Turner, 'Elements of Chemistry', apart from the atomic weight for bromine. Daubeny wrote a useful 'Introduction to the Atomic Theory' (published in three versions: 1831, 1840, and 1850), the first edition of which also quotes Turner's table. Probably contemporary with this lecture board are the wooden cubes with the symbols for certain elements.
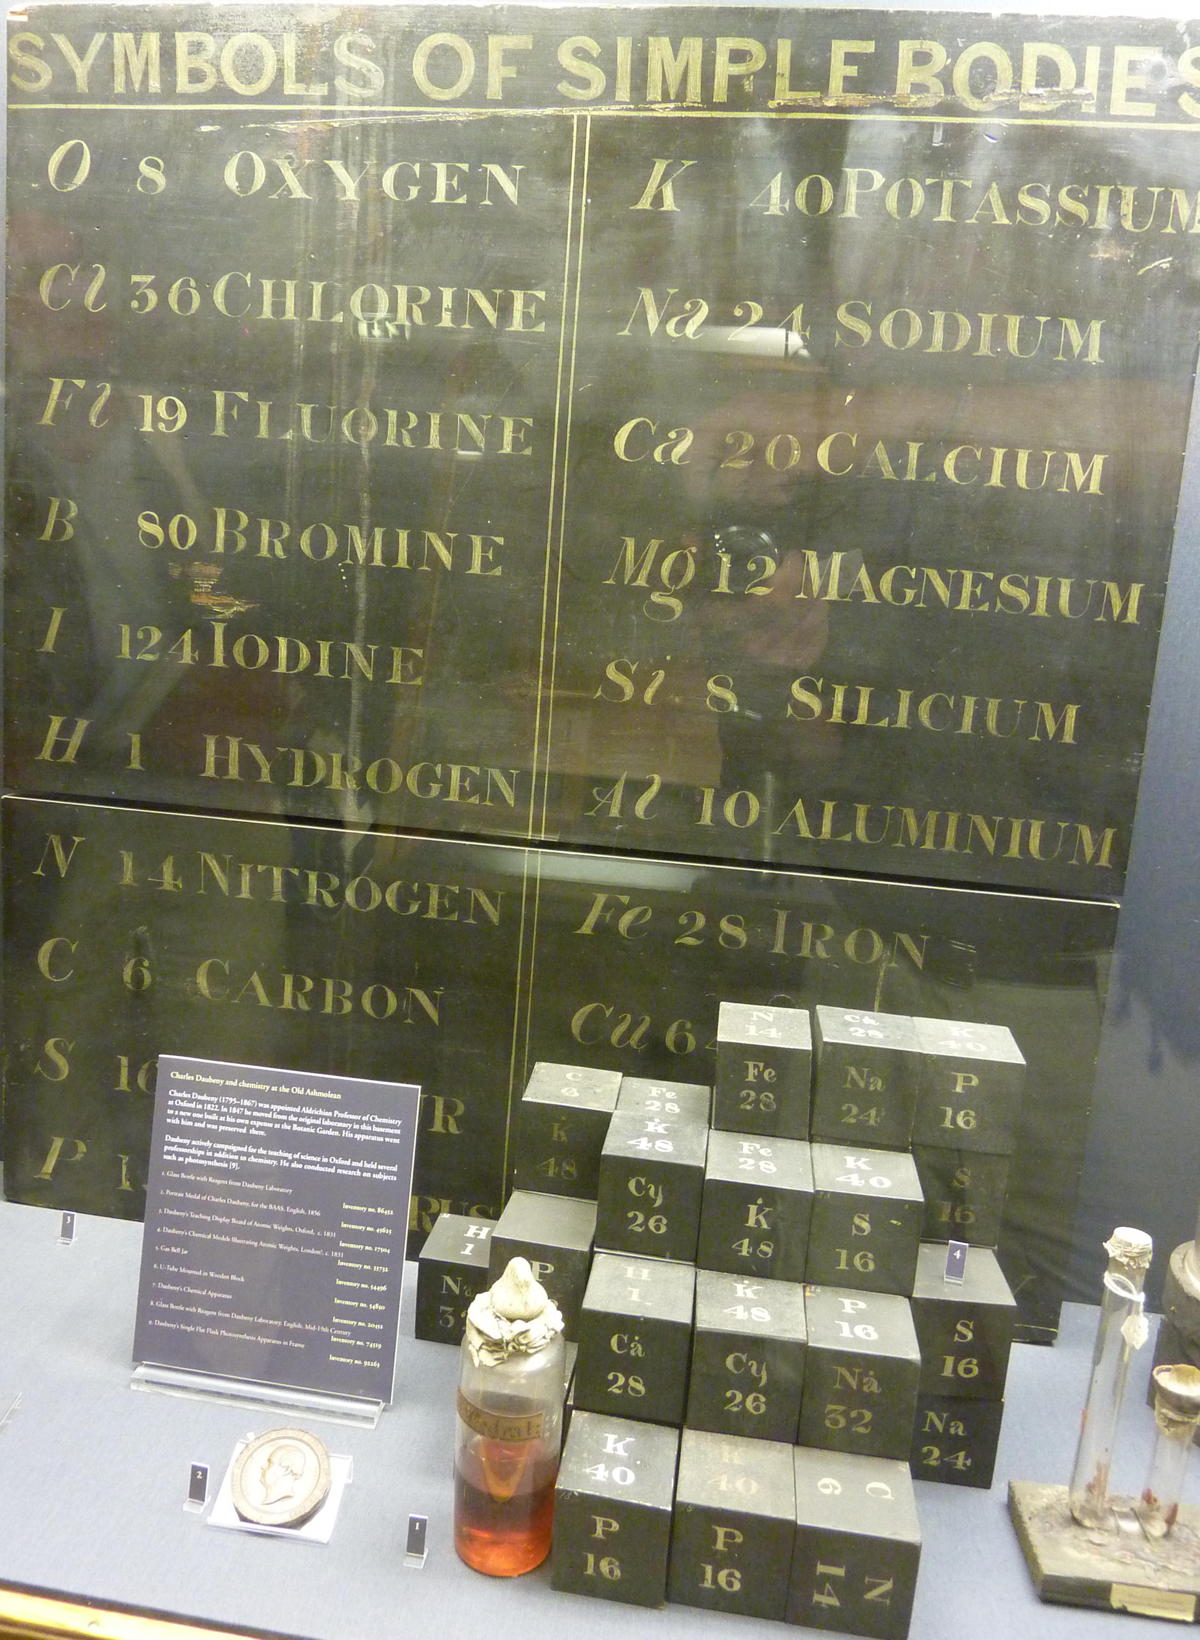
The period from 1810 to 1860 was crucial in the development of the periodic table. Most of the main group and transition elements had been discovered, but their atomic weights and stoichiometries (combining ratios) had not been fully deduced. Oxygen was assumed to have a weight of 6, and consequently carbon is assumed to have a mass of 6.
Daubeny's element symbols and weights – along with the modern mass data – are tabulated:
| Symbol | Daubeny's Weight | Modern Mass Data | % error | Stoichiometry Error |
| H | 1 | 1 | 0% | |
| C | 6 | 12 | -100% | factor of 2 |
| O | 8 | 16 | -100% | factor of 2 |
| Si | 8 | 28.1 | -251% | factor of 5 (?) |
| Al | 10 | 27 | -170% | factor of 3 |
| Mg | 12 | 24.3 | -103% | factor of 2 |
| N | 14 | 14 | 0% | |
| S | 16 | 32.1 | -101% | factor of 2 |
| P | 16 | 31 | -94% | factor of 2 |
| Fl | 19 | 19 | 0% | |
| Ca | 20 | 40.1 | -101% | factor of 2 |
| Na | 24 | 23 | 4% | |
| Fe | 28 | 55.8 | -99% | factor of 2 |
| Cl | 36 | 35.5 | 1% | |
| K | 40 | 39.1 | 2% | |
| Cu | 64 | 63.5 | 1% | |
| B | 80 | 79.9 | 0% | |
| Pb | 104 | 207 | -99% | factor of 2 |
| I | 124 | 127 | -2% | |
| Hg | 200 | 200.6 | 0% |
While quite a number of weights are close to the modern values, many are way out. However, the error is usually a stiotoimetric factor error.
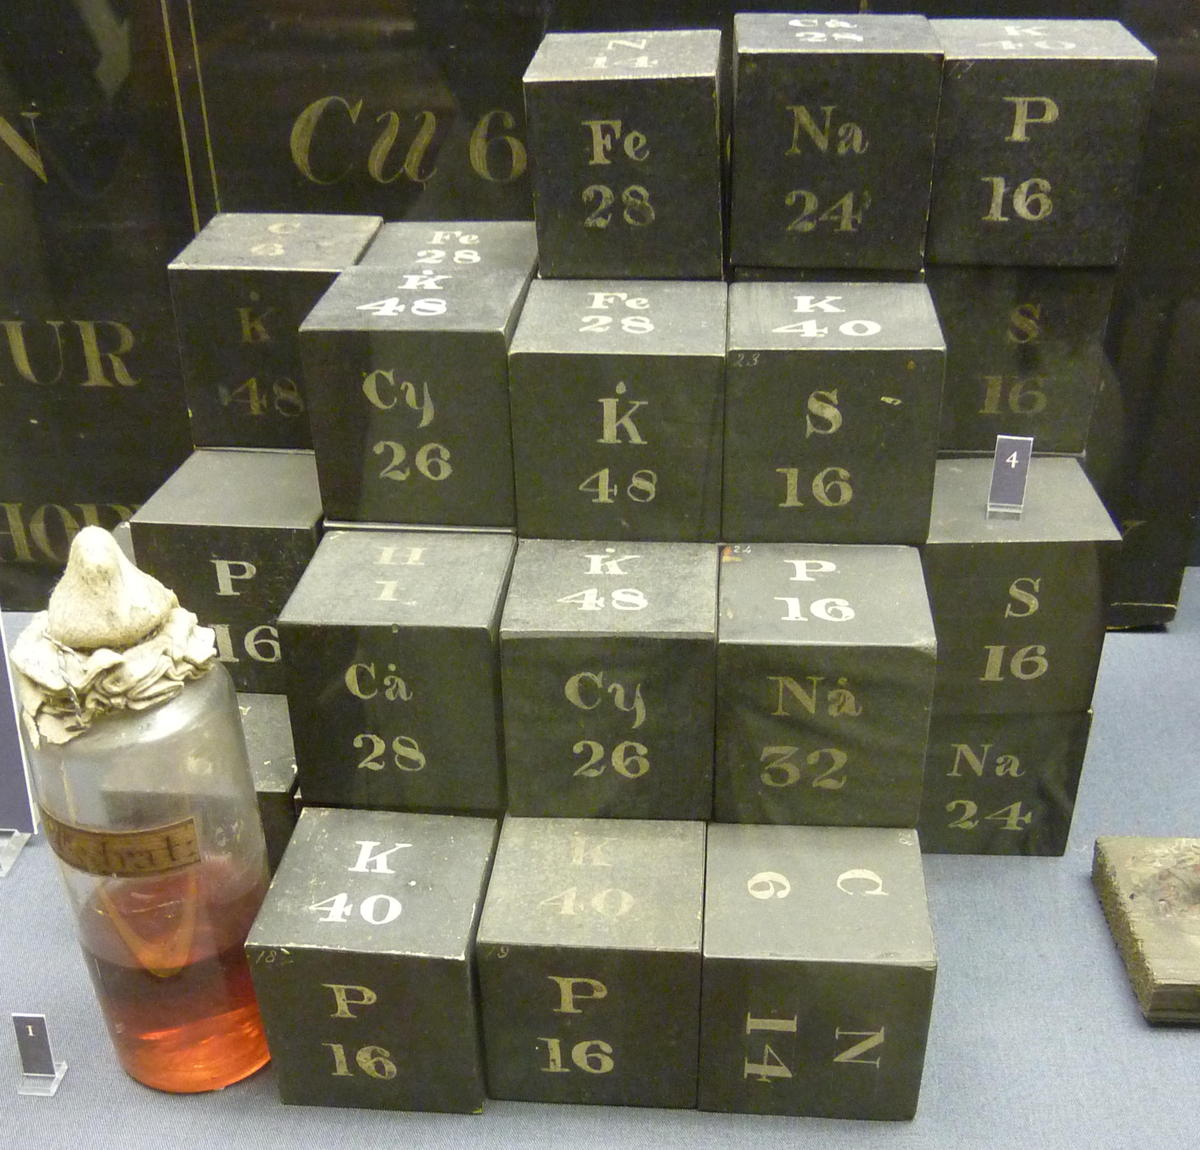
From the HSM Database (Inventory no. 33732): SET OF WOODEN CUBES ILLUSTRATING ATOMIC WEIGHTS
Forty-two wooden cubes numbered 1-42, painted black with symbols for certain elements, compounds or radicals painted in white on the faces, together with the corresponding atomic, molecular or radical weights. The face markings appear in various combinations:
| H | C | P | Na | Ca° | S | N | K | Fe | K | Na° | Cy | K° |
| 1 | 6 | 16 | 24 | 28 | 16 | 14 | 40 | 28 | 48 | 32 | 26 | 48 |
A typical cube (no. 3) may be represented by the following figure. They present something of an enigma as their faces do not form an obvious pattern. The numbers indicate that there were 42 cubes. In style they are similar to the figures on the panel of atomic weights.
The cubes are listed in Daubeny's 1861 catalogue, p. 11 as: "Wooden cubes for illustrating atomic weight". [See D. R. Oldroyd, The Chemical Lectures at Oxford (1822-1854) of Charles Daubeny, M.D., F.R.S. Notes and Records of the Royal Society, vol. 33 (1979), pp. 217-259.]
This display was spotted by Eric Scerri who was visiting the museum with Mark Leach in 2010.
There is a virtual tour on the museum, and the above display is in the basement.
2009
Download Excel, Word & PDF Periodic Tables for Printing, etc.
A periodic table in Excel spreadsheet format by Jeff Bigler of Waltham HS:
An excellent and detailed Two Page .pdf Periodic Table from Consol:
2010
Dynamic Periodic Table
Michael Dayah's Dynamic Periodic Table, in development since 1997, is a traditional data presentation periodic table with a beautiful, flexible & fast user interface.
For example, when selecting "MP", "BP", "Discovery", etc. a slider appears and the PT changes in colour dynamically to reflect the change. PDF and PNG versions can be downloaded:
Highly recommended!
2003
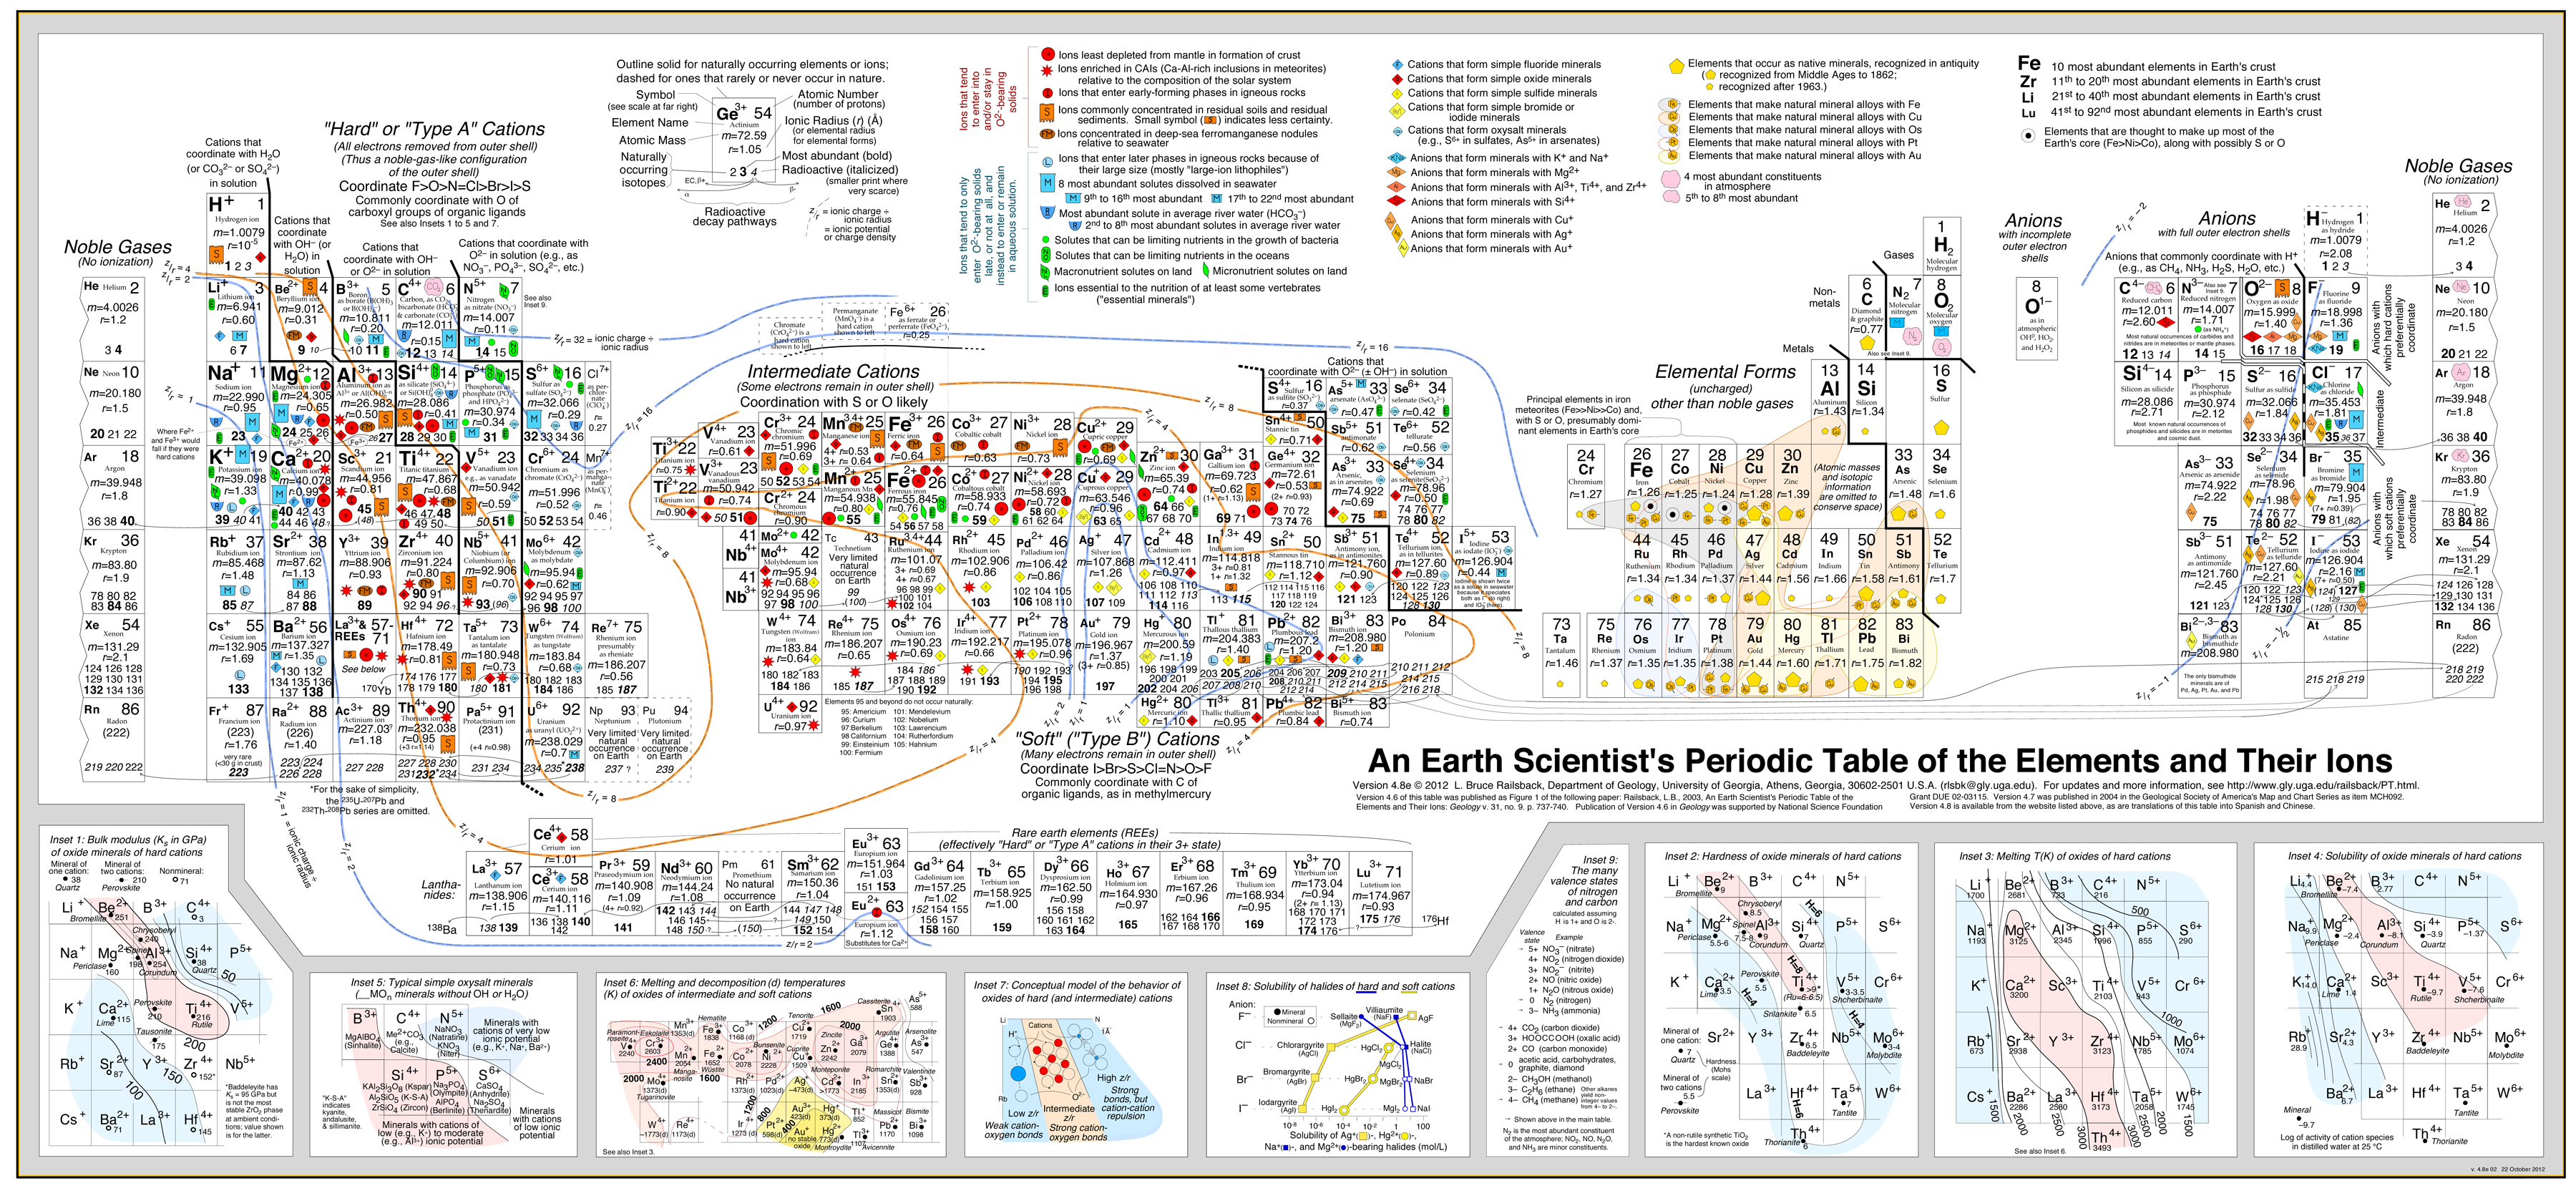
Earth Scientist's Periodic Table of The Elements and Their Ions
by Bruce Railsback.
Click to enlargeThe Earth Scientist's Periodic Table of the Elements and Their Ions is a new periodic table designed to contextualize trends in geochemistry, mineralogy, aqueous chemistry, and other natural sciences. It is fundamentally different from the conventional periodic table in organizing entities by charge and consequently in showing many elements multiple times because of the multiple charges or valence states taken by those elements. These differences make the new table much more effective in showing trends and patterns in geochemistry, mineralogy, aqueous chemistry, and other natural sciences.
Version 4.6 of this table was published in September 2003 as an article in the Geological Society of America's journal Geology and subsequently featured in several news outlets. Version 4.7 was published in May 2004 in the Geological Society of America's Map and Chart Series. Version 4.8 was released in May 2007.
2000
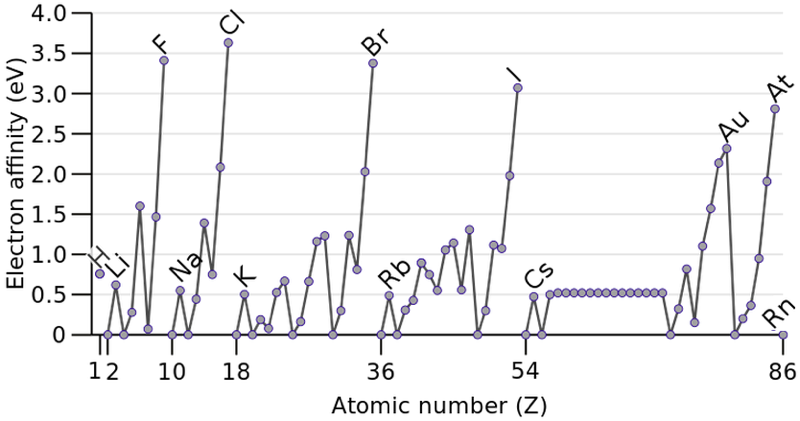
Electron Affinity
In chemistry and atomic physics, the electron affinity of an atom is defined as the energy change when an electron is added to a neutral atom to form a negative ion:
M + e– —> M– + energy:
2008
Electron Slell Periodic Table
A Wikipedia Periodic Tables of the Elements showing the Electron Shells:

2013
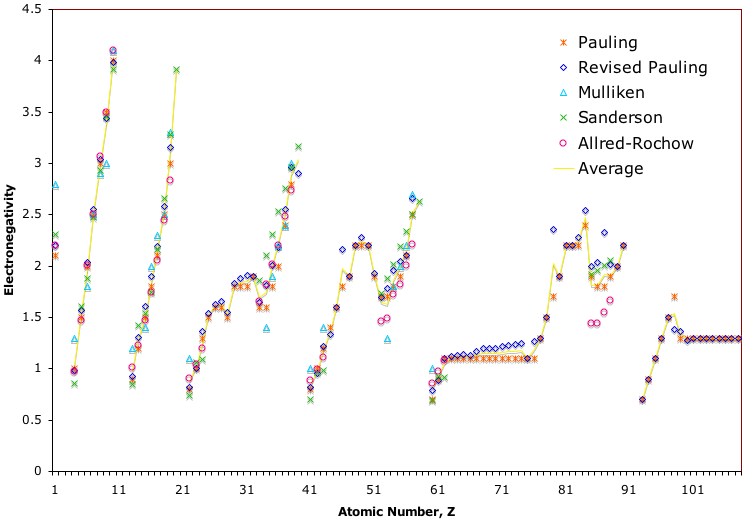
Electronegativity Chart (Leach)
From Mark R Leach's paper, Concerning electronegativity as a basic elemental property and why the periodic table is usually represented in its medium form, Journal & PDF.
Due to the importance of Pauling's electronegativity scale, as published in The Nature of The Chemical Bond (1960), where electronegativity ranges from Cs 0.7 to F 4.0, all the other electronegativity scales are routinely normalised with respect to Pauling's range.
When the Pauling, Revised Pauling, Mulliken, Sanderson and Allred-Rochow electronegativity scales are plotted together against atomic number, Z, the similarity of the data can be observed. The solid line shows the averaged data:
2003
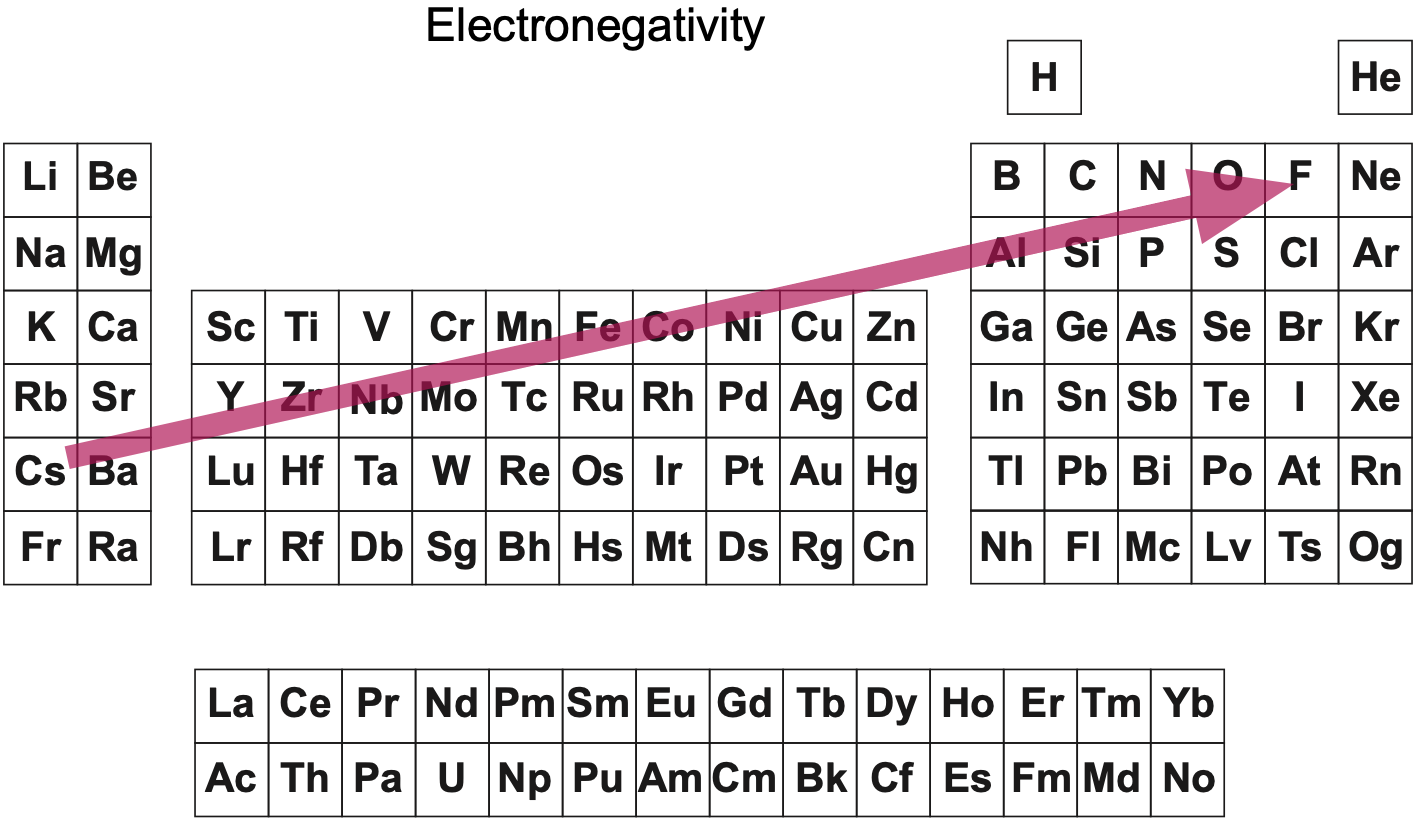
Electronegativity Periodic Table
A periodic table showing electronegativity, "The ability of an atom to attract electron density from a covalent bond" (Linus Pauling). Blue elements are electronegative, red elements are electropositive, and purple elements are intermediate. Notice how hydrogen is intermediate in electronegativity between carbon and boron and is positioned above and between these elements:
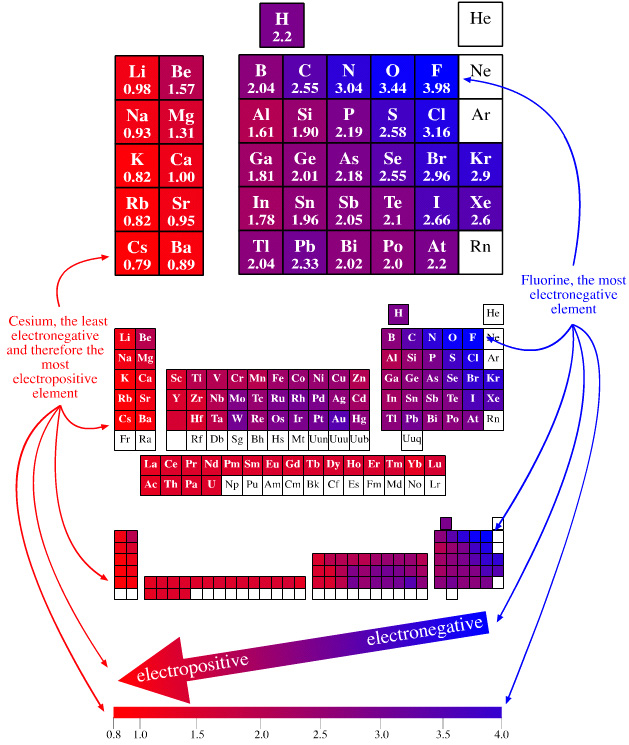
By Mark Leach
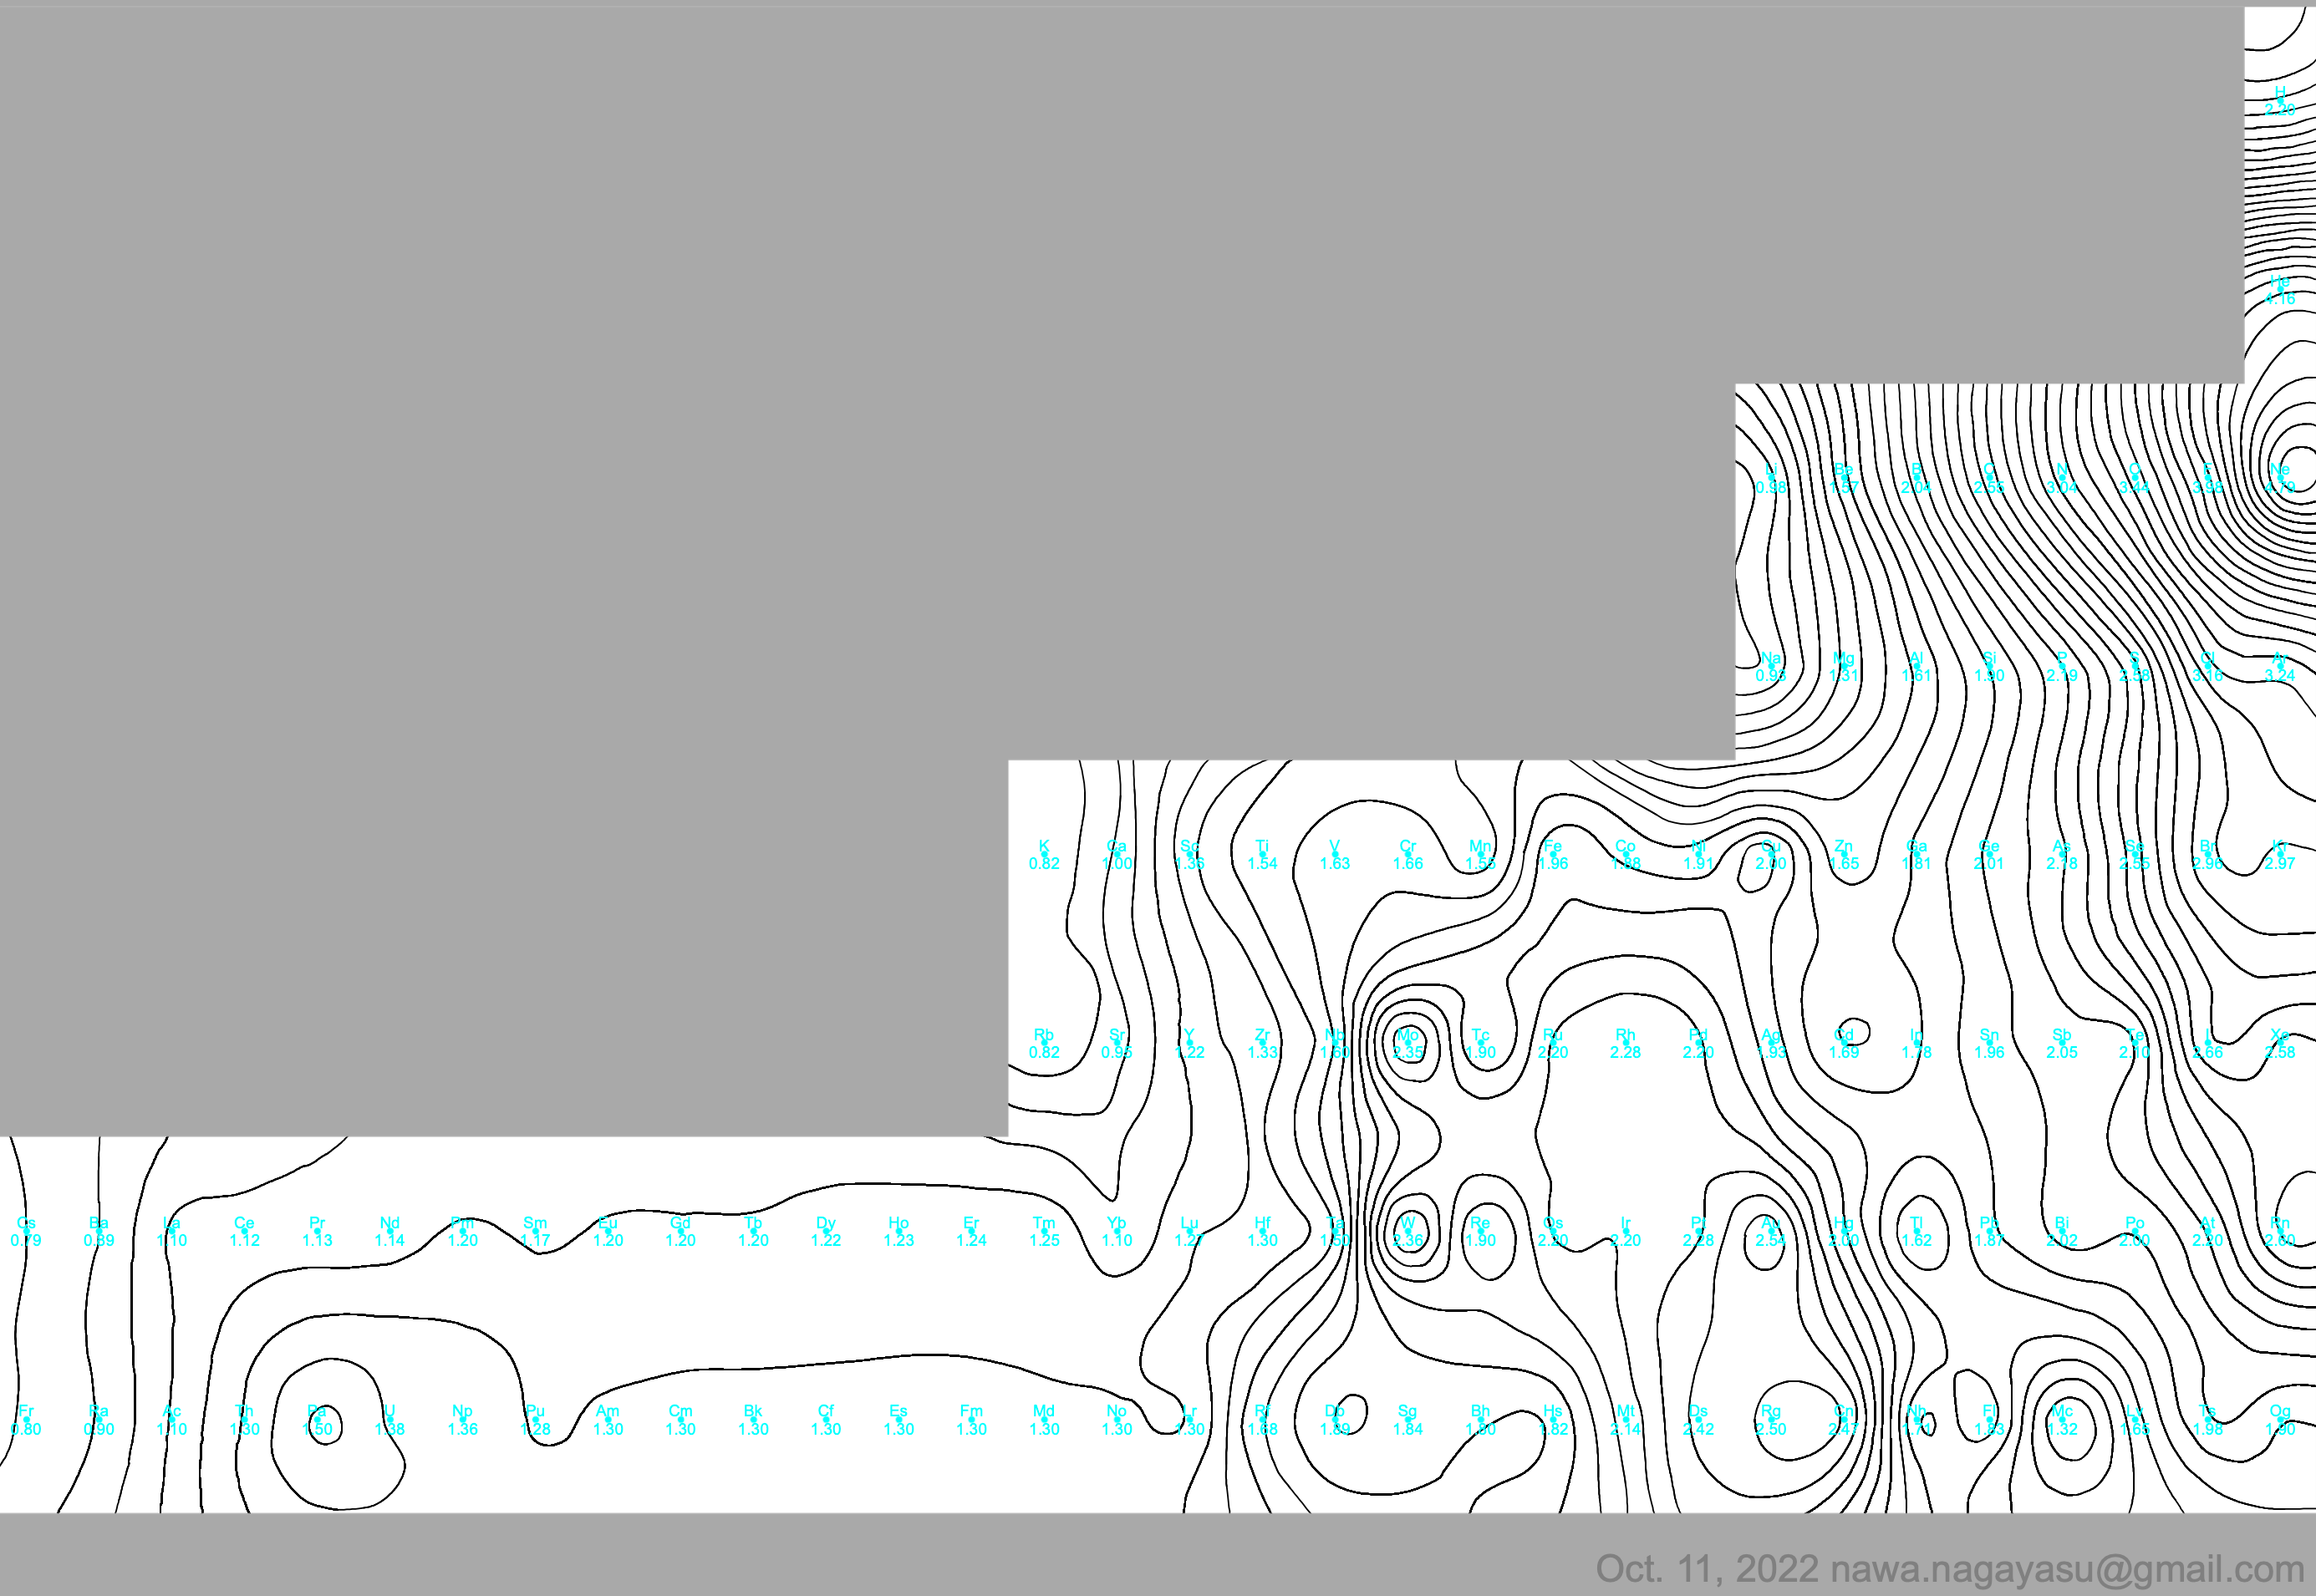
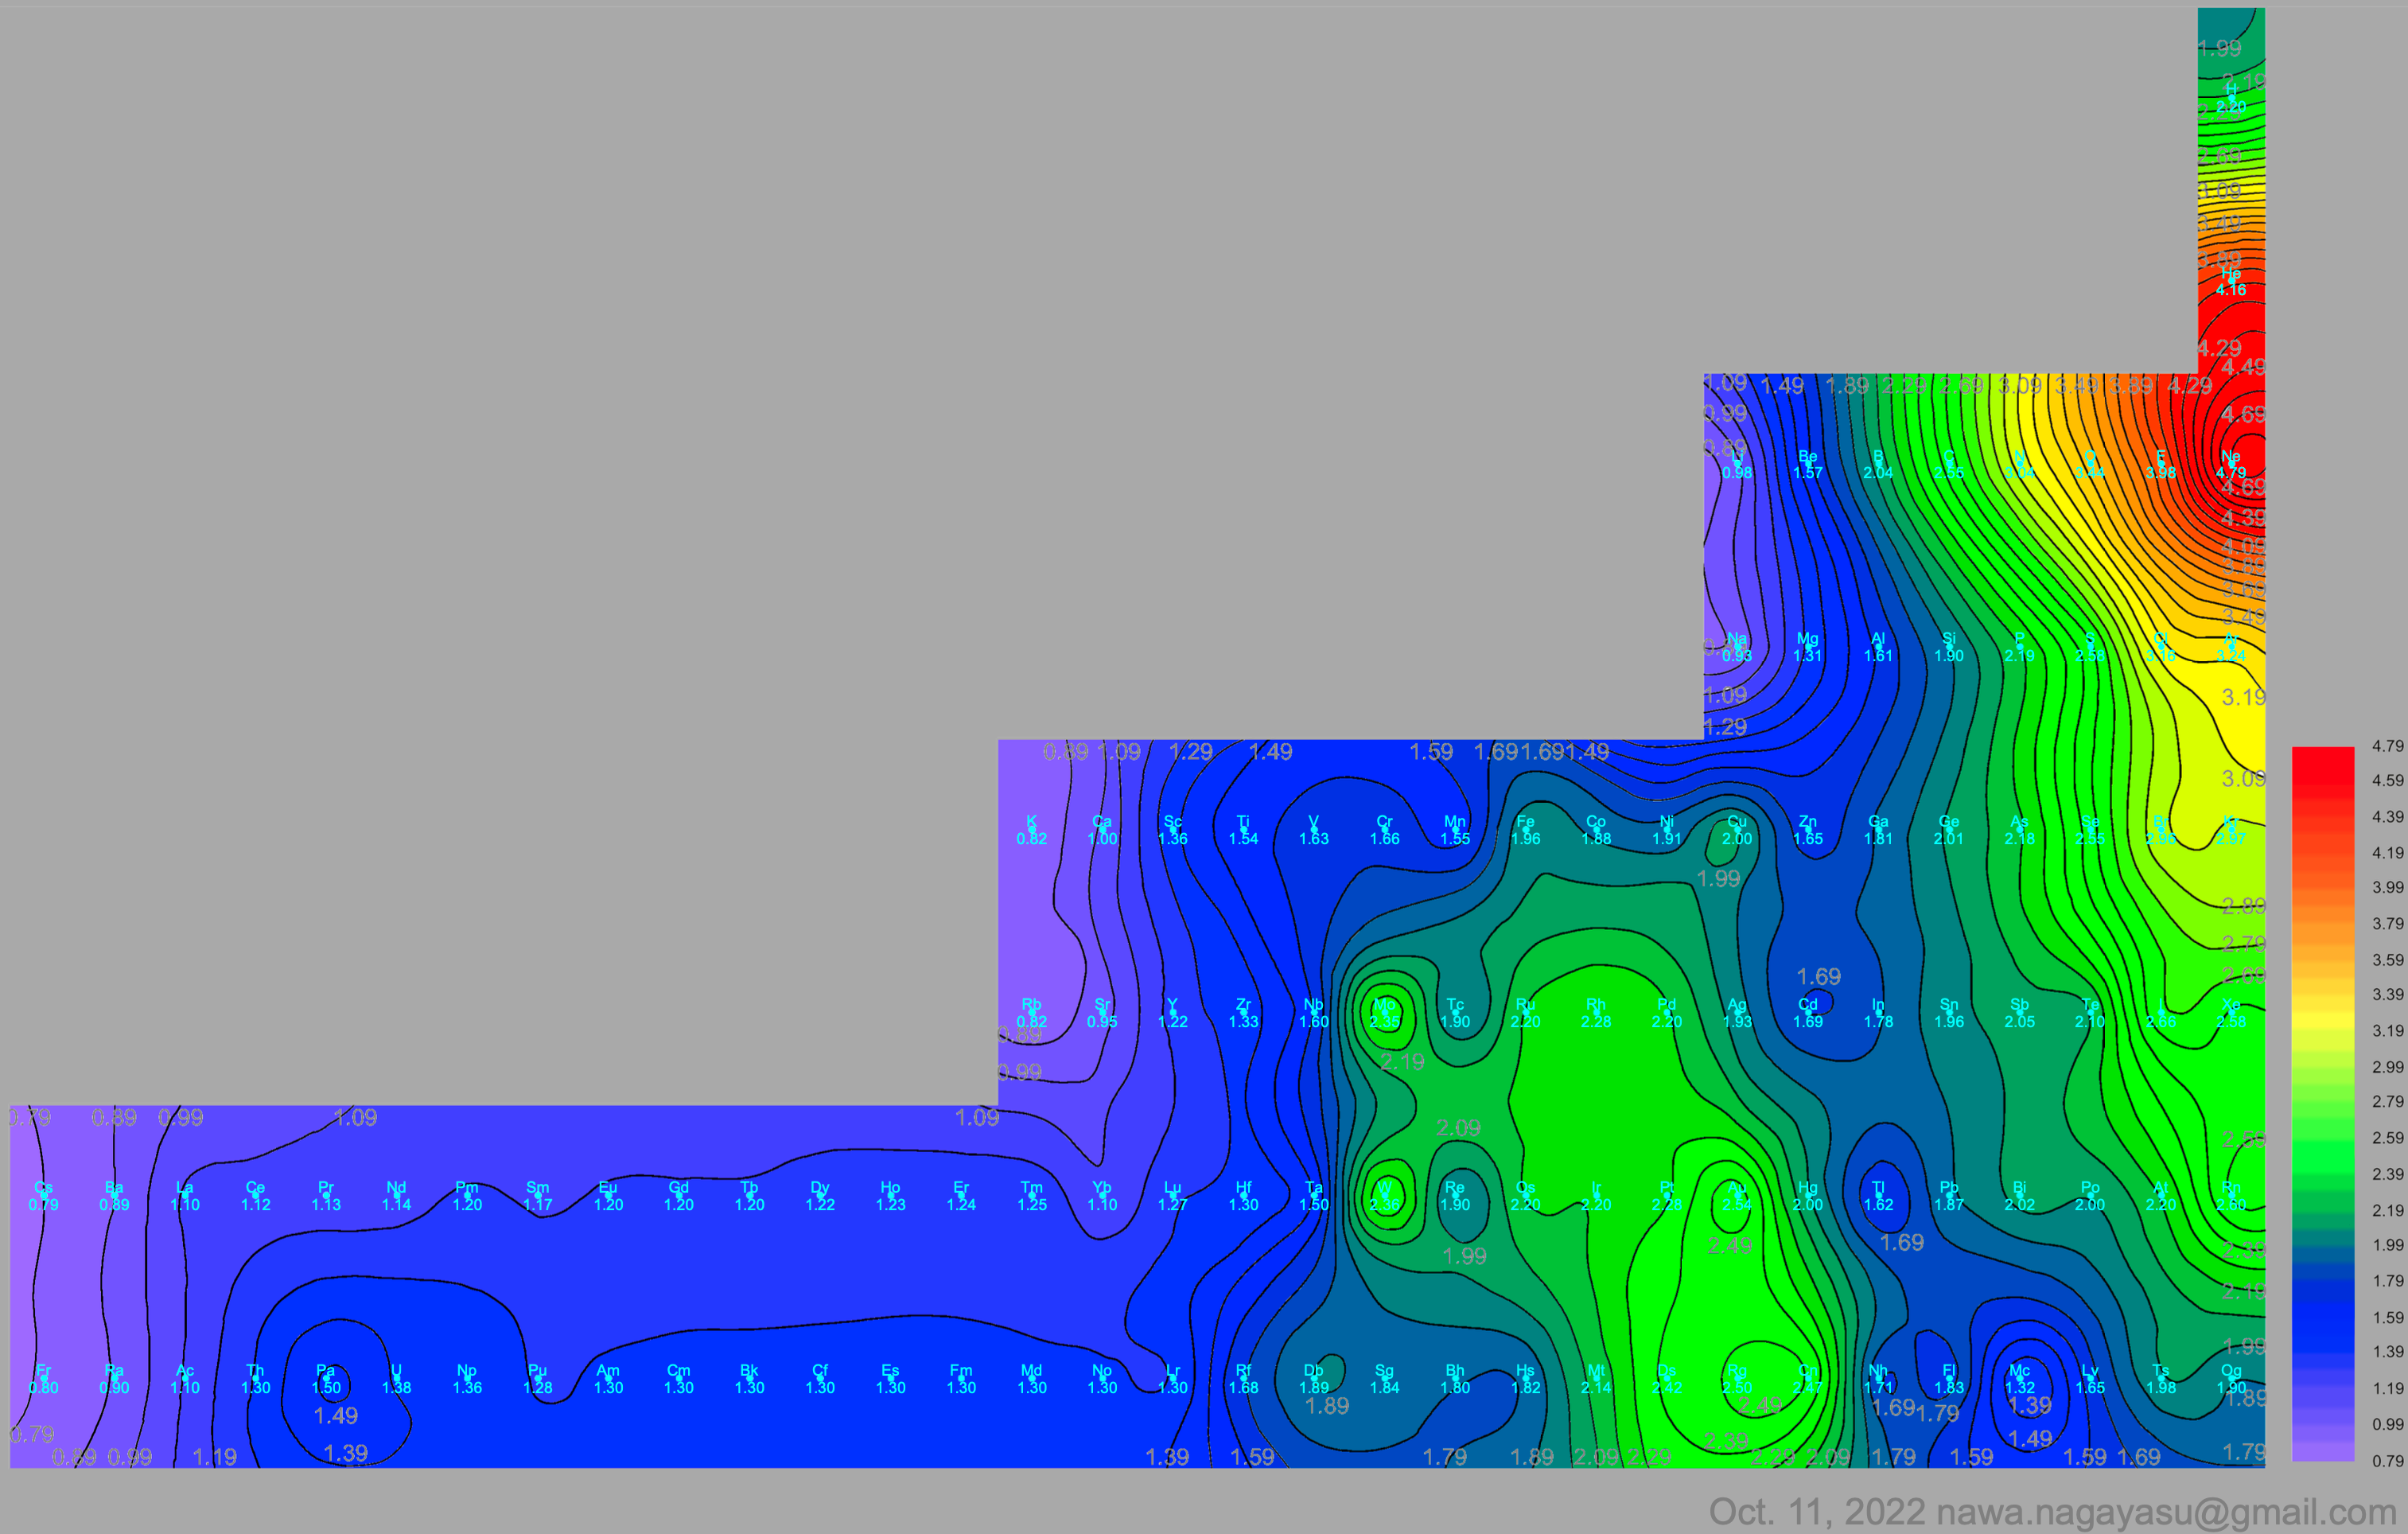
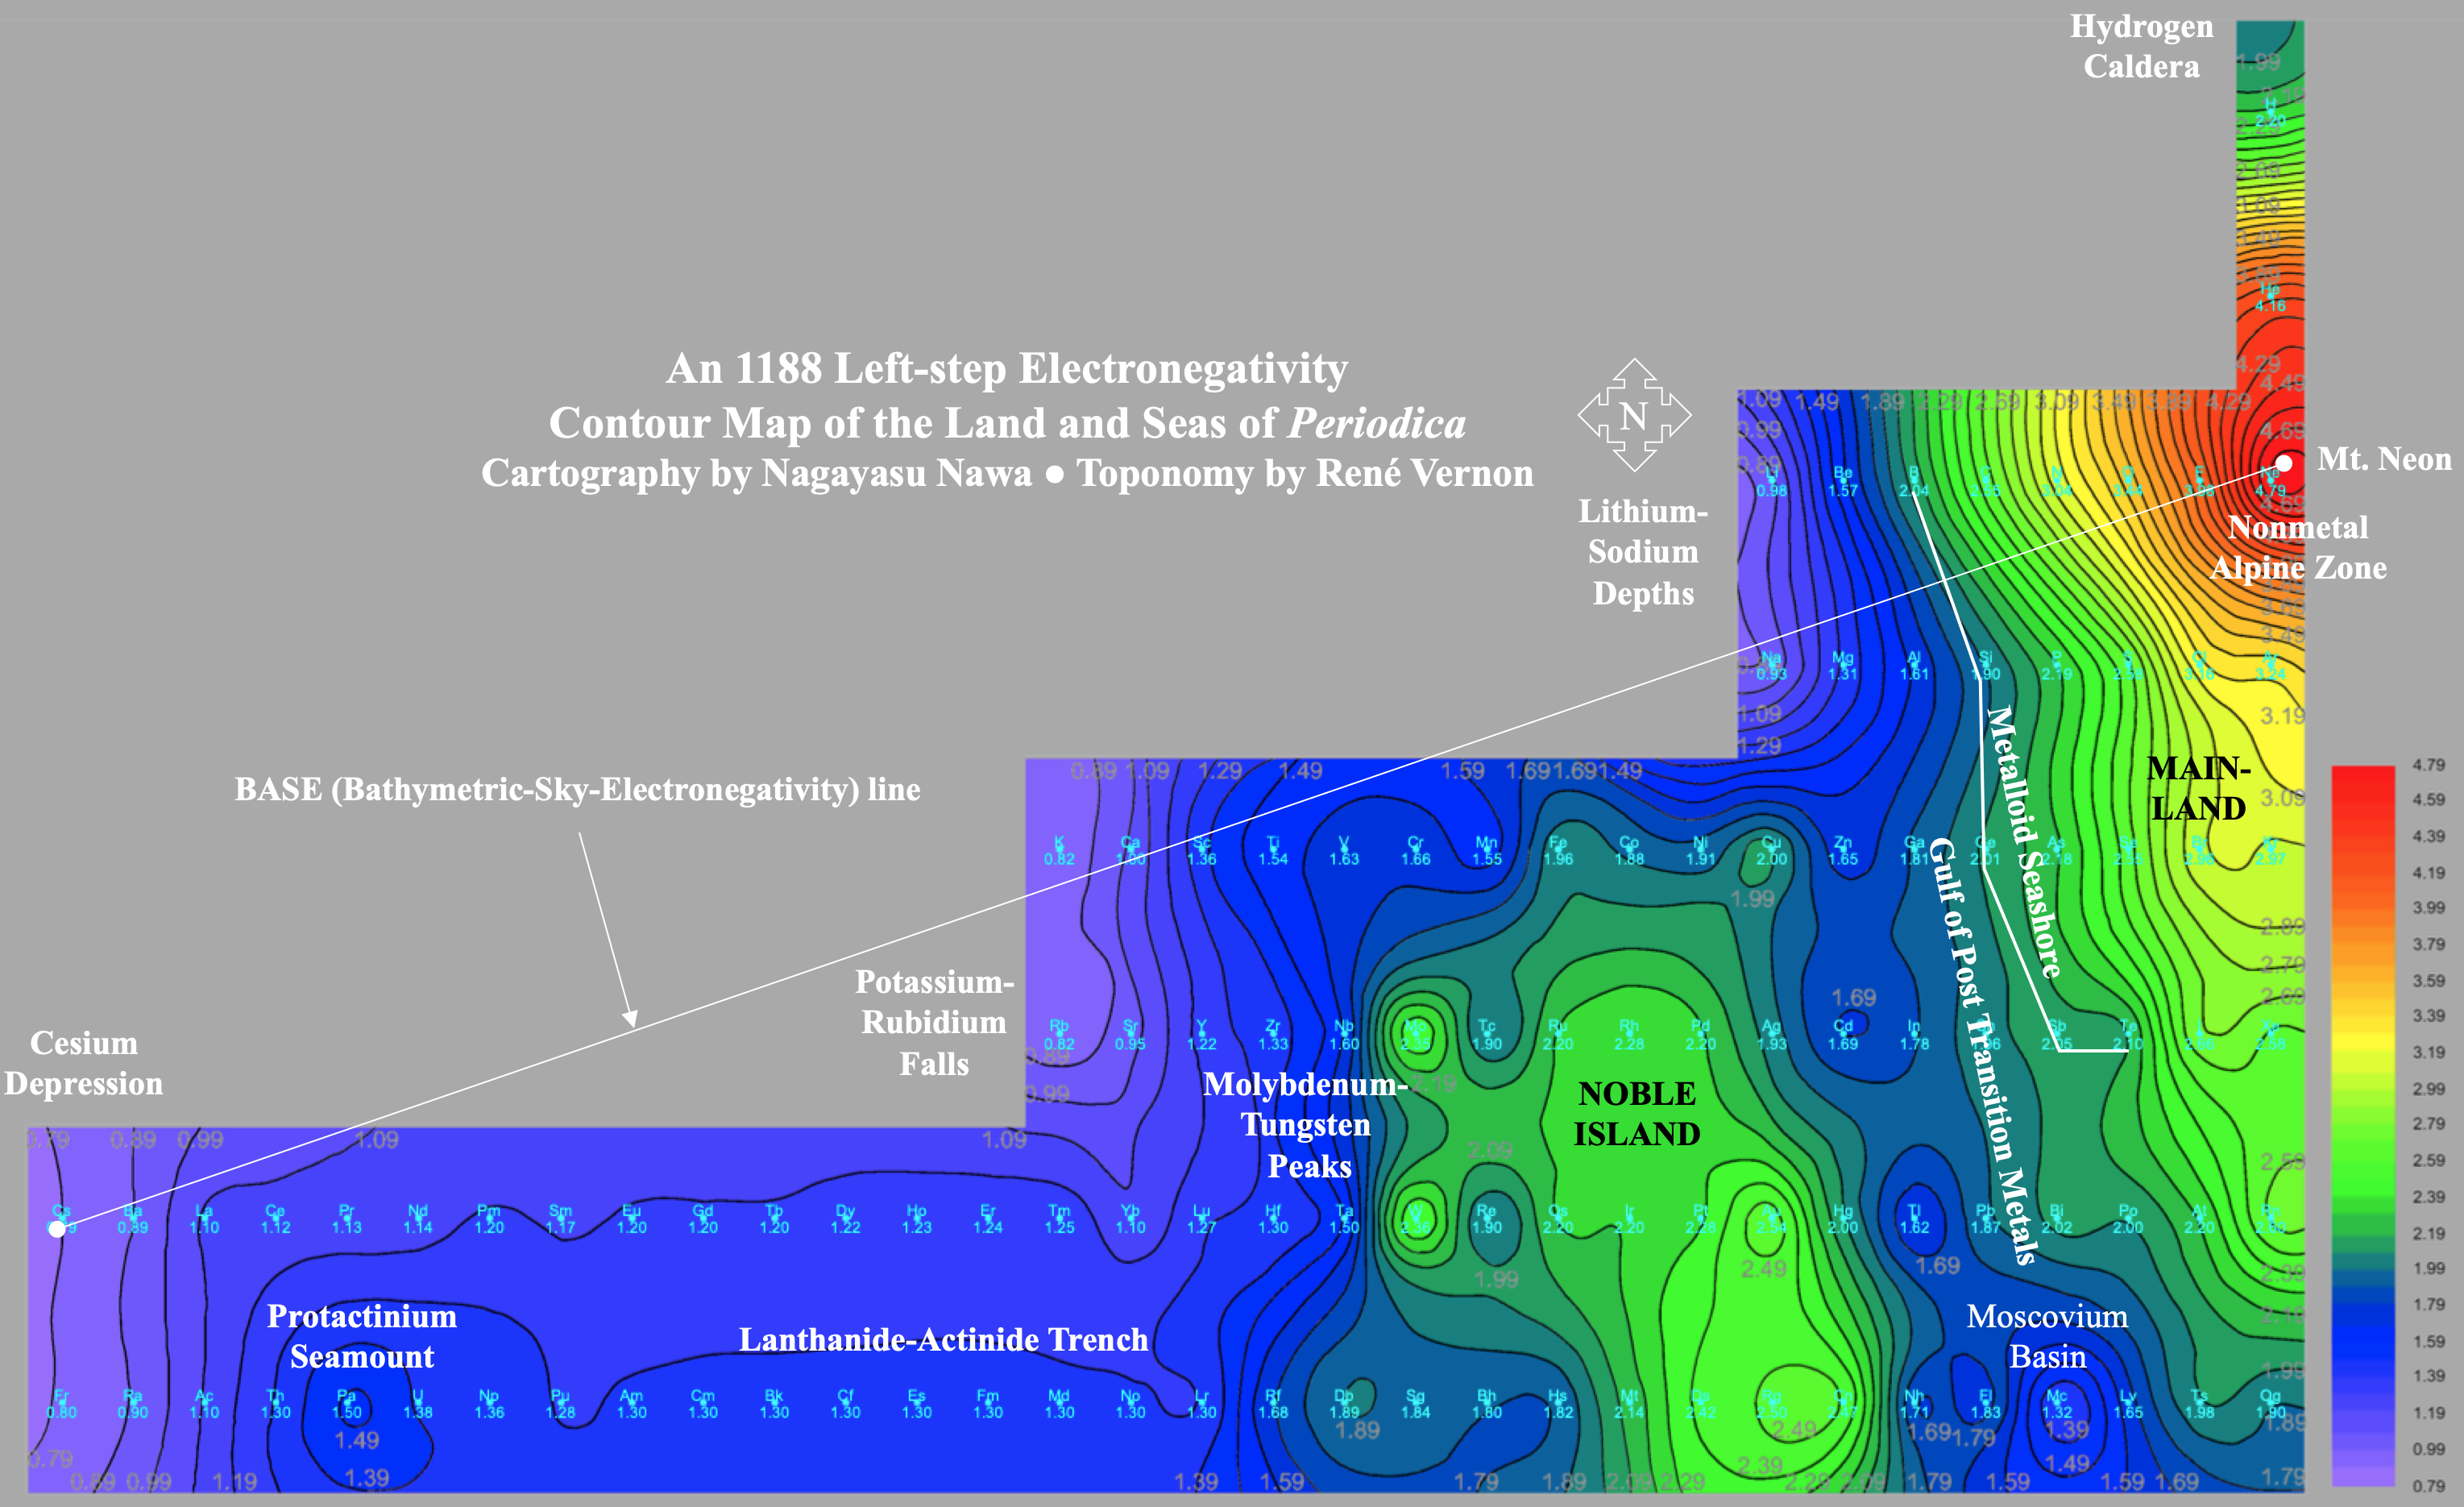
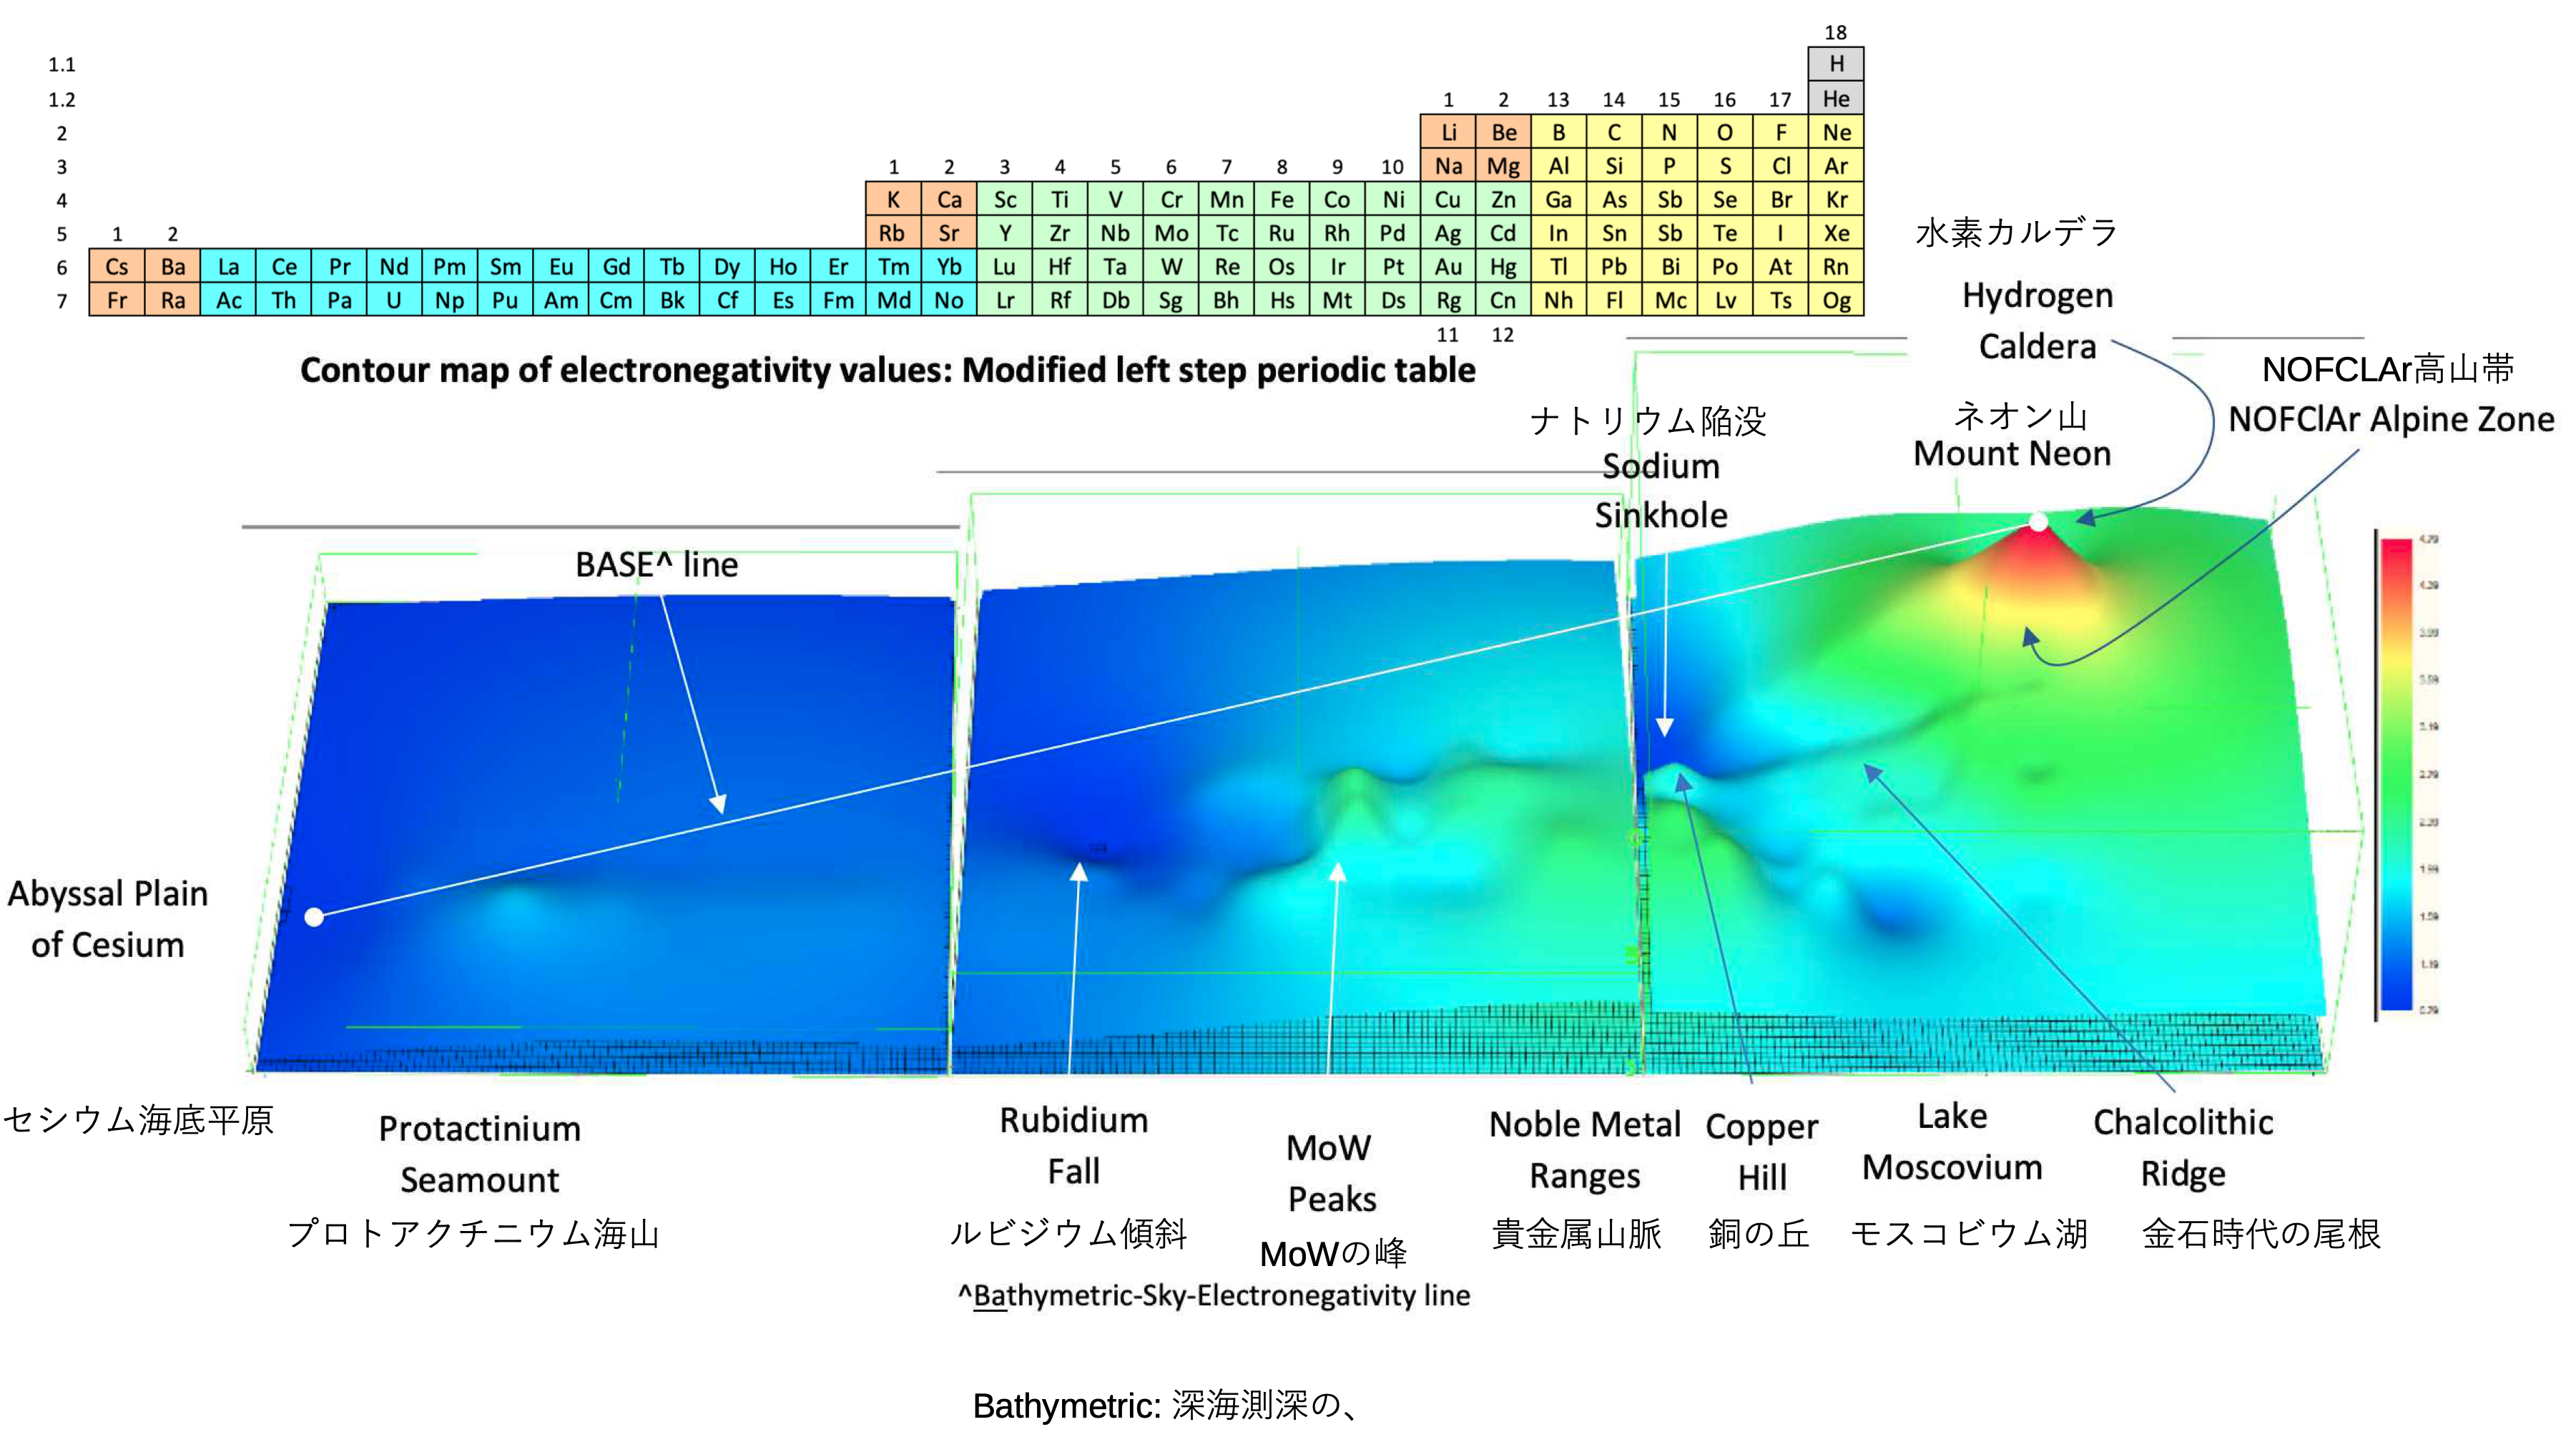
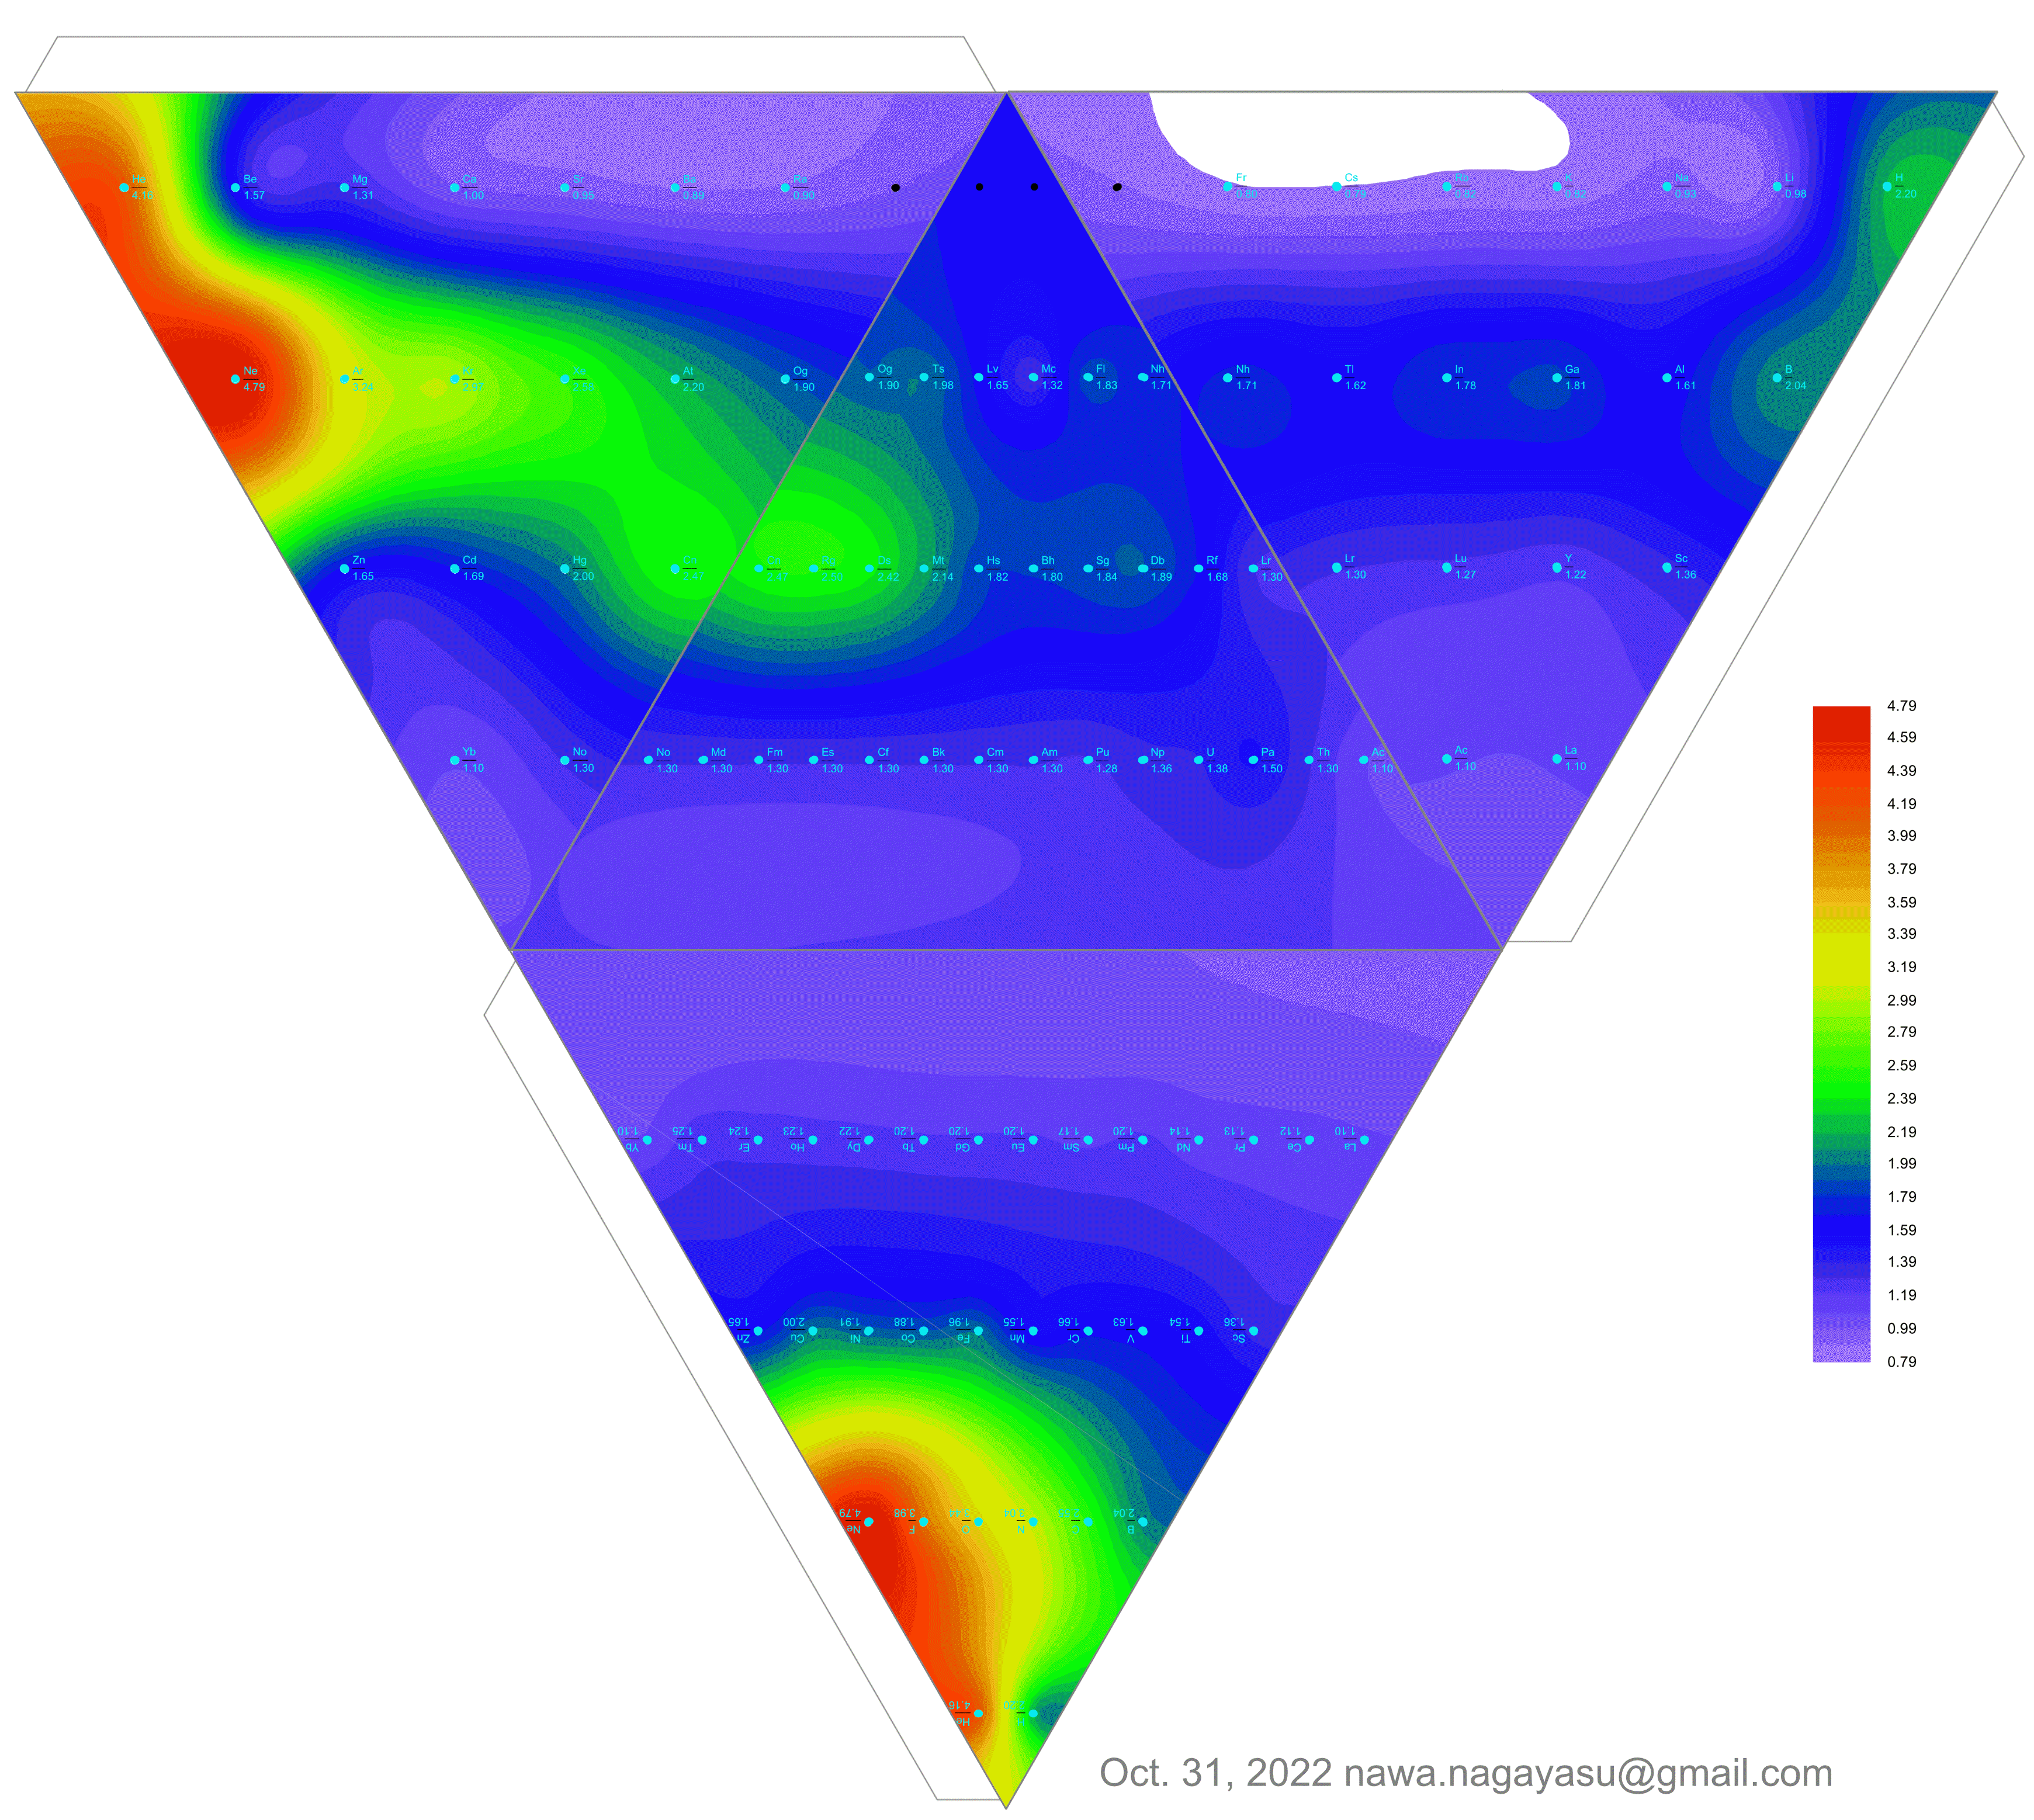
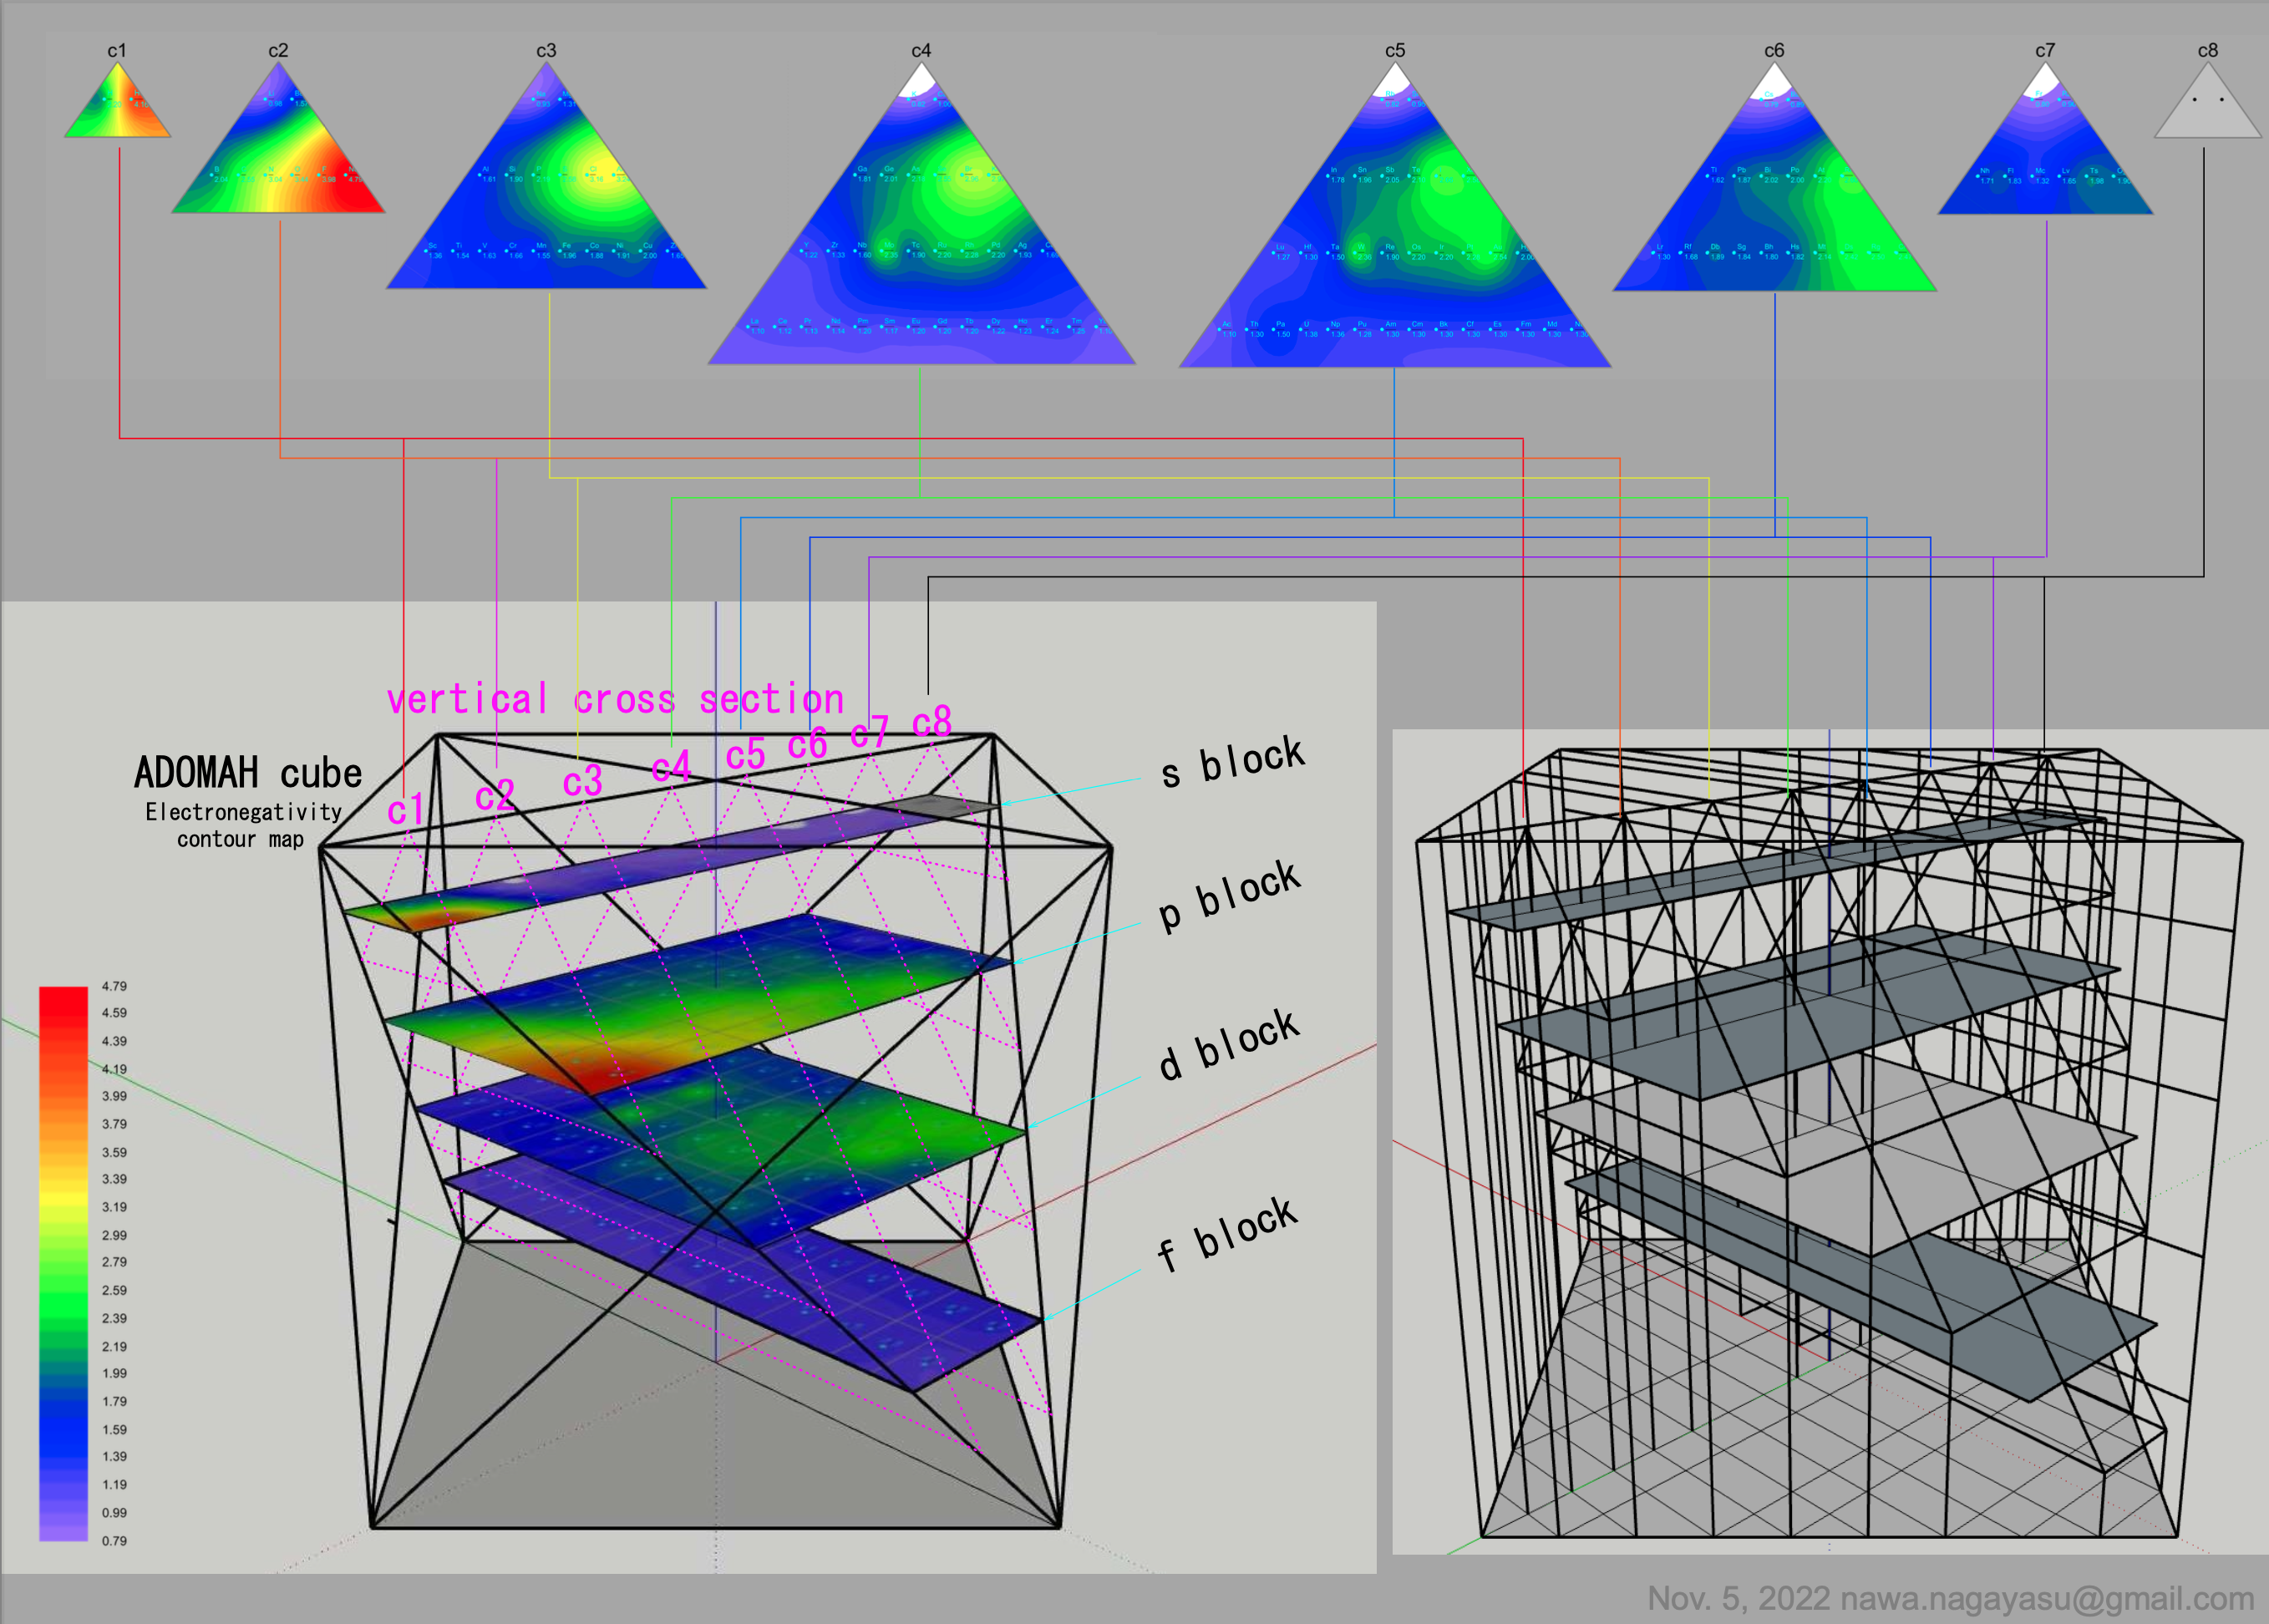
2022
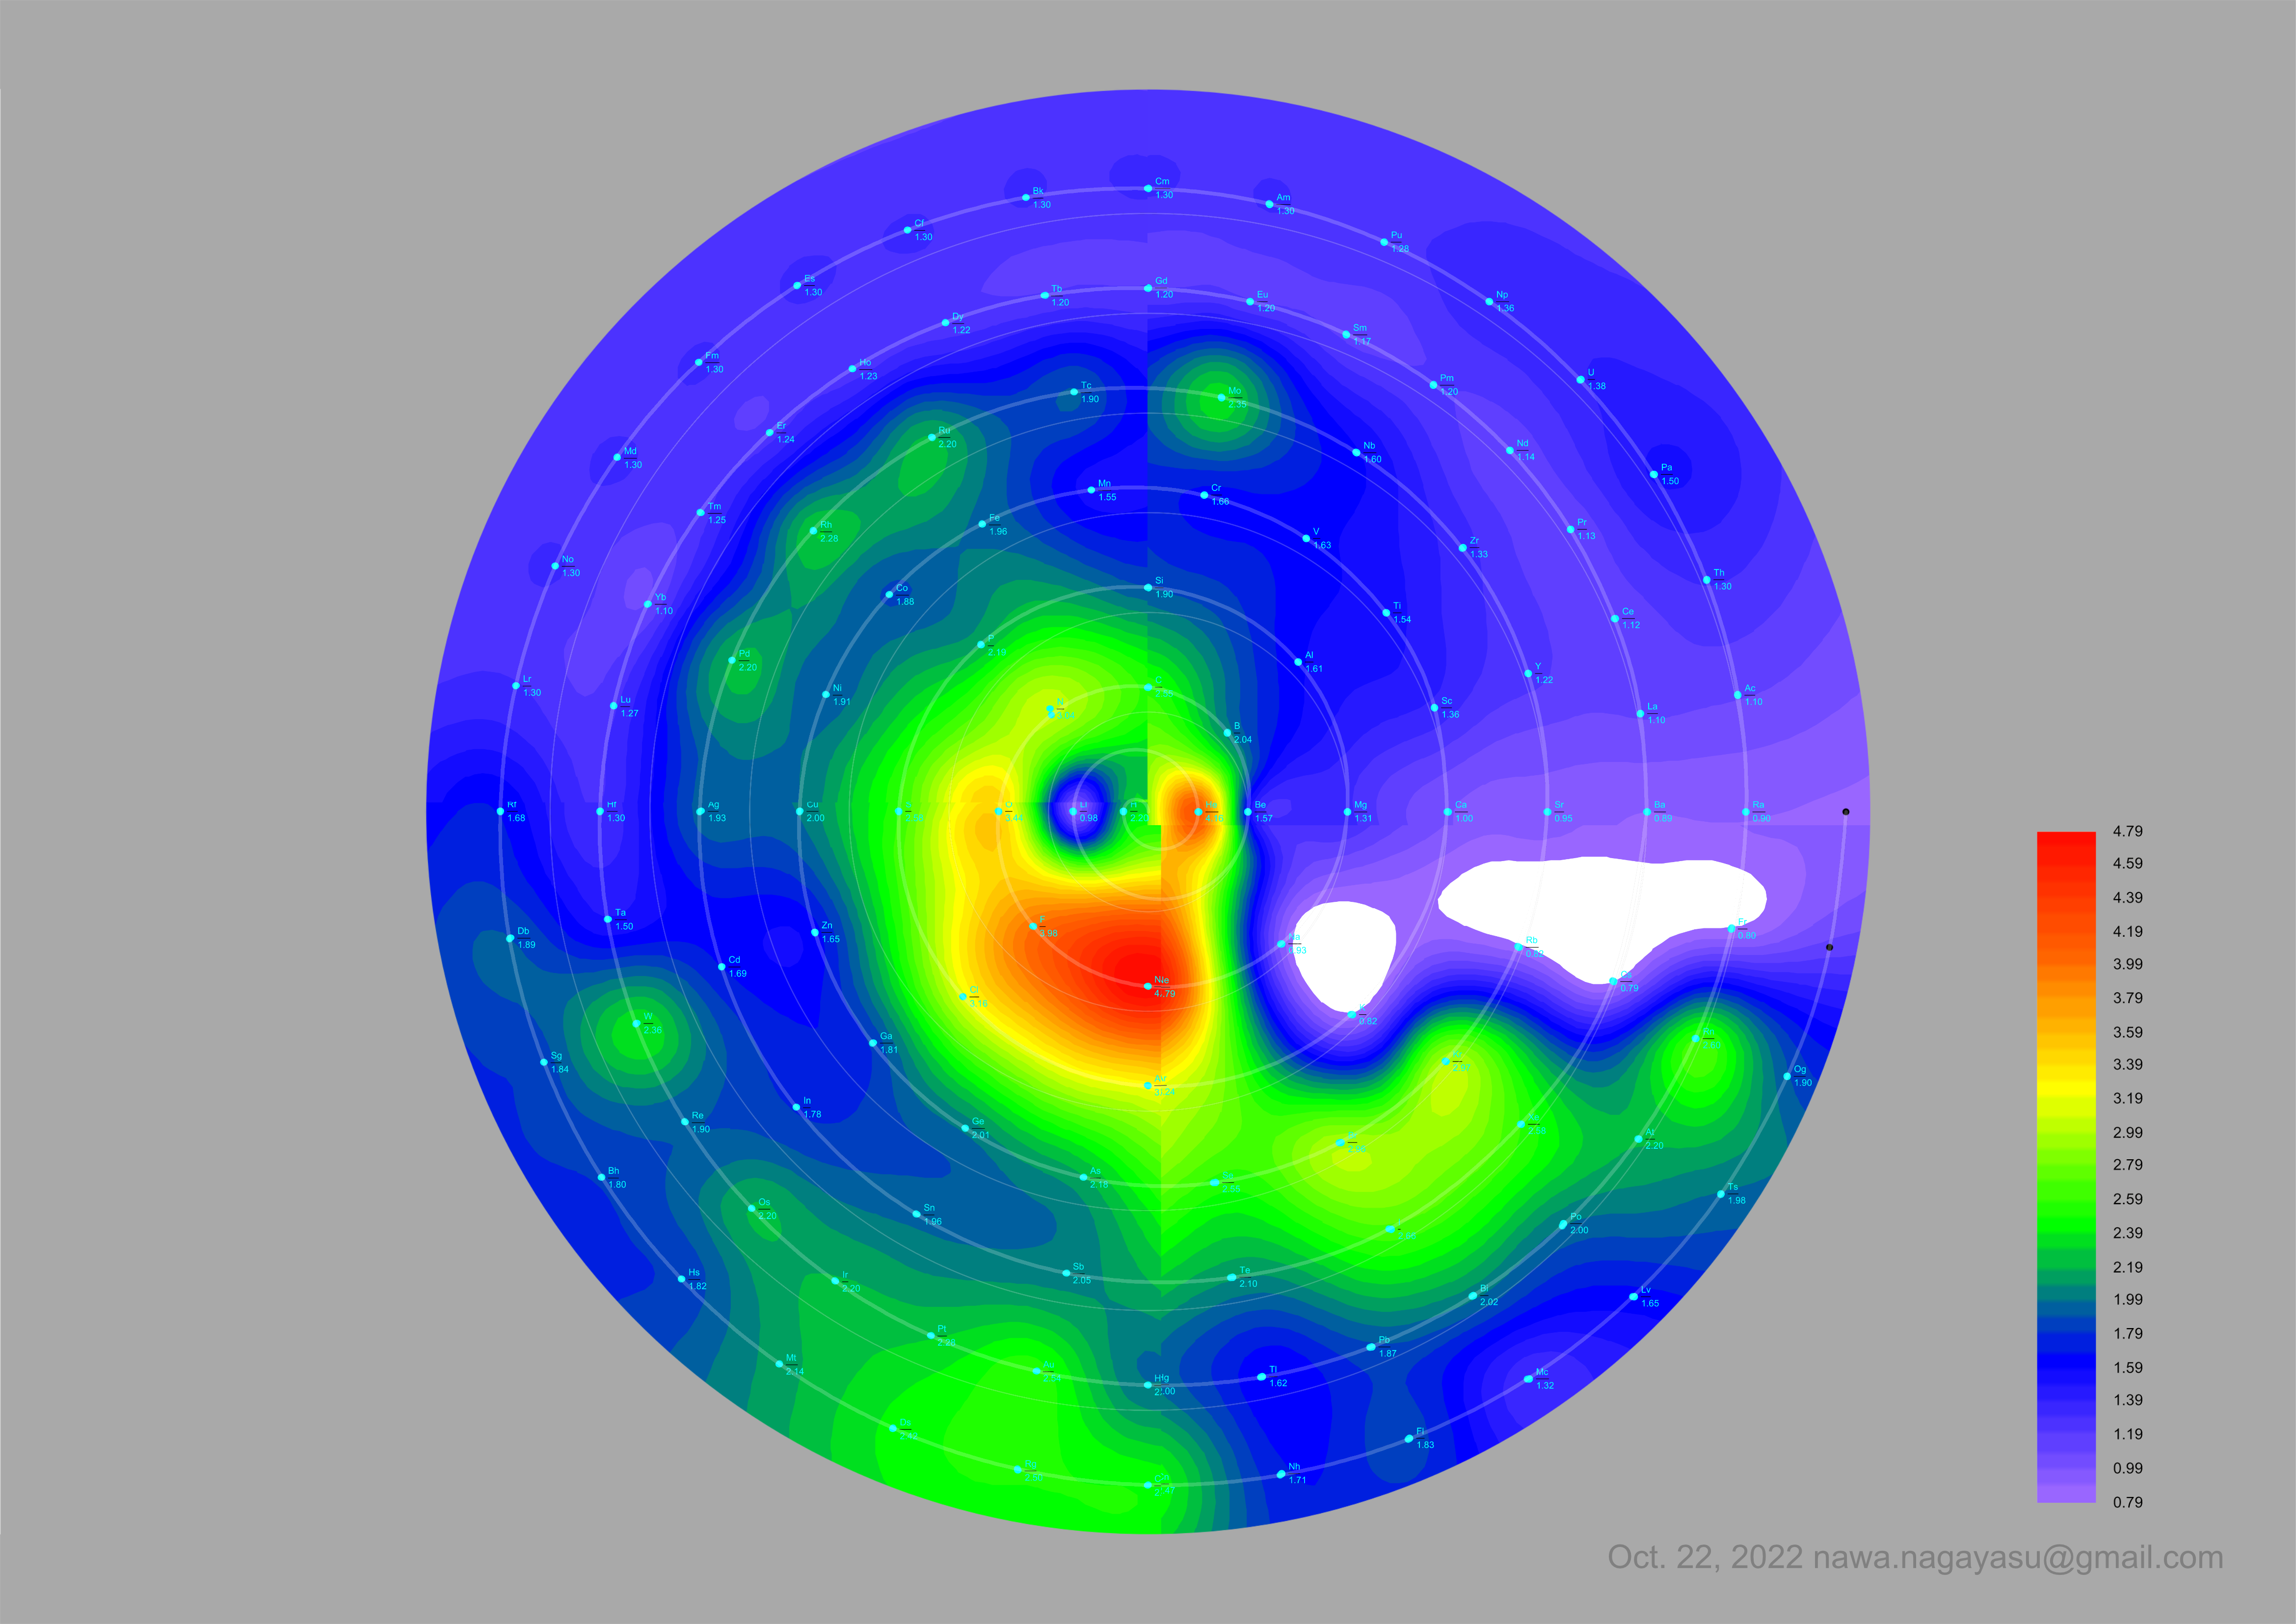
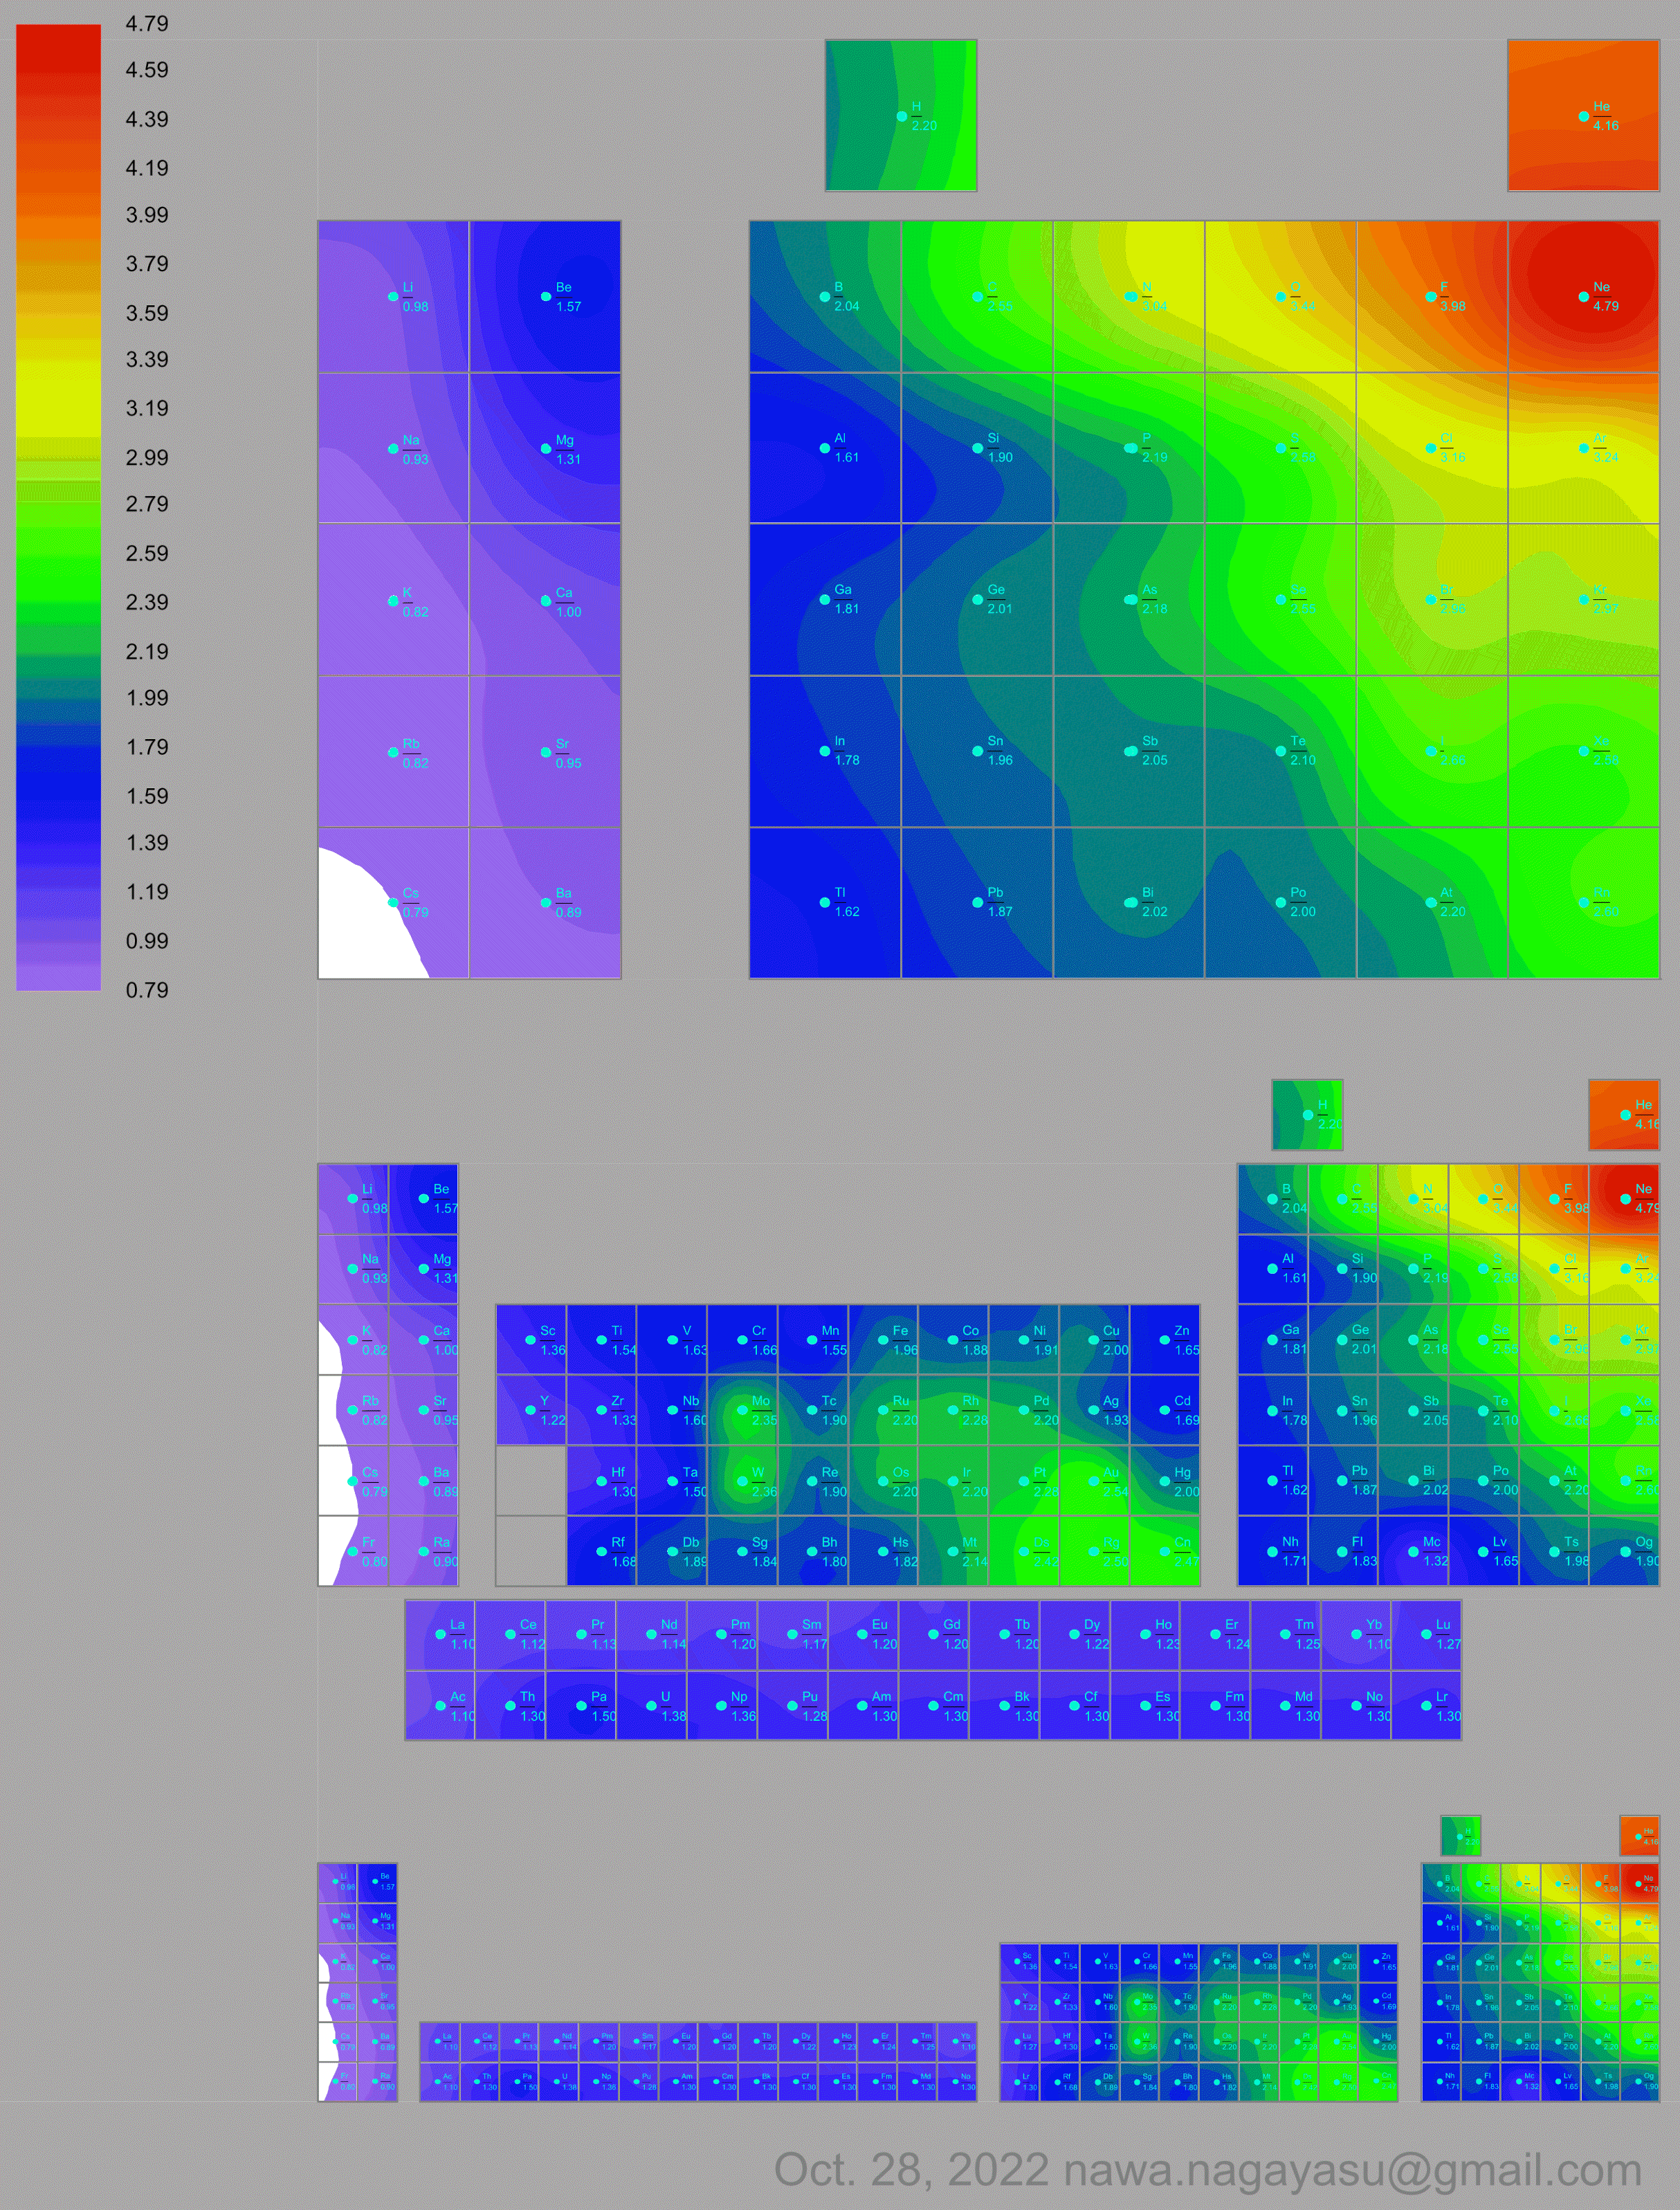
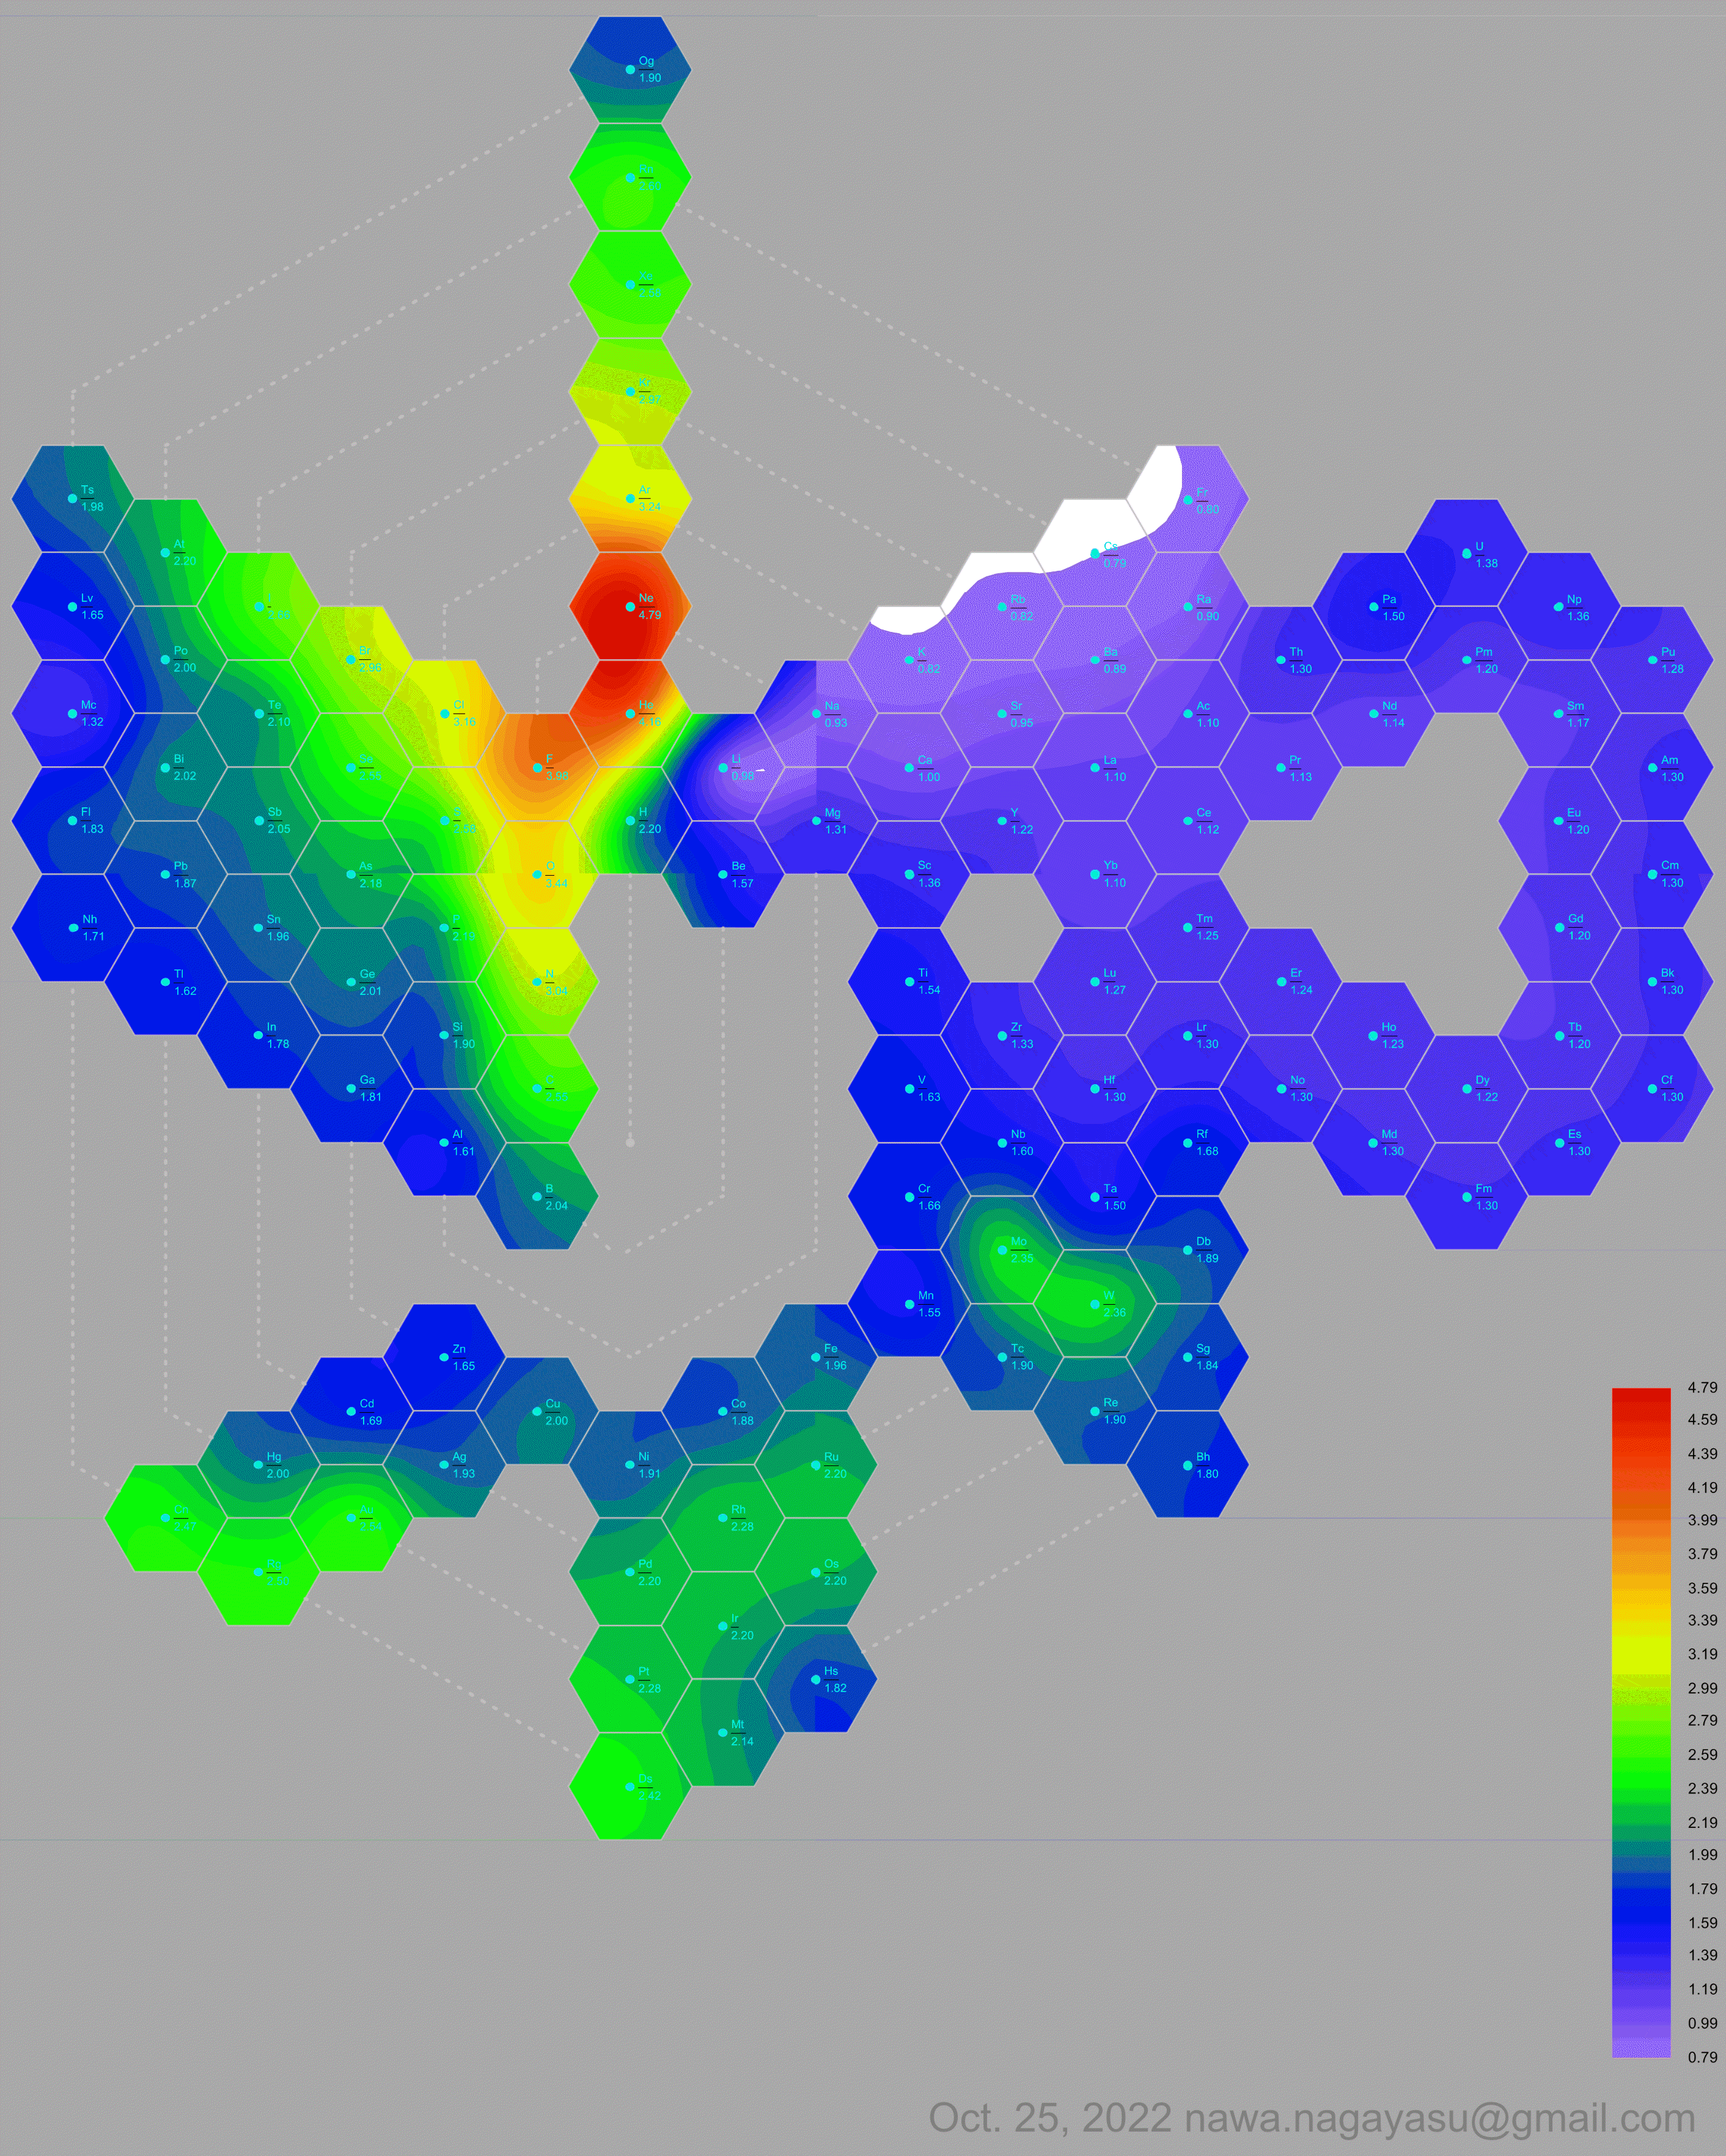
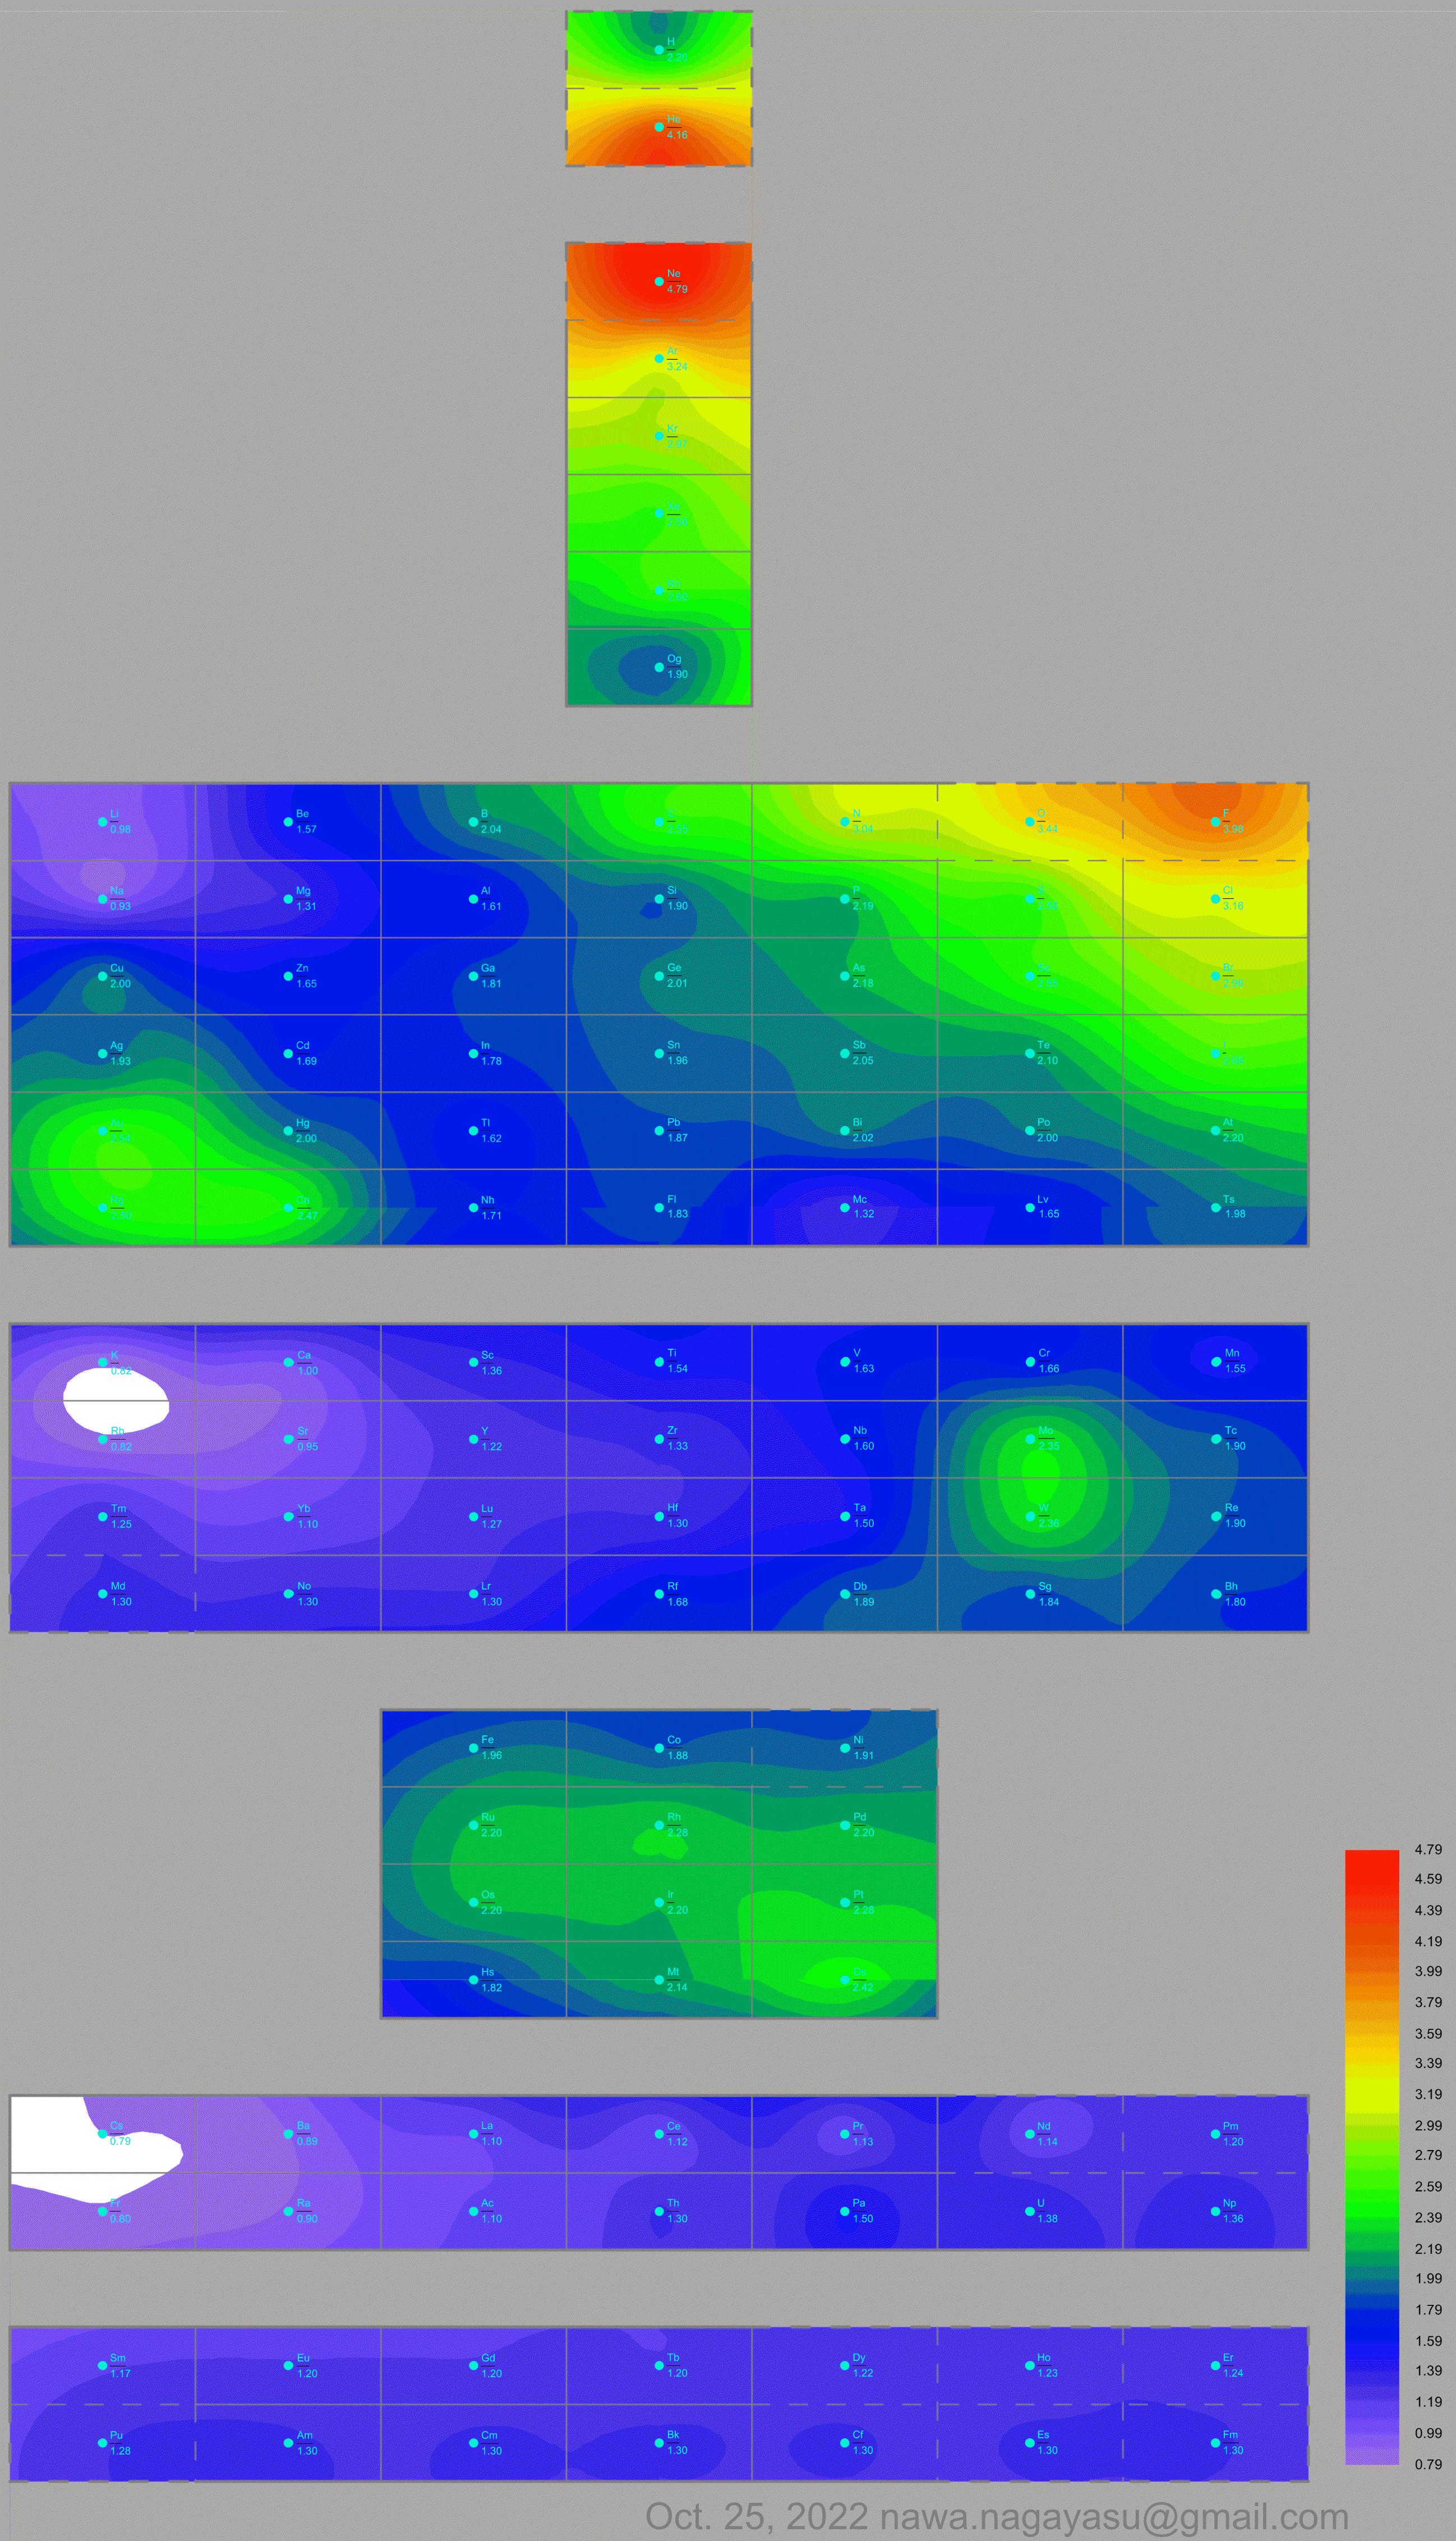
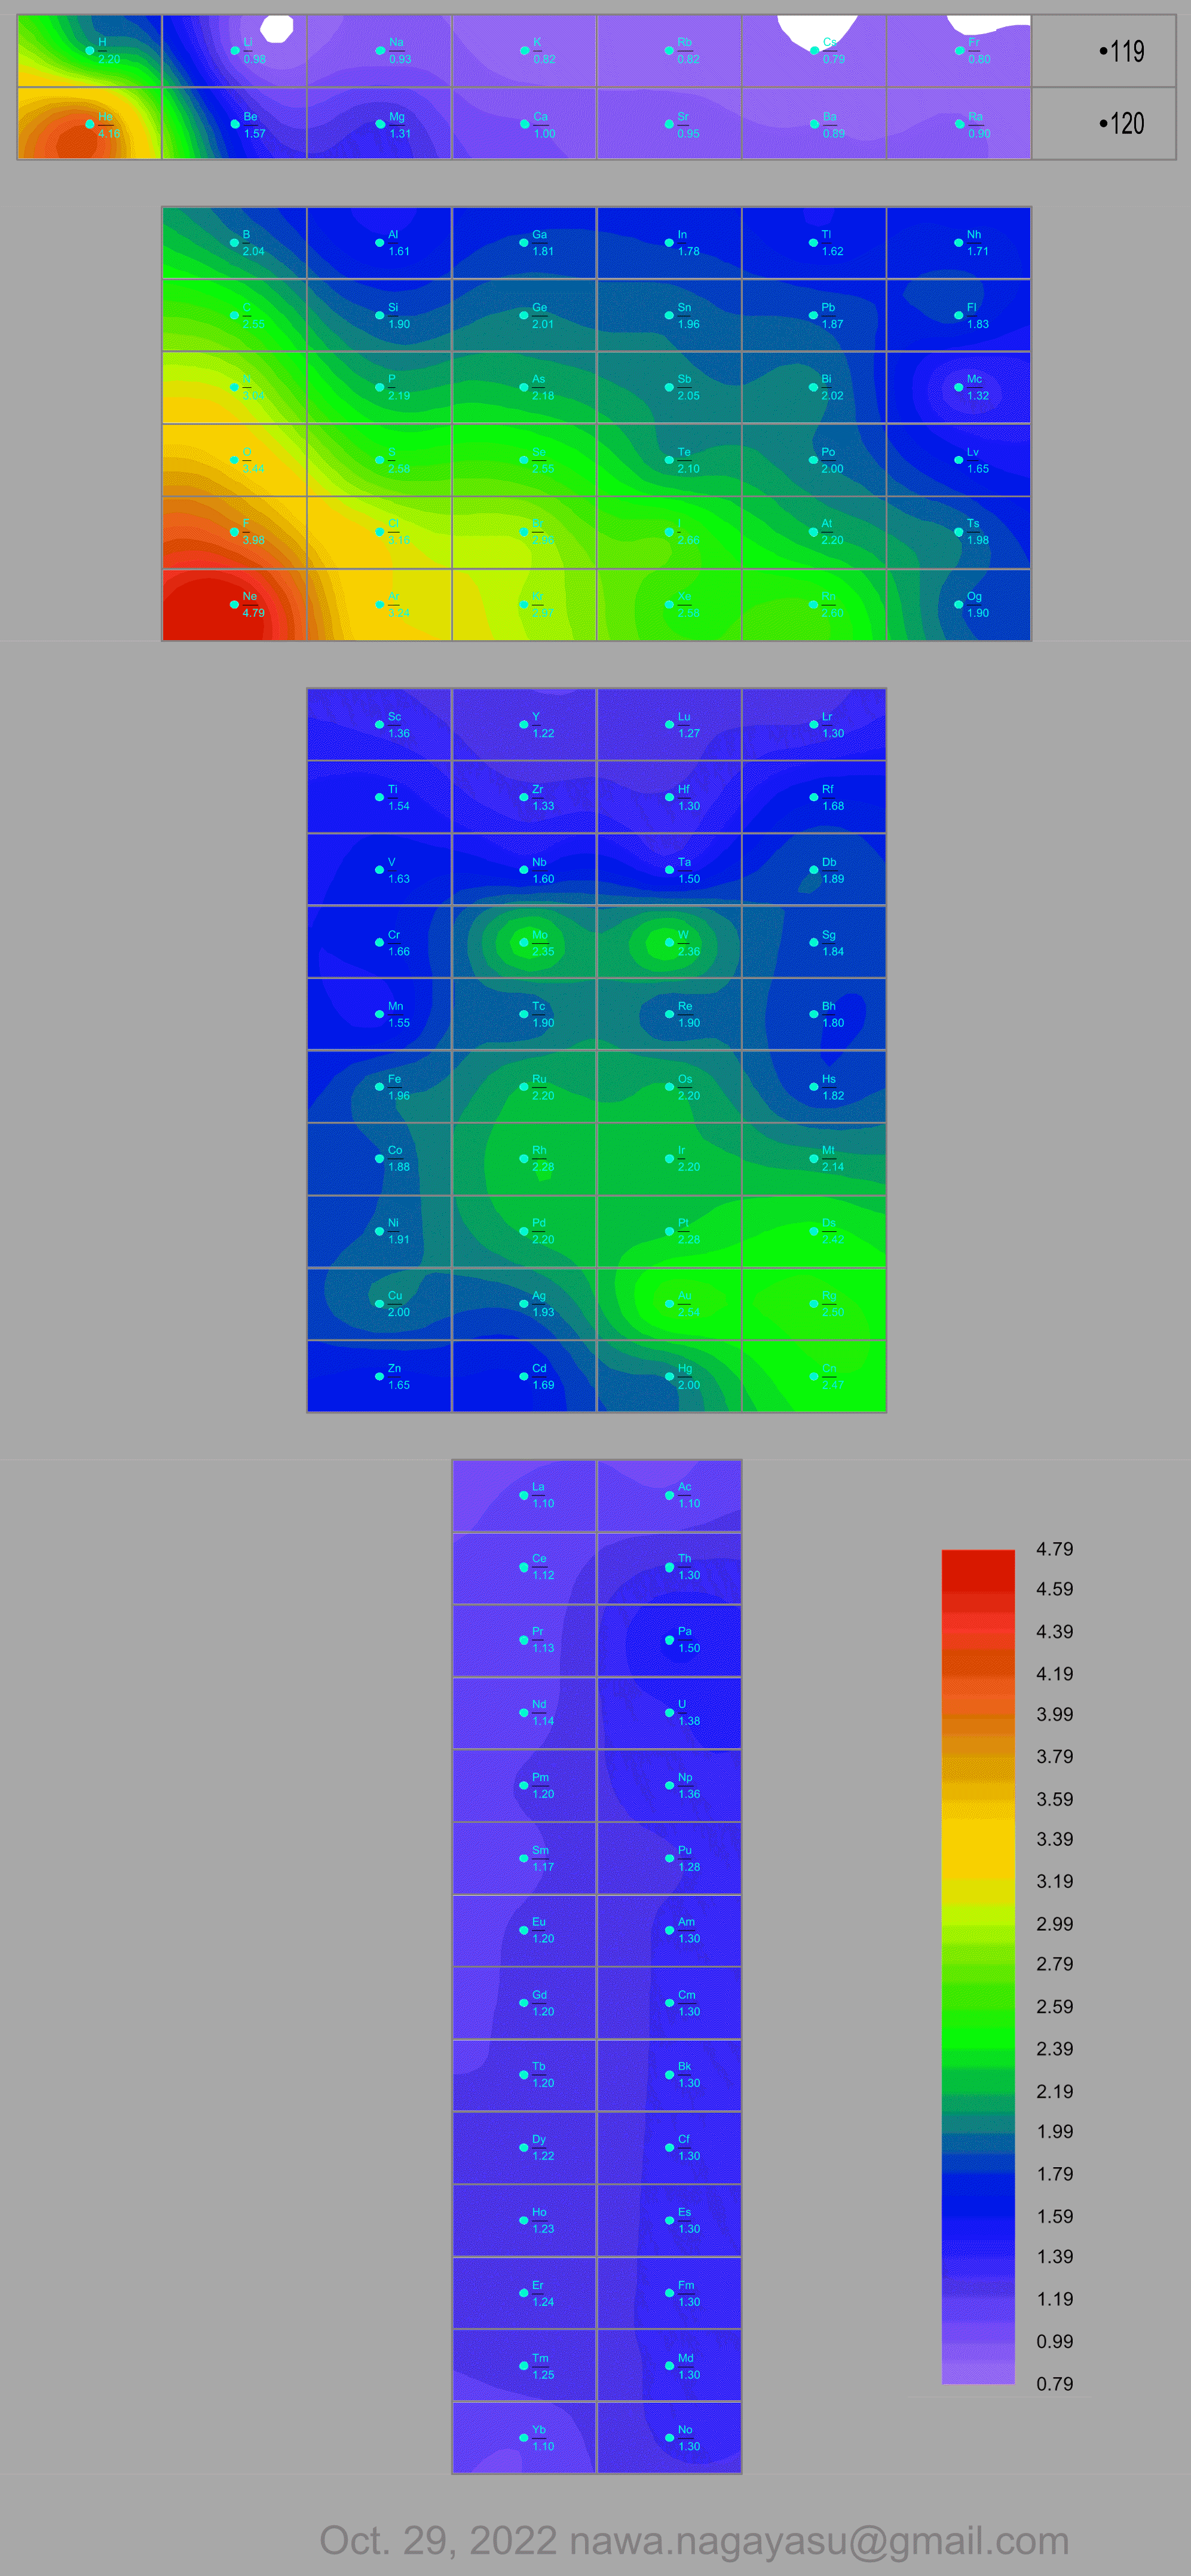
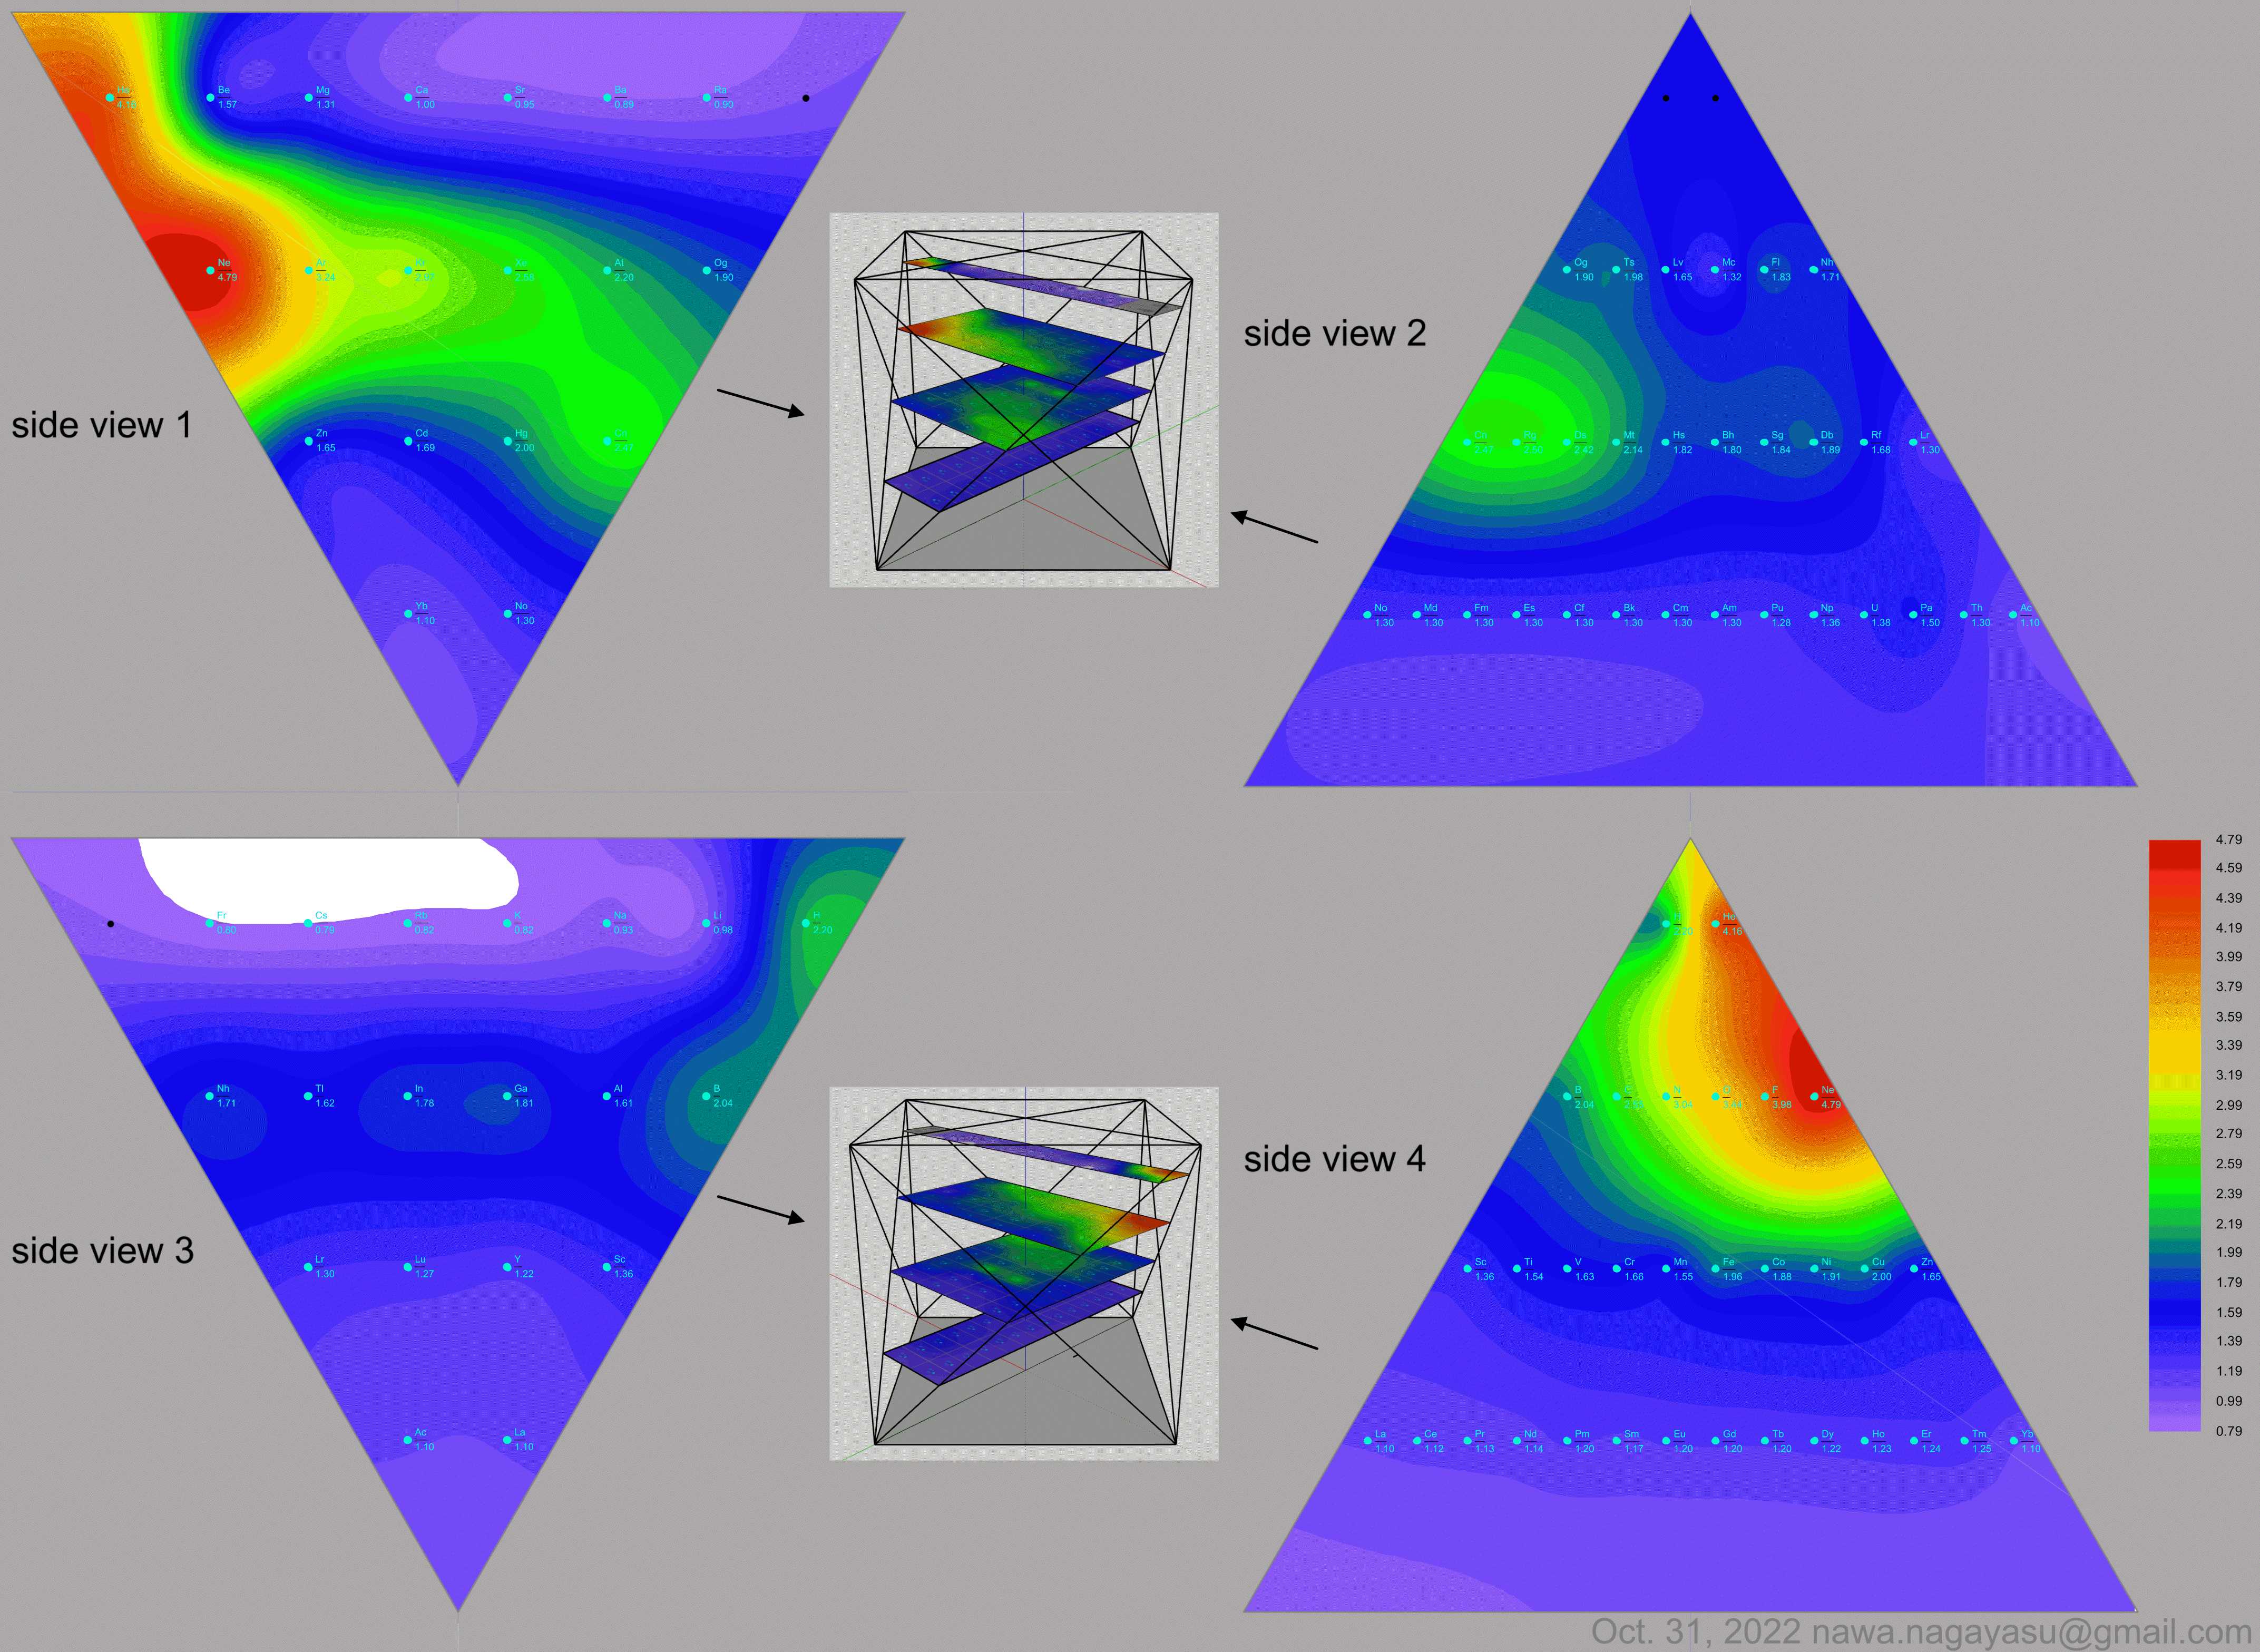
Electronegativity Seamlessly Mapped Onto Various Formulations of The Periodic Table
A discussion on the Google Groups Periodic Table Discussion List, involving a René Vernon, Nawa Nagayasu & Julio Samanez (all contributors this database) lead to the development of the representations below, showing electronegativity seamlessly mapped onto a modified Left-Step Periodic Table:
Nawa Nagayasu has mapped electronegativity to Mendeleeve's formulation:
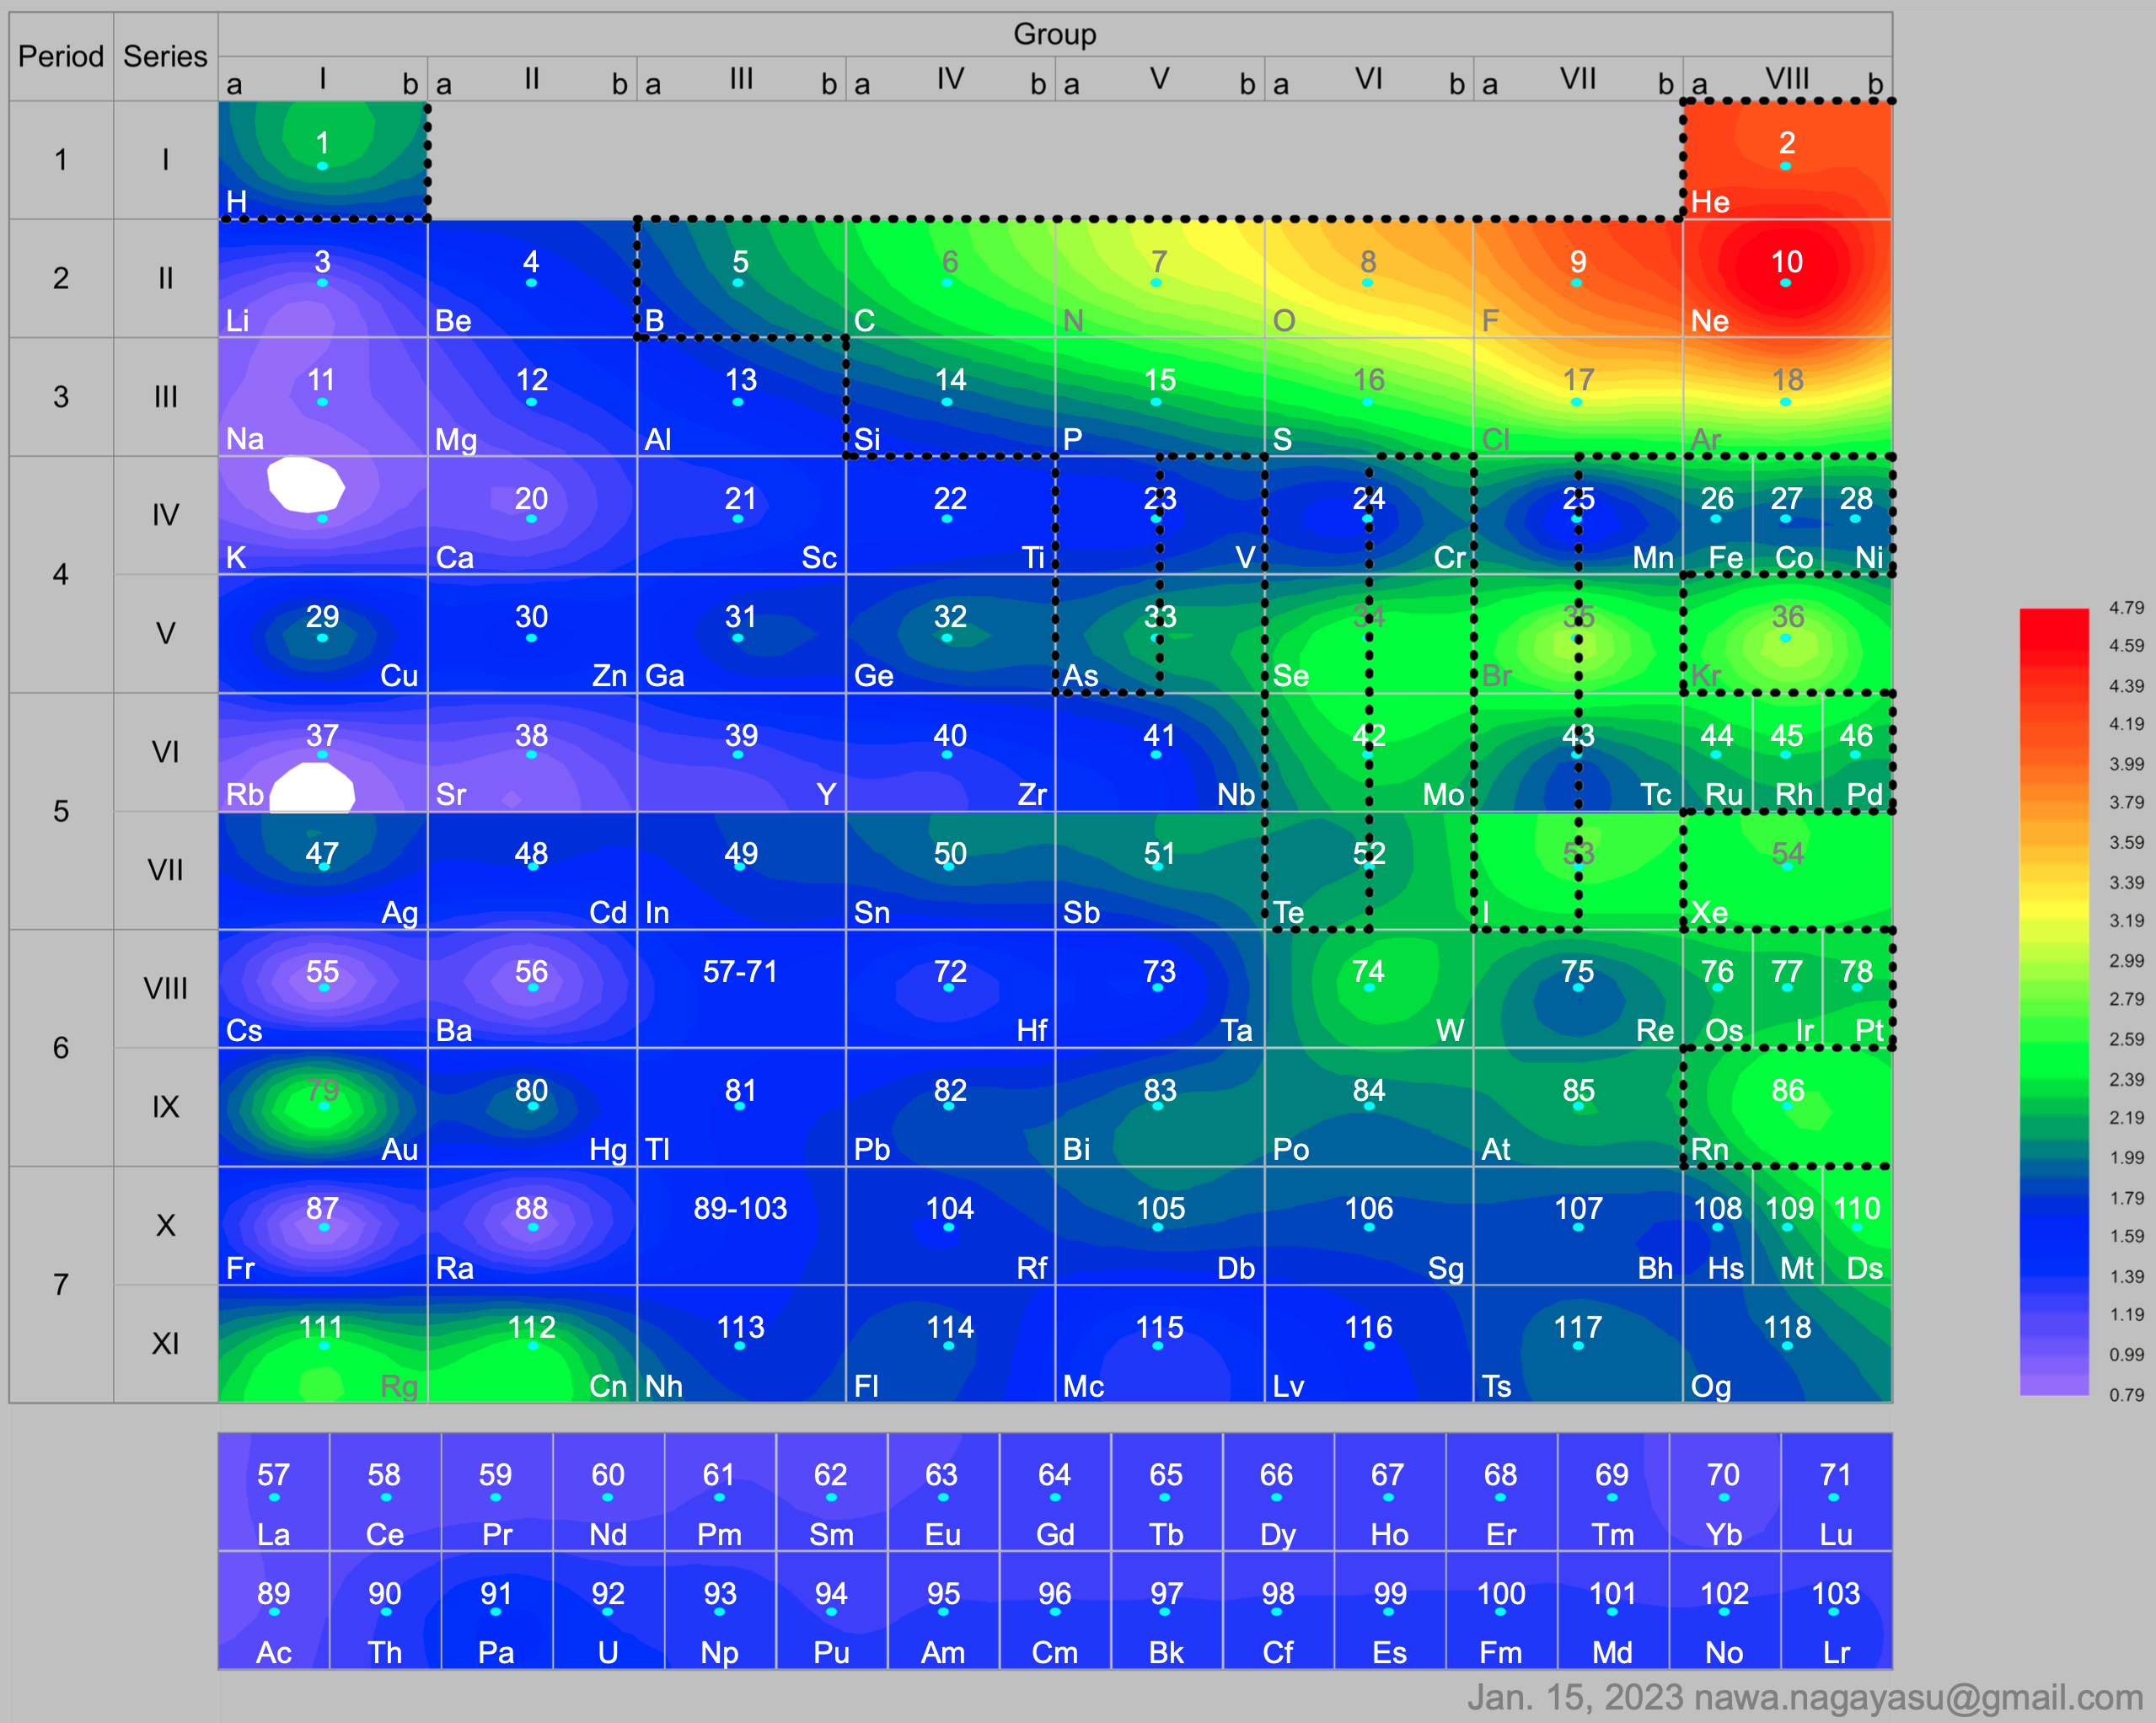
Nawa Nagayasu has mapped electronegativity onto other formulations, Julio's Binode Spiral:
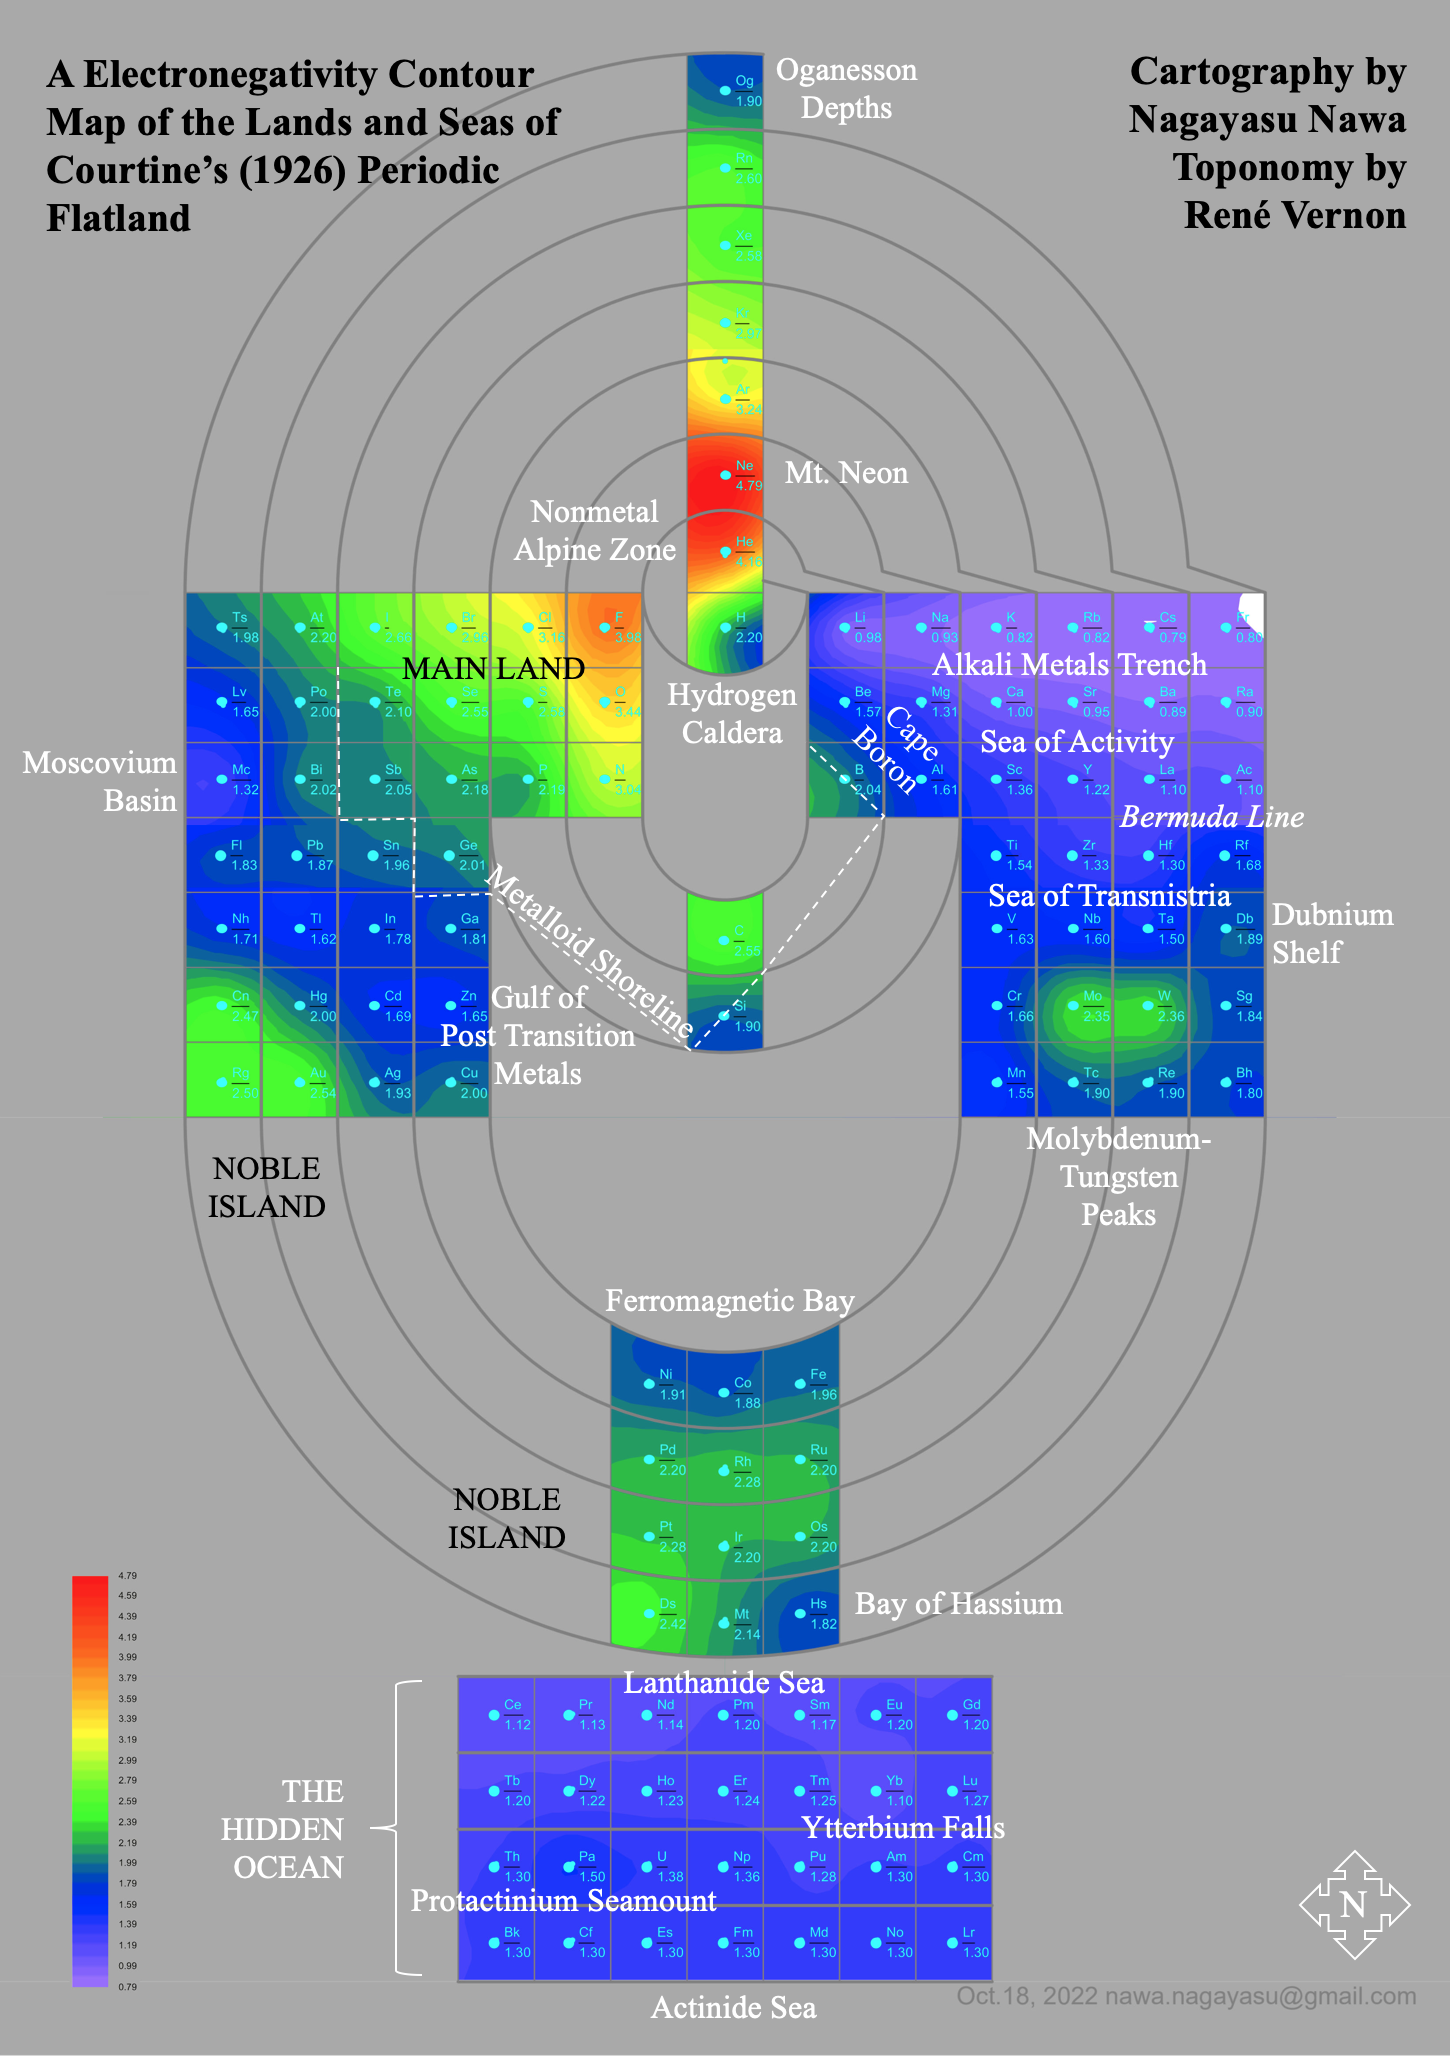
and the "conventional", short, medium and long forms of the periodic table with hydrogen above and between B & C which show the botom-right-to-top-left electronegativity trend:
René Vernon's 777 Periodic Wedding Cake:
Valery Tsimmerman's ADOMAH formulation:
Valery Tsimmerman's ADOMAH tetrahedron (in a glass cube) formulation:
2021
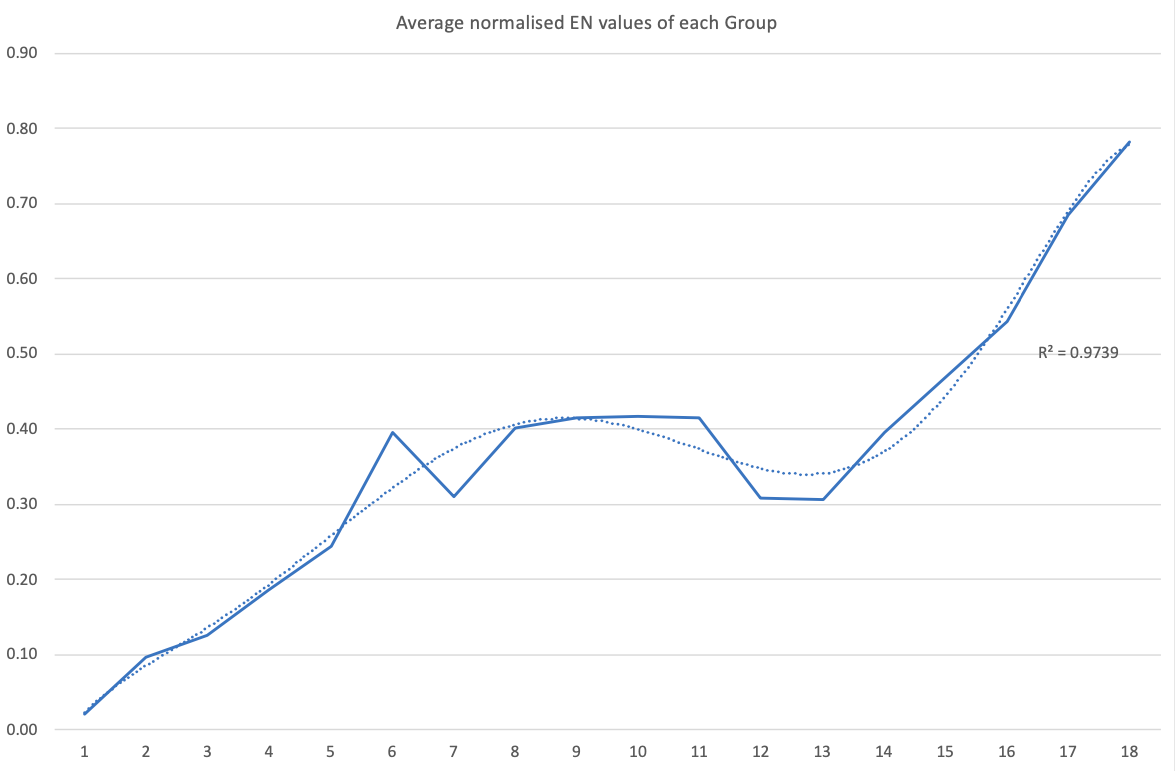
Electronegativity: A Three-Part Wave
René Vernon points out that although there is a general trend in increasing electnegativity from Cs to F, there is actually an s-curve in the data.
Electronegativity across groups 1 to 18 appears to a show a three-part wave-like pattern.
There is a rise from group 1 to group 6, followed by a fall at group 7. I guess for group 7 that the EN for Mn is based on +2 and in this state Mn has five 3d electrons. The EN for Tc and Re are presumably based on +7, in which they notionally have underlying [Kr] and [Xe] cores.
There is rise from 7 to 8 (why?); a mesa from 8 to 11 (why?) that includes the PGM; and a fall at group 12. The fall may be influenced by group 12 having a full d shell; ditto group 13.
There is a rise from 13 to 18. Whereas in group 13 there is ionic chemistry in the form of the cations of Al to Tl this is not the case for C, Si, and Ge in group 14. Sn is reluctant to form a cation expect at pH < 1, and there is no Pb4+ cation.
The R2 value of 0.9739 is a best fit value for a second order polynomial. R2 for a straight line is 0.786
2013
Electronic Configuration Periodic Table
From the Encyclopedia of Metalloproteins, page 1407 published by Springer, 2013 (ISBN: 978-1-4614-1532-9) a periodic table of electronic configurations:

2022
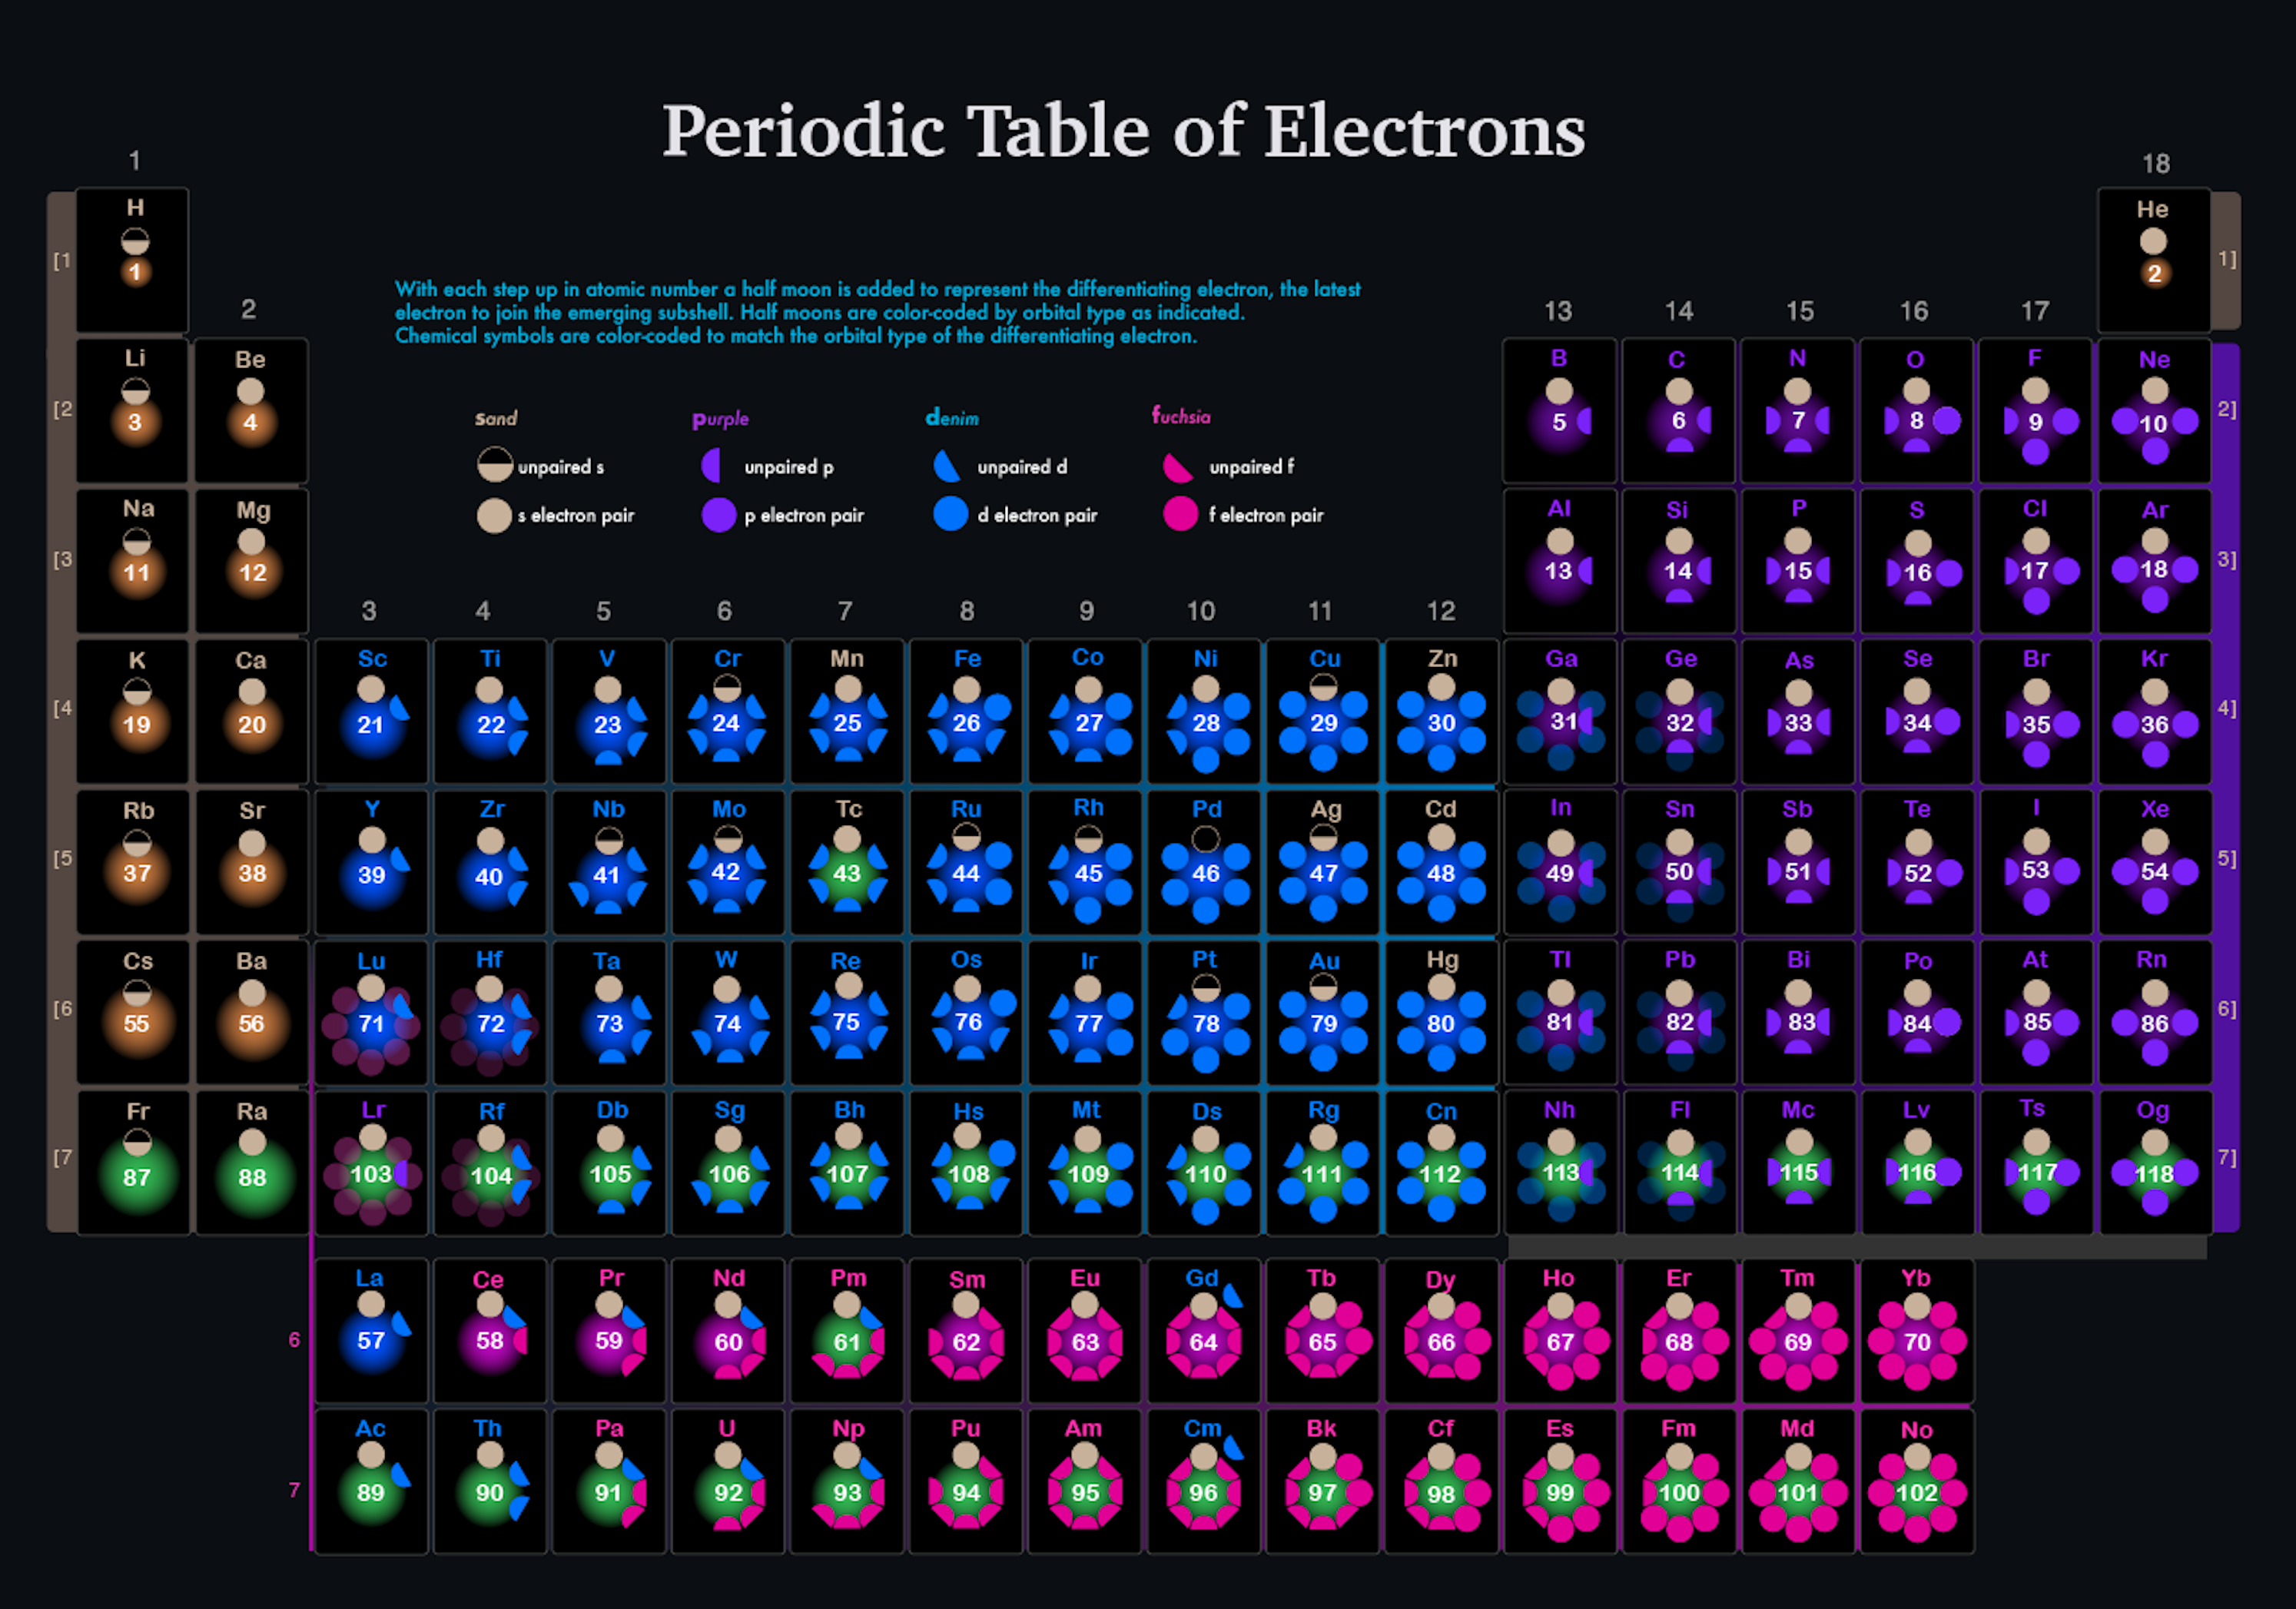
Electrons, Periodic Table of
Brian Gregory's Periodic Table of Electrons. Brian writes:
"I like sand, purple, denim and fuchsia, color-coded by the differentiating electron."
2006
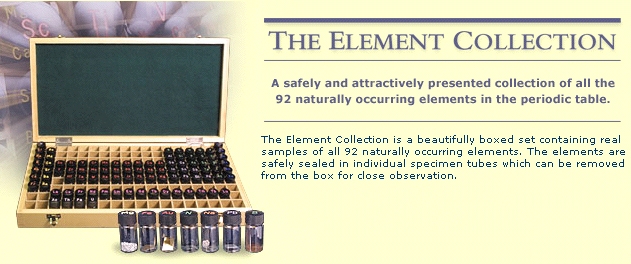
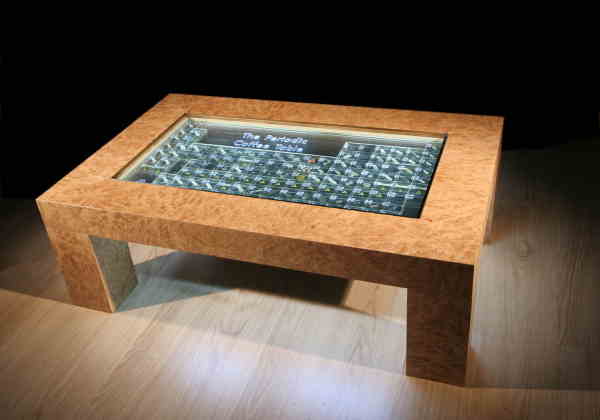
Element Collection Periodic Table
It is possible to buy sets of elements presented as a periodic table from RGB Research Ltd.
1955
Element Hunters
A YouTube video, The Element Hunters.
The text accompanying the video says:
"Scientist in Berkeley discover new elements [Californium & Einsteinium] from hydrogen bomb debris in 1951 and then use the 60 inch Cyclotron to create Mendelevium, element 101. The team included Nobel Prize winner Glenn Seaborg and famed element hunter, Albert Ghiorso."
Thanks to Roy Alexander for the tip!
2023
Element Names: The Etymology of The Periodic Table
An excellent video by RobWords about the names of the chemical elements and how they came about:
2019
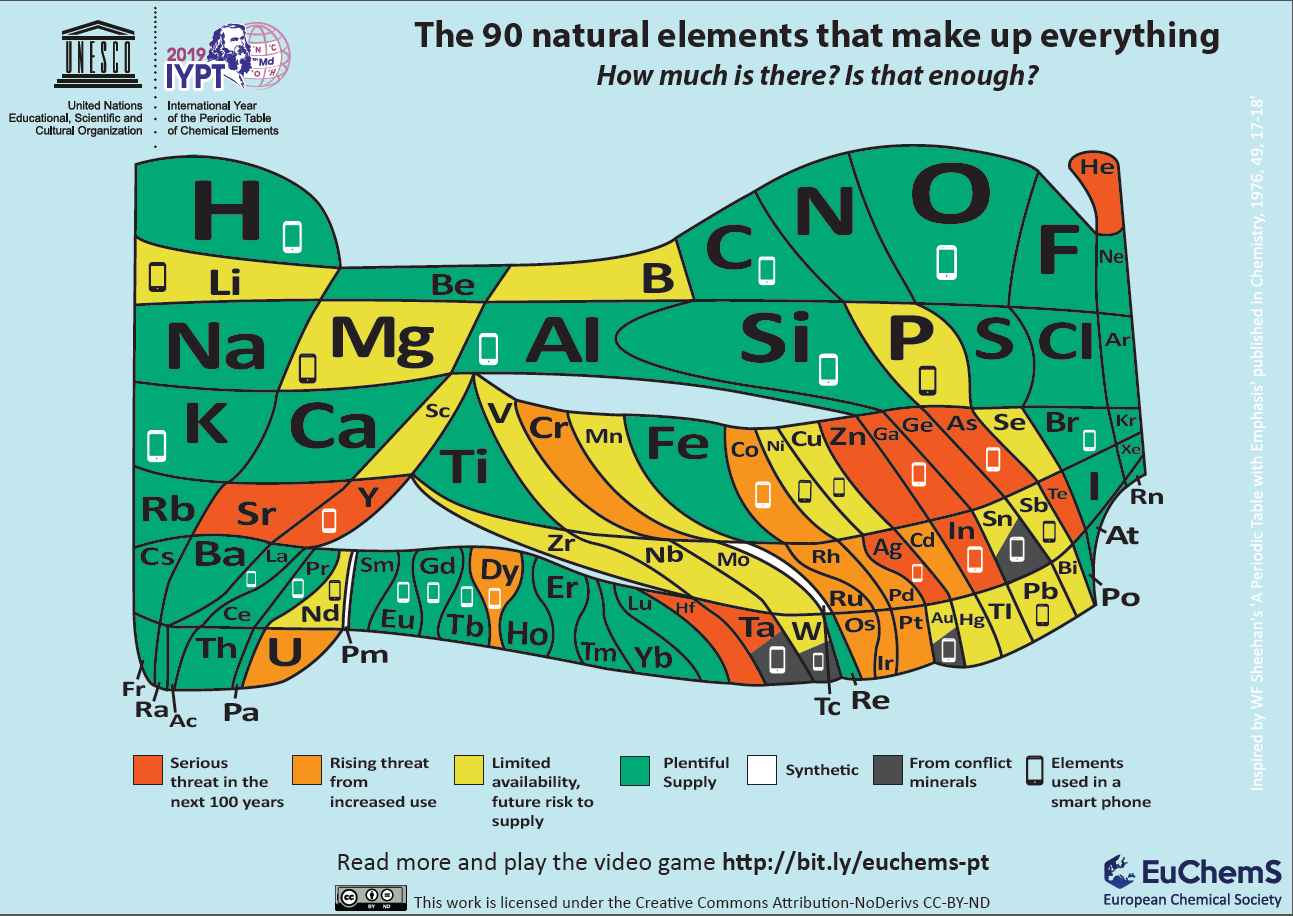
Element Scarcity, Periodic Table of
The European Chemical Society Periodic Table depicting element scarcity was unveiled and discussed at a EuChemS event in the European Parliament on Tuesday 22nd January 2019.
The event, chaired by MEPs Catherine Stihler and Clare Moody, presented an encompassing overview of what element scarcity means for us: both on a scientific level, but also economically and politically. A presentation from speaker Natalia Tarasova, IUPAC Past President, contextualised EuChemS' work within the celebrations of the International Year of the Periodic Table, whilst M Pilar Gil, from the University of St Andrews, delivered a remarkable and exhilarating talk on how the recently discovered oldest known wallchart of the Periodic Table was uncovered and dated.
An article in The Conversation, by David Cole-Hamilton of the University of St Andrews, uses this periodic table to look at elements that are overexploited in the modern world.
"Red indicates that dissipation will make the elements much less readily available in 100 years or less: helium (He), silver (Ag), tellurium (Te), gallium (Ga), germanium (Ge), strontium (Sr), yttrium (Y), zinc (Zn), indium (In), arsenic (As), hafnium (Hf) and tantalum (Ta).
"Helium is used to cool the magnets in MRI scanners and to dilute oxygen for deep sea diving. Vital rods in nuclear reactors use hafnium. Strontium salts are added to fireworks and flares to produce vivid red colours. Yttrium is a component of camera lenses to make them shock and heat resistant. It is also used in lasers and alloys. Gallium, meanwhile, is used to make very high-quality mirrors, light-emitting diodes and solar cells."
2004
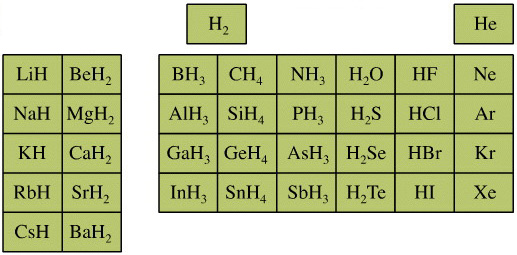
Elemental Hydride Types Periodic Table

- Ionic or Salt-Like Hydrides: Molten LiH conducts electricity and hydrogen gas is liberated at the anode confirming presence of hydride ion H–. The crystal structures show an ionic lattice, and not an LiH molecular lattice.
- Covalent Hydrides are formed by the p-Bolock elements.
- Metallic or Interstitial Hydrides are formed by many d-block and f-block elements when heated with hydrogen under pressure. The hydrides tend to be non-stoichiometric and they may be of variable composition.
- There is a Hydride Gap where elements do not form hydrides. This roughly maps to the Siderophile Elements of the geologist's periodic table (below).
- The Intermediate Hydrides do not fit: beryllium hydride is polymeric, (BeH2)n. Others have properties between metallic and covalent.
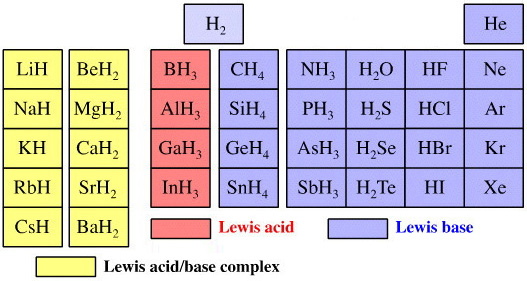
The main group elemental hydrides are all well known reagent chemicals. The main group hydrides always give the lowest and most common oxidation state, and all chemicals are molecular in the gas phase. The Group I and II hydrides are ionic materials, but they can be vaporised to give the molecular form.
The chemicals present and behave as Lewis acids, Lewis bases or Lewis acid/base complexes, here:
By Mark Leach
2004
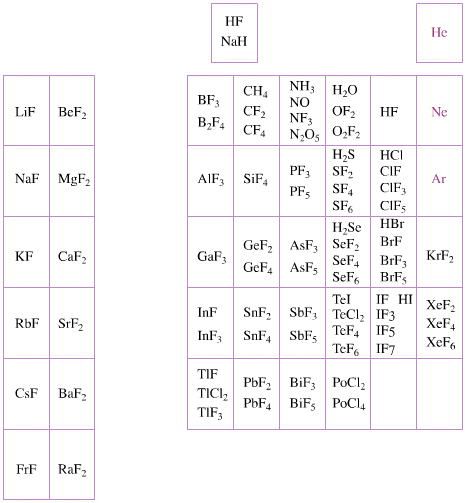
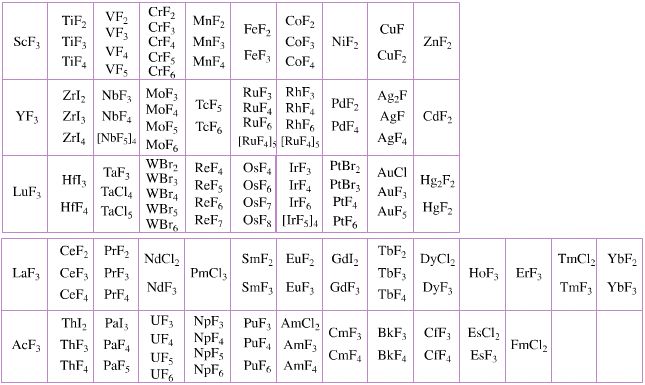
Elemental Oxidation States Periodic Table
The periodic table of fluorides (mainly) shows the range of possible oxidation states. Note that lithium, by way of example, is deemed to have two oxidation states: Li0 (the metal), and Li+ (the lithium ion):
There are a few exceptions and points to note:
- There is a general increase in the number of possible oxidation states towards the lower right hand side of the periodic table.
- Nitrogen(V) fluoride, NF5, is not known, but the nitrogen(V) oxide is: N2O5.
- PtBr2 and PtBr3 are known, but PtF2 and PtF3 are not.
- All elements are known in the zero oxidation state, but apart from: He, Ne & Ar, and these are not shown in the diagram below.
- All data is from WebElements.
By Mark Leach
2011
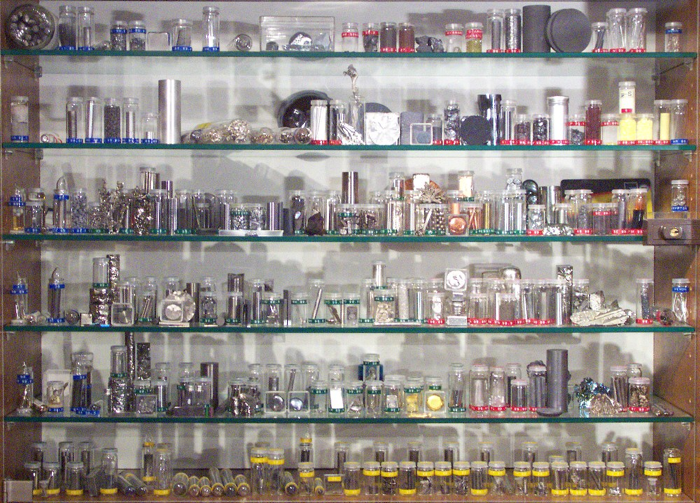
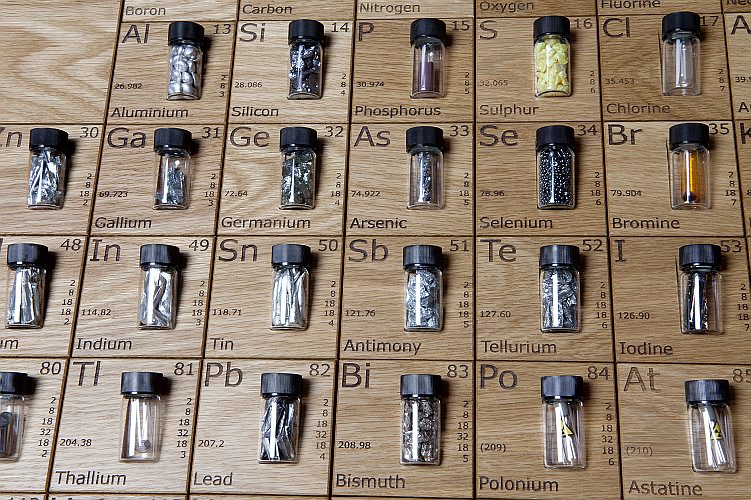
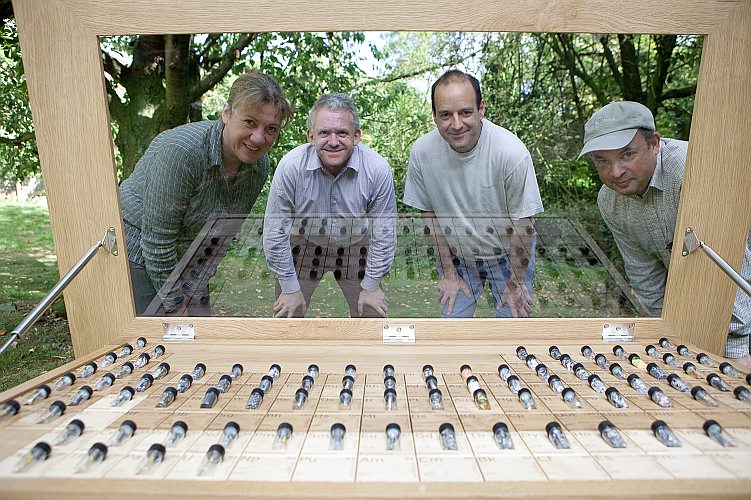
Elements in Bottles Periodic Table
A nice web site with a physical periodic table of elements:
2006
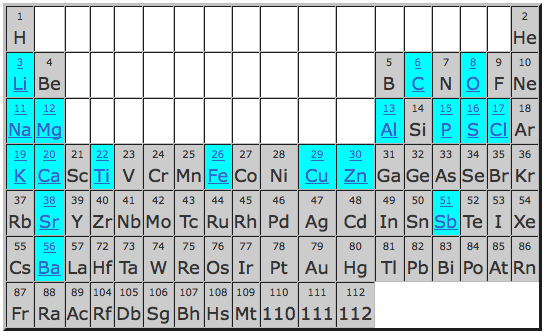
Elements in Fireworks
Fireworks rely on the chemical characteristics of the elements that are used to make them. This special periodic table highlights the elements that have significance to fireworks and pyrotechnics:
2015
Elements: A Series of Business Radio Programs/Podcasts
A series of BBC World Service Radio Programs, available as MP3 Podcasts, talking about the chemical elements with a strong business/technology bias, rather than the more usual chemical or historical approach:

Thanks to Marcus Lynch for the tip!
1987
Elsevier's Periodic Table of the Elements
Prepared by P. Lof is Elsevier's Periodic Table of the Elements.
This educational wall chart features the periodic table of the elements supported by a wealth of chemical, physical, thermodynamical, geochemical and radiochemical data laid down in numerous colourful graphs, plots, figures and tables. The most important chemical and physical properties of the elements can be found - without turning a page.
All properties are presented in the form of tables or graphs. More than 40 properties are given, ranging from melting point and heat capacity to atomic radius, nuclear spin, electrical resistivity and abundance in the solar system. Sixteen of the most important properties are colour coded, so that they may be followed through the periodic system at a glance. Twelve properties have been selected to illustrate periodicity, while separate plots illustrate the relation between properties. In addition, there are special sections dealing with units, fundamental constants and particles, radioisotopes, the Aufbau principle, etc. All data on the chart are fully referenced, and S.I. units are used throughout.
Designed specifically for university and college undergraduates and high school students, "Elsevier's Periodic Table of the Elements" will also be of practical value to professionals in the fields of fundamental and applied physical sciences and technology. The wall chart is ideally suited for self-study and may be used as a complementary reference for textbook study and exam preparation.
- atomic number
- standard atomic weight
- ground-state electronic configuration
- element symbol
- element name
- discoverer and year of discovery
- melting point; boiling point
- critical temperature
- molar enthalpy of atomization
- molar enthalpy of fusion
- molar enthalpy of vaporization
- atomic energy levels of the outermost three orbitals
- formal oxidation states
- selection of standard reduction potentials
- first, second & third molar ionization energies
- Pauling electronegativity
- Allred-Rochow electronegativity
- molar electron affinity
- molar volume
- crystal structures
- polymorphic transition temperatures
- atomic radius
- effective ionic radii
- volumic mass (density)
- electrical resistivity
- thermal conductivity
- abundance in the solar system
- abundance in the Orgueil meteorite
- abundance in the solar photosphere
- abundance in the continental crust
- abundance in the primitive mantle
- abundance in the oceanic crust
- naturally occurring isotopes
- mass number and representative isotopic composition
- molar heat capacity
- Debye temperature
- coefficient of linear thermal expansion
- price; annual mining production
- world reserve base
- nuclear spin and NMR receptivity
- Mossbauer active nuclides
- physical (standard) state
- metallic character
- abundance in food (human daily intake)
- principal hazardous property
- Other information: Aufbau principle, quantum numbers, orbitals and sequence of orbital filling; trivial group names; drawings of crystal lattice structures; 12 plots of a chemical/physical property against atomic number; 9 plots of a property against another property; list of SI units and SI prefixes; list of other units and their conversion to SI; list of fundamental physical constants; scheme of fundamental particles; list of radioisotopes with half-life longer than 5 days, presenting half-life and mode(s) of decay, indicating cosmogenic isotopes and isotopes produced by U-235 fission, as well as radioisotopes used in geochronology, pharmacology and nuclear medicine.


Thanks to Eric Scerri for the tip!
See the website EricScerri.com and Eric's Twitter Feed
2016
Emission Spectra of the Elements Poster
Tom Field, President, Field Tested Systems, LLC and Contributing Editor, Sky & Telescope Magazine says: "We have complete redesigned our Emission Spectra of the Elements Poster and put it up for sale."
A couple of links:
www.fieldtestedsystems.com - classroom gas-tube spectroscopy
www.rspec-astro.com - astronomical spectroscopy
Sky & Telescope

1970
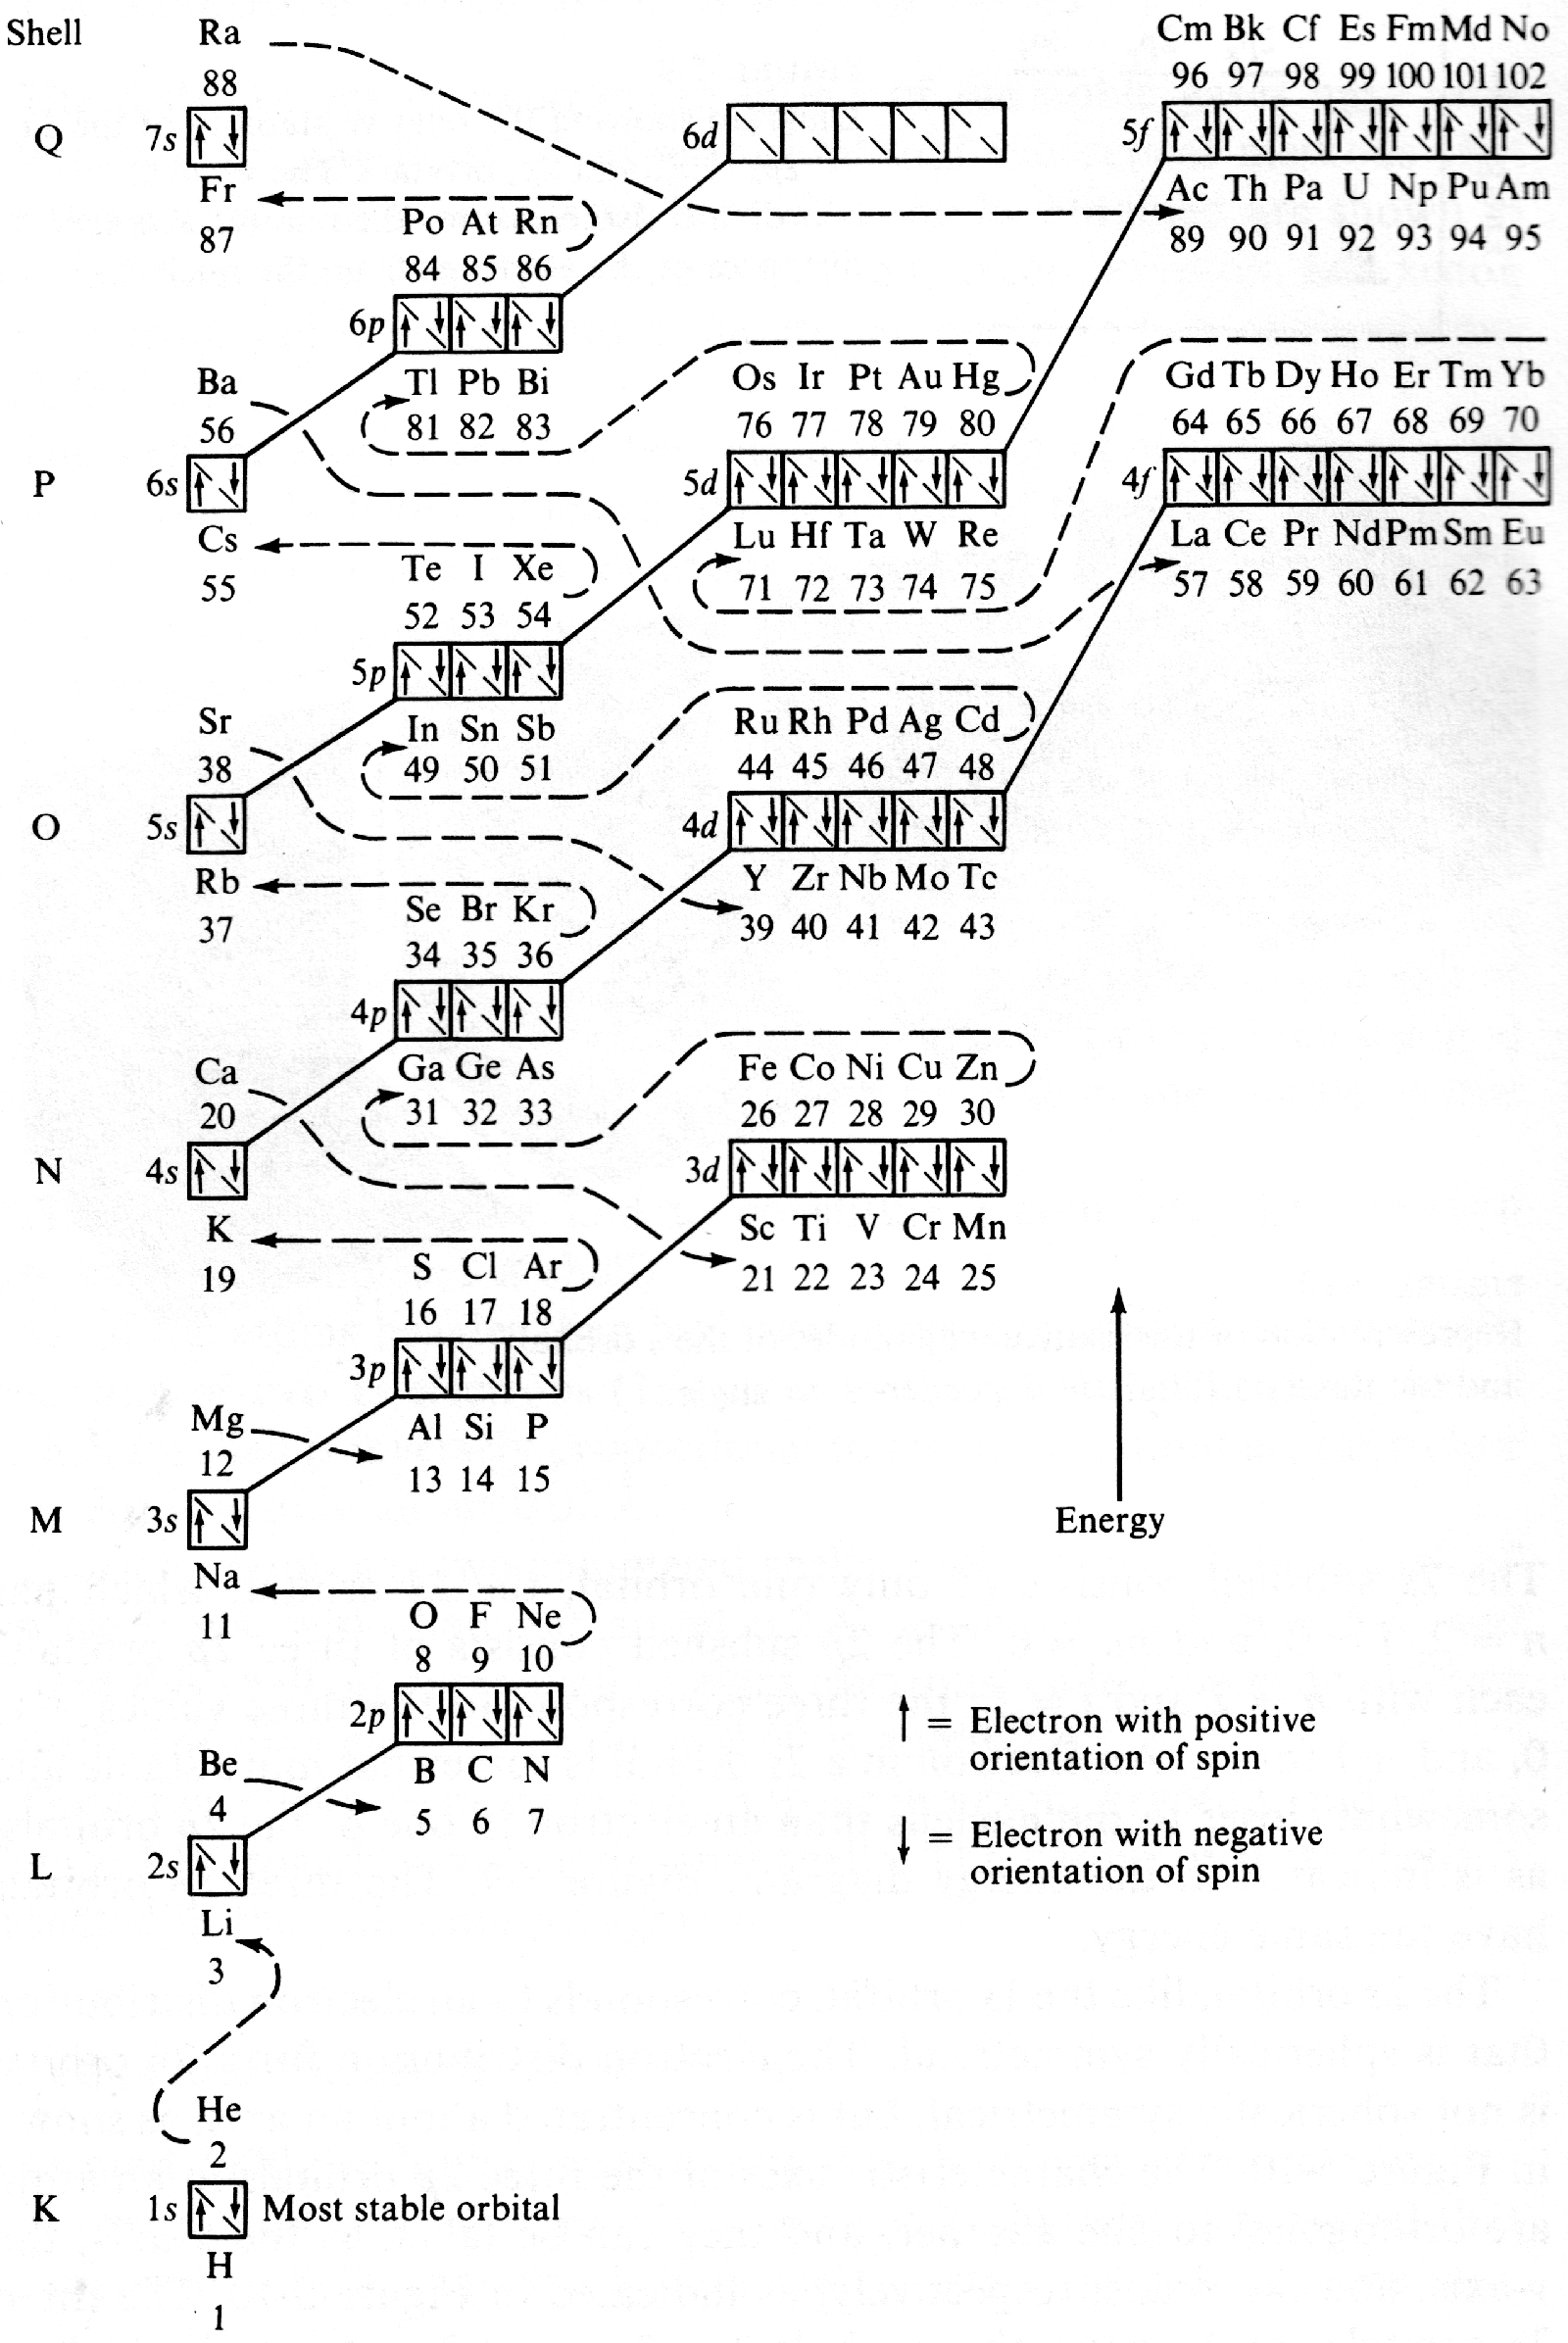
Energy Level Diagram of Electron Shells & Subshells of the Elements
Figure 5-11 from page 128 of Linus Pauling's General Chemistry, W.H. Freeman, San Francisco 1970 (Dover Edition 1988):
2007
Extending the Periodic Table
The periodic table now extends to element 118, Oganesson, and scientists are attempting to go further. Below is part of a Segre chart, proton number on the y-axis and neutron number of the x-axis, from a report from the Japanese Superheavy Element Laboratory, RIKEN Nishina Center, RIKEN.
The diagram shows various nuclear reactions, for example: 232Th + 40Ar to make 272Hs.
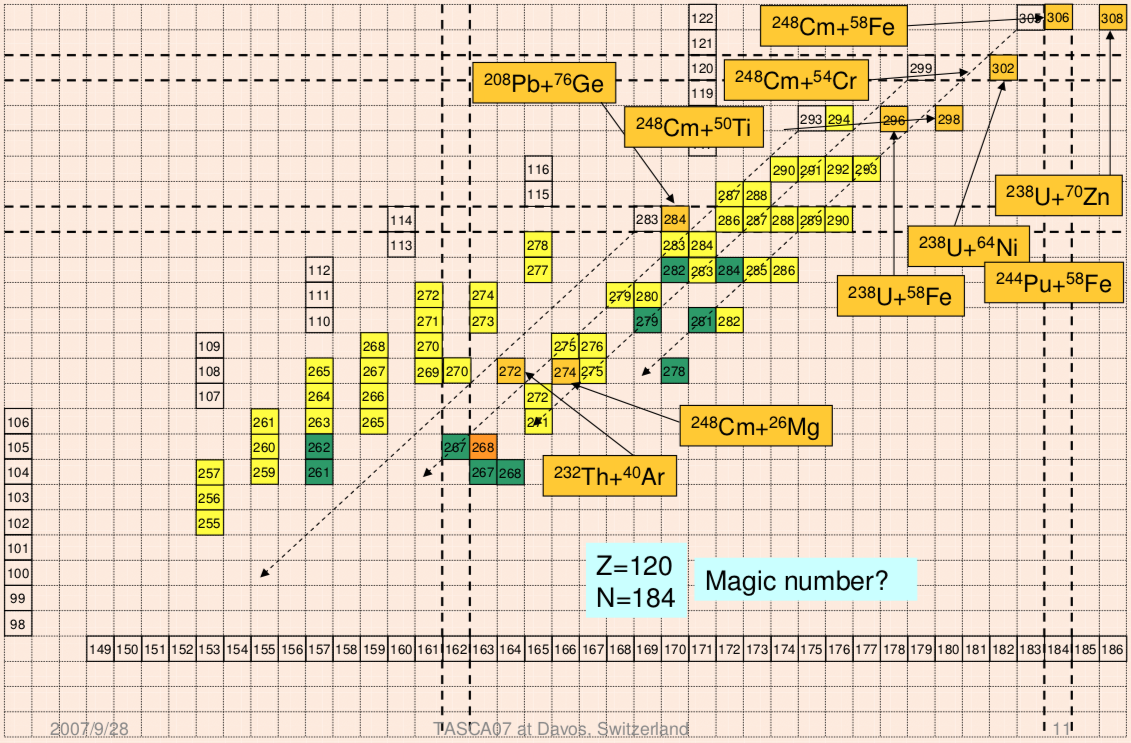
Thanks to Larry Tsimmerman for the tip!
2005
Extraction from Ore to Pure Element
A periodic table showing how pure elements are extracted:
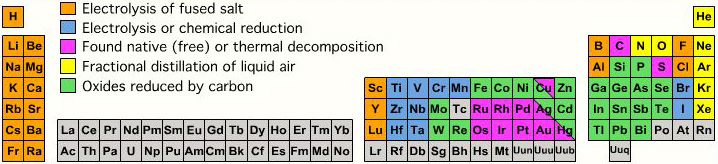
Highly electropositive elements (Na, K) and electronegative elements (Cl2, F2) can only be obtained by electrolysis.
By Mark Leach
2018
First Ionisation Energy to the Standard Form Periodic Table
There is debate amongst the cognoscenti about the 'best' representation of the periodic table, and how this 'best' formulation can be explained by [rationalized by] quantum mechanics (QM).
Many feel that the Janet PT formulation, the 'Left Step', is the ideal QM PT, but this formulation does not show periodicity very well, and there are issues with the placement of H, He, Be which spill over into questions about their placement in the standard form PT (the periodic table used in classrooms and textbooks around the world).
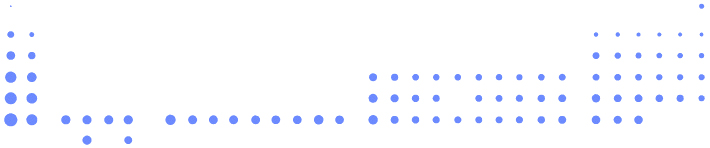
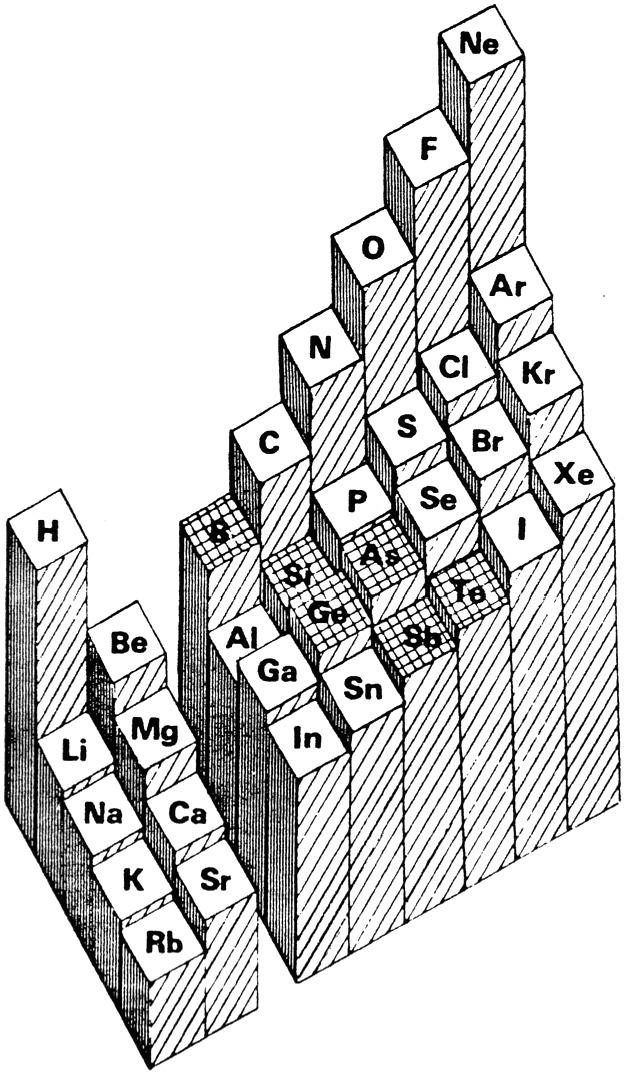
However, it is possible to get to the conventional standard form PT directly from the first ionisation energy data, where the 1st ionisation energy is the energy required to convert a gas phase atom (M) into its gas phase positive ion plus electron.
M(g) → M+(g) + e–
The process involves:
- taking the 1st ionisation data plot for the elements H to Xe (Z = 1 to 36)
- rotate 90° clockwise and stretch
- move the atoms horizontally into columns


Note that a similar logic can be applied to atomic radius and electronegativity data.
However, there are issues about the measurement of atomic radius, because atoms are 'soft at their edges', and gas phase atomic radius is not precisely defined. And, electronegativity is a derived parameter.
By Mark Leach
1937
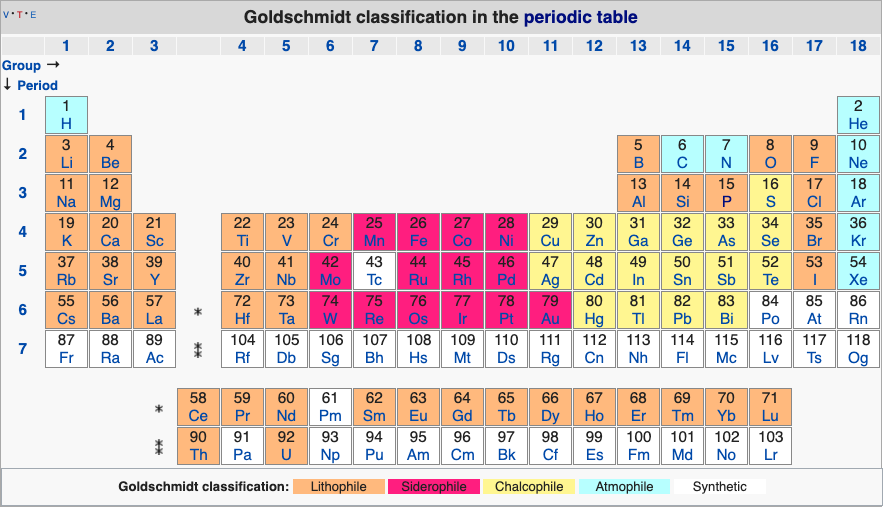
Geochemical Periodic Table (Goldschmidt Classification)
From Wikipedia: The Goldschmidt Classification is a gechemical periodic table which groups the chemical elements within the Earth according to their preferred host phases into:
- lithophile (rock-loving)
- siderophile (iron-loving)
- chalcophile (ore-loving or chalcogen-loving)
- atmophile (gas-loving)
- volatile (the element, or a compound in which it occurs, is liquid or gaseous at ambient surface conditions).
Some elements have affinities to more than one phase. The main affinity is given in the table below and a discussion of each group follows that table.
2019
Geological Periodic Table
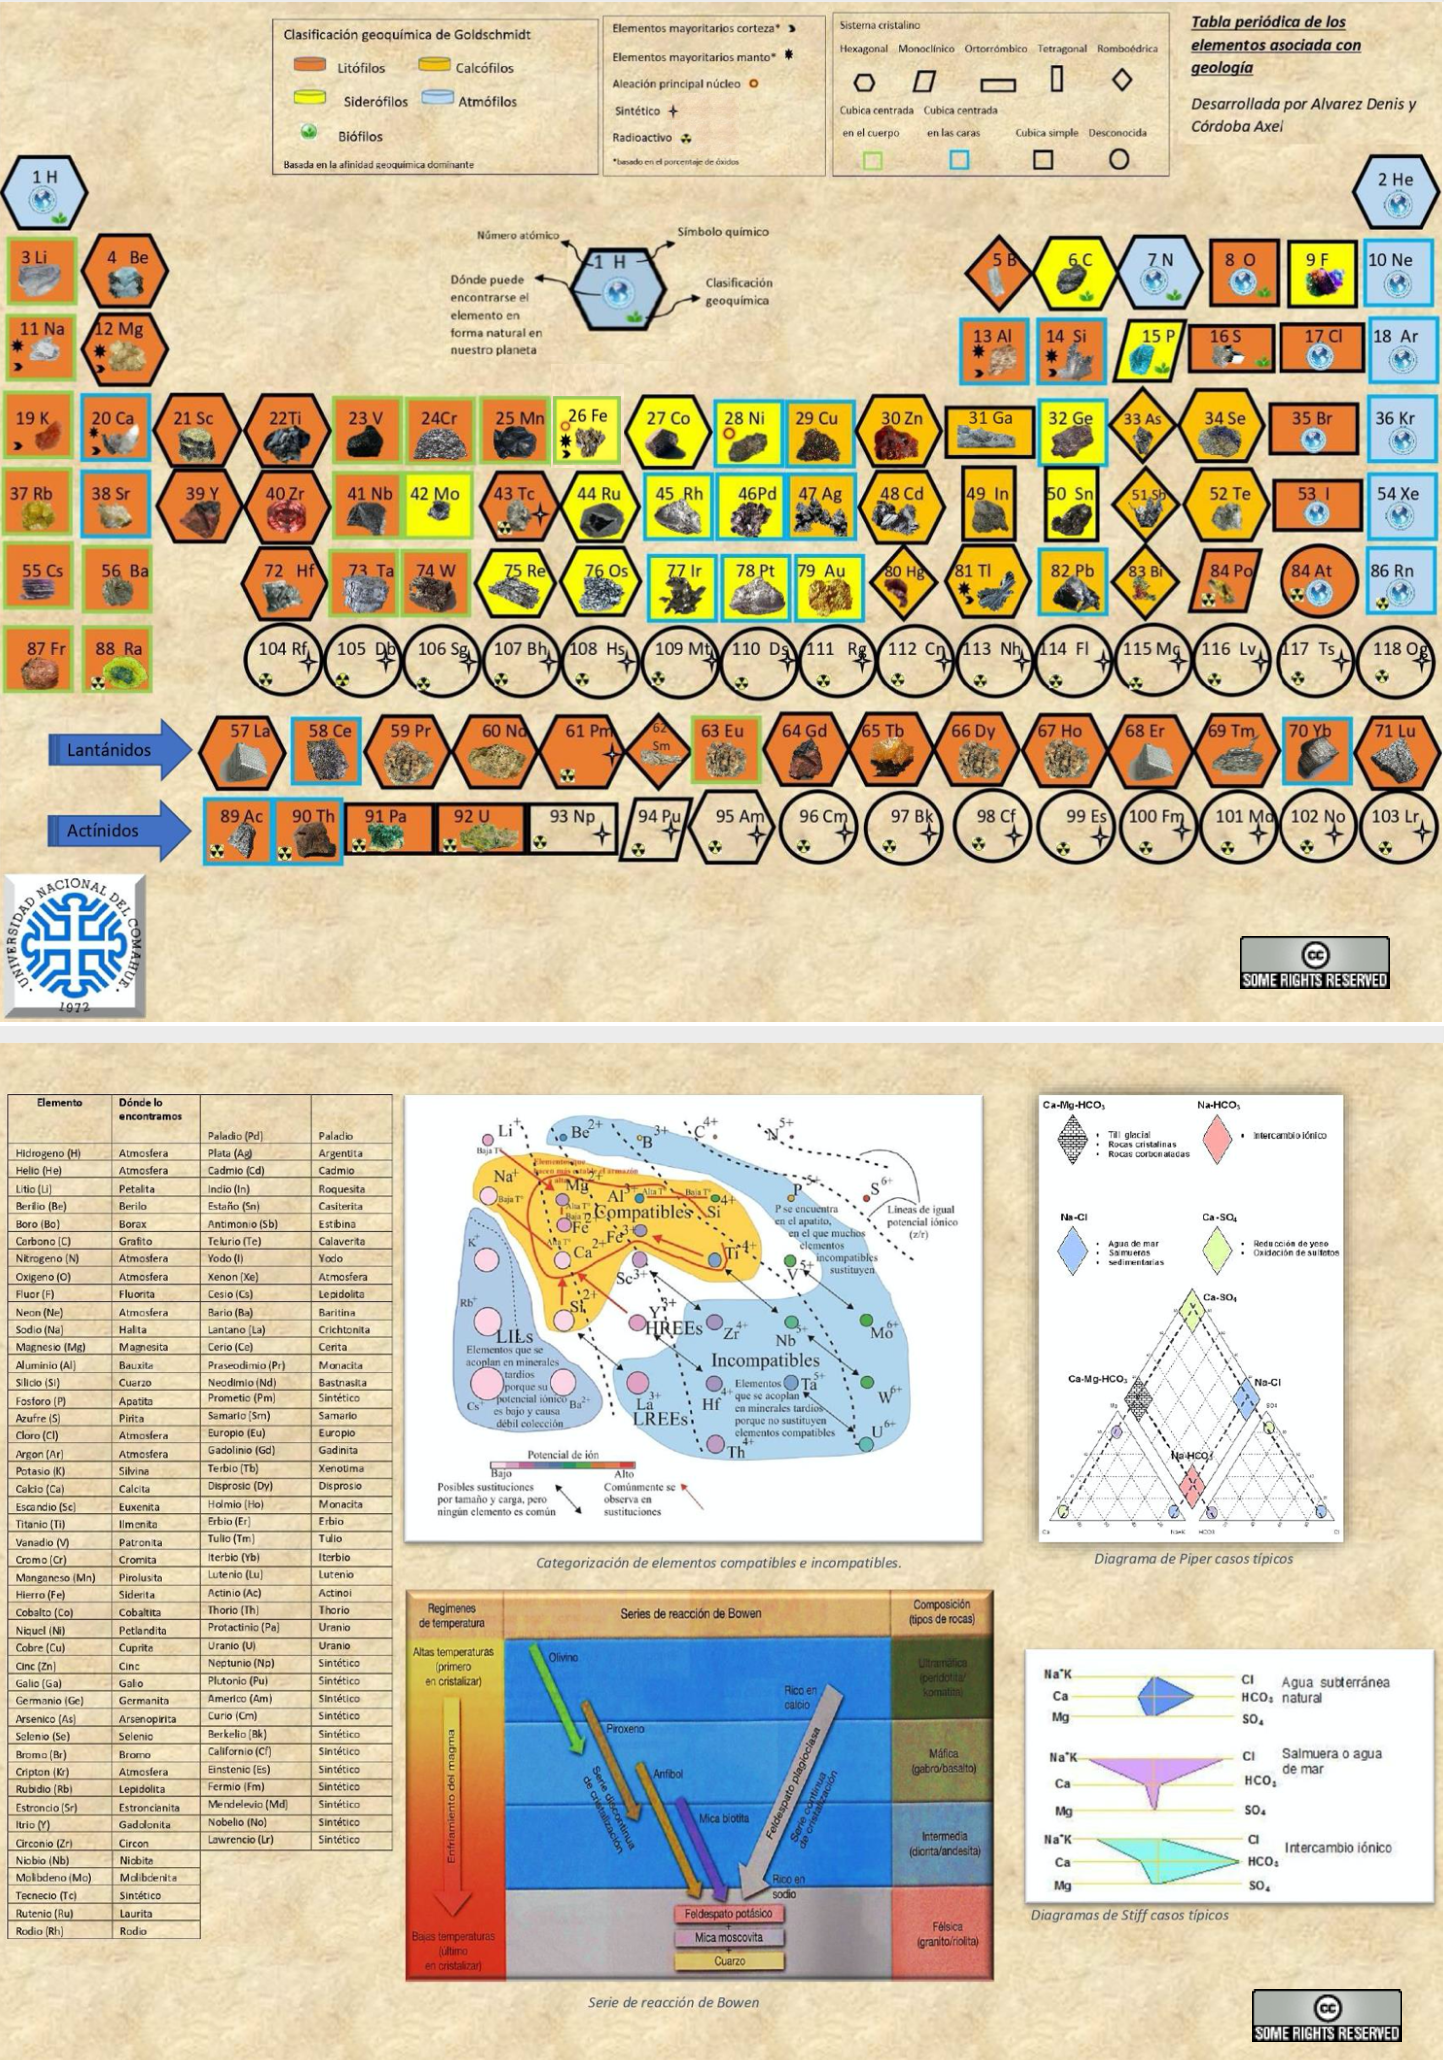
Alvarez & Cordoba's Periodic Table of the Elements Associated with Geology [from Spanish using Google Translate]
"It is a simple and innovative table where each element has the shape of its respective crystalline system. It also has several novelties linked to earth sciences such as: illustrative images that show where the element can be found naturally on our planet, geochemical classification and different types of relevant characterizations (radioactivity, synthetics, alloys, majority elements in bark and mantle). Likewise, various useful tools were included in the area such as the well-known Bowen series, categorizations of compatible and incompatible elements, typical cases of the Piper diagram and Stiff diagrams.
"To increase the interaction and understanding between the user and the table, it has elements external to it (letters) that incorporate augmented reality, which allows learning in a simpler, didactic and entertaining way about the atomic structure of chemical elements in 3D. Just scan the back of the letter with your cell phone to see its structure."
Click the image to see the PDF file
2005 Geologist's Periodic Table
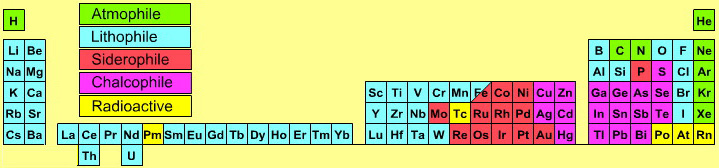
Atmophile Elements - noble gases and covalently bonded gaseous molecules. The atoms and molecules are attracted by weak van der Waals forces and so these elements remain gaseous at room temperature.
Lithophile Elements - Those elements which form ionic bonds generally have filled outer electron shells. They typically bond to oxygen in silicates and oxides.
Siderophile Elements - The metals near iron in the periodic table that exhibit metallic bonding, have a weak affinity for oxygen and sulfur and are readily soluble in molten iron. Examples include iron, nickel, cobalt, platinum, gold, tin, and tantalum. These elements are depleted in the earth crust because they have partitioned into the earth's iron core.
Chalcophile Elements - The elements that bond to S, Se, Te, Sb, and As. These bonds are predominantly covalent in character.
As discussed in more detail here.
By Mark Leach
2019
Global Periodic Table
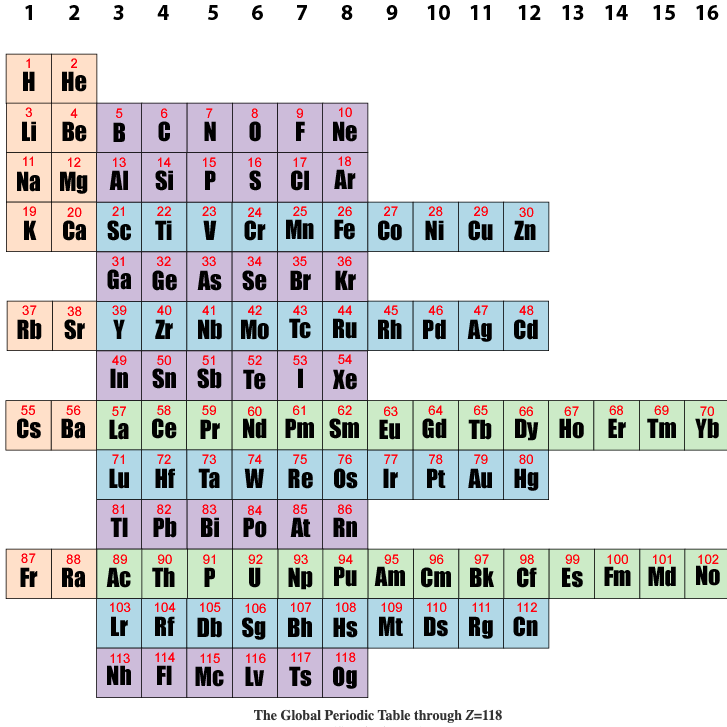
Brian Gregory of keytochemicstry.com presents a Global Periodic Table.
The figure below shows the subshell strings aligned in columns based on the total pool of valence electrons as described above. This is the global periodic table. Each column constitutes a global group. Each term in column 1 launches a global period. The global periodic table is a purely mathematical matrix that assigns precise row and column coordinates to all positive integers but makes no predictions as to the order in which subshells are filled. Read more here.
1971
Goldanskii's Chess Board Version of The Madelung Rule (For Orbital Filling)
Ref: Goldanskii, V I: The Periodic System of D I Mendeleev and Problems of Nuclear Chemistry pp 137-162 ex: Verde M (ed.): 1st International Conference on the Periodic Table, Vincenzo Bona, Torino 1971.
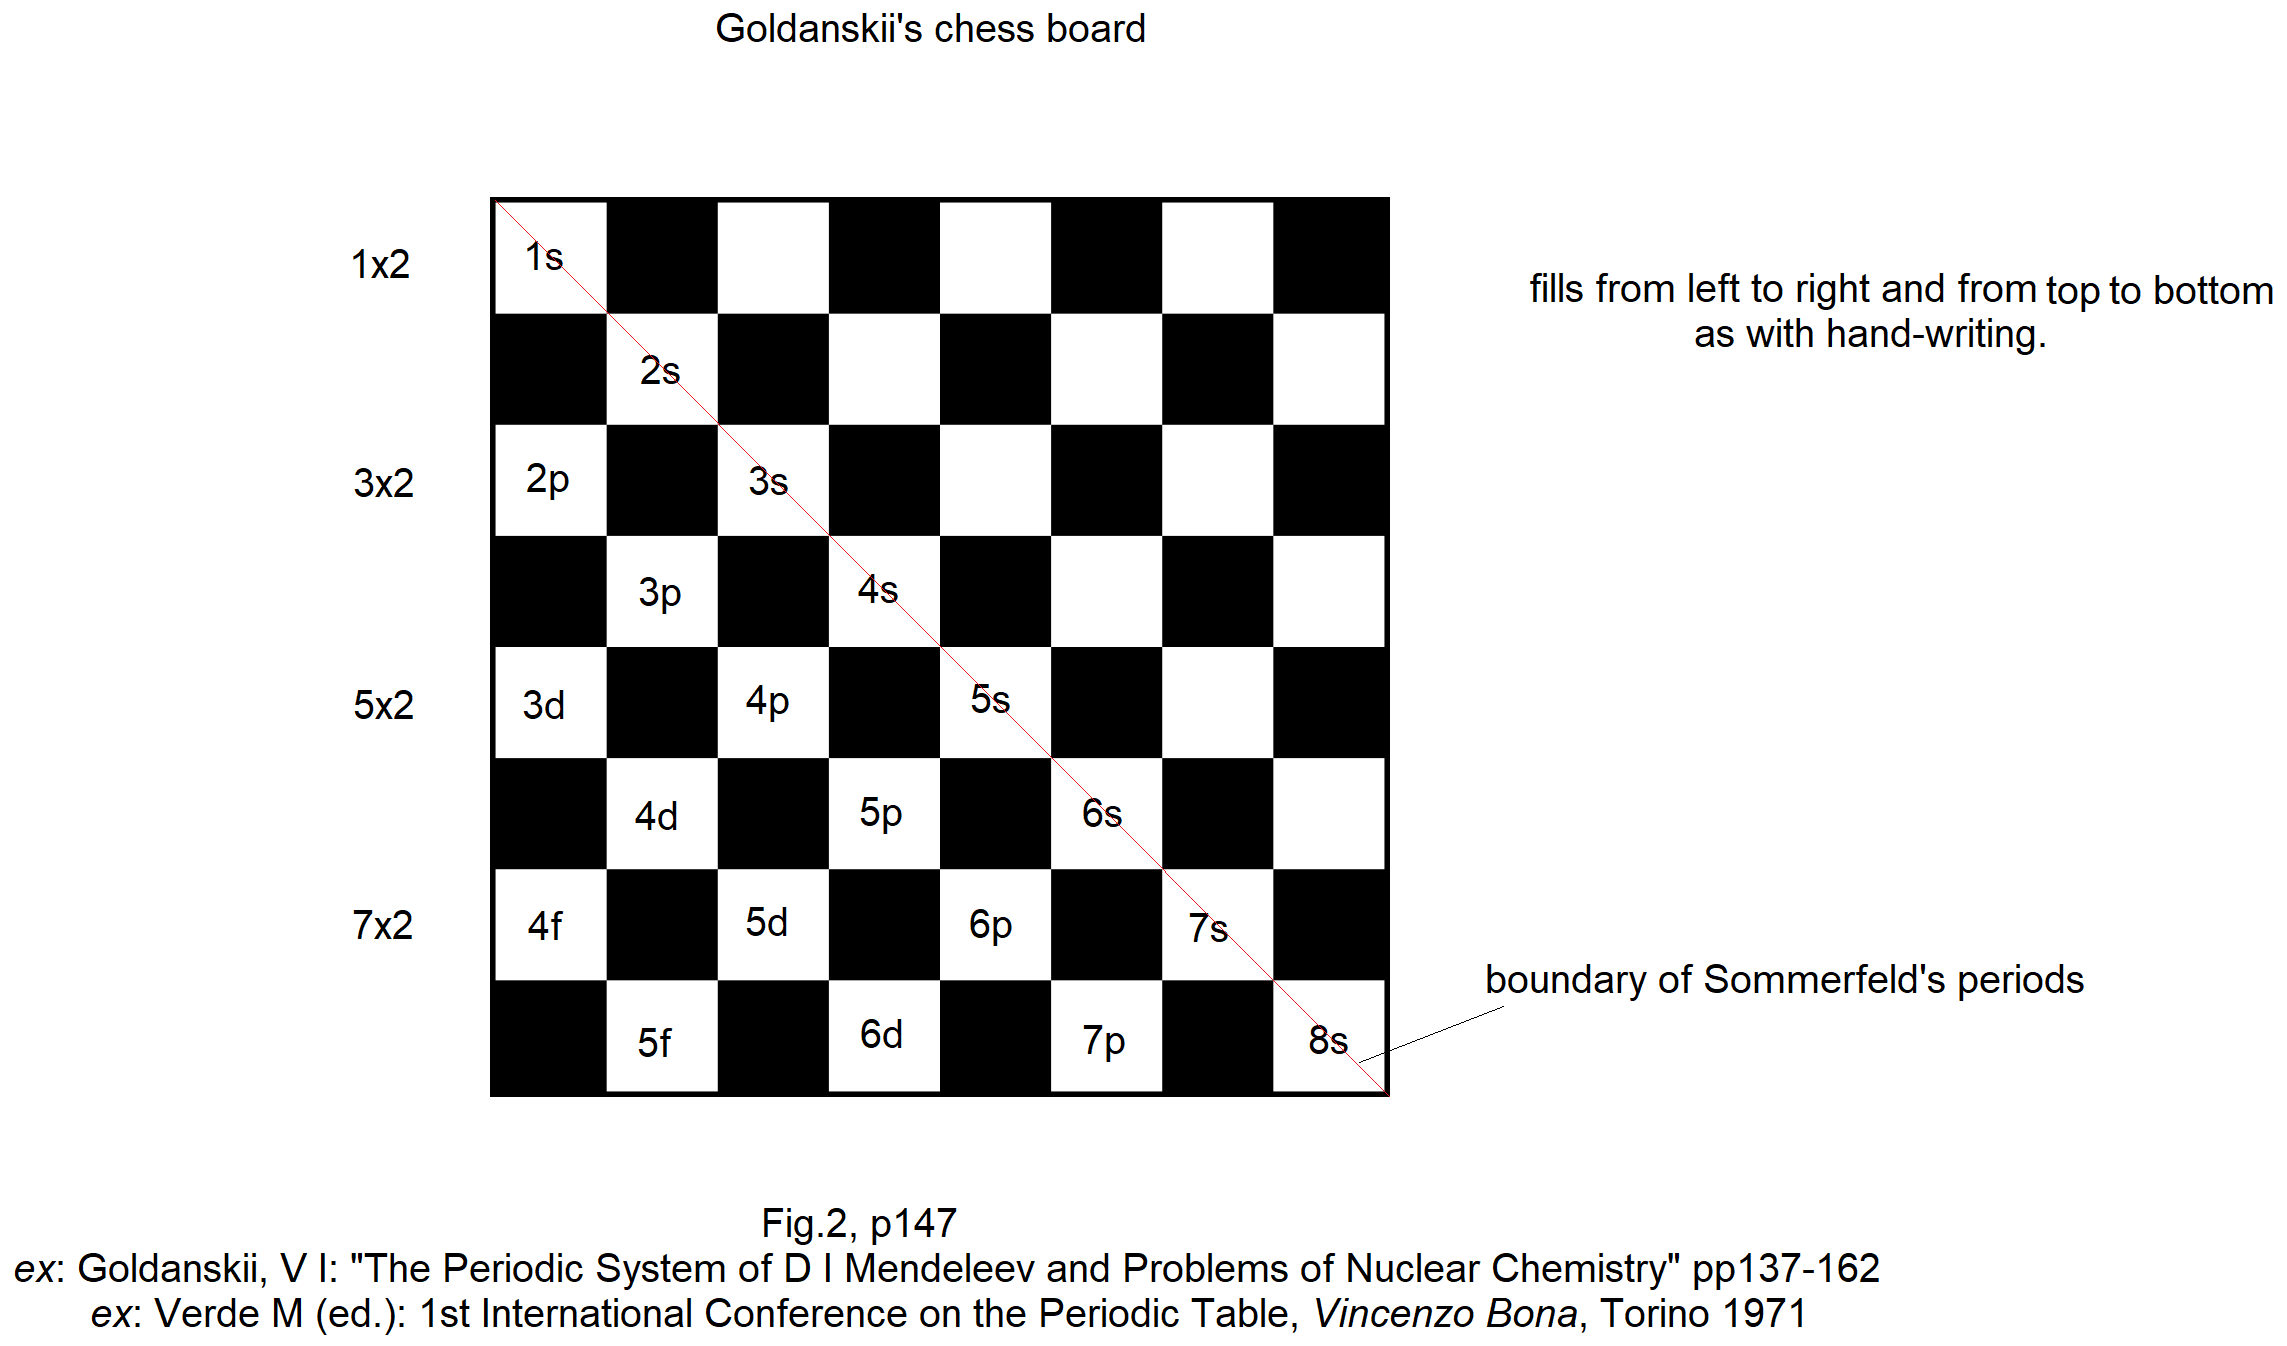
Thanks to John Marks for the tip!
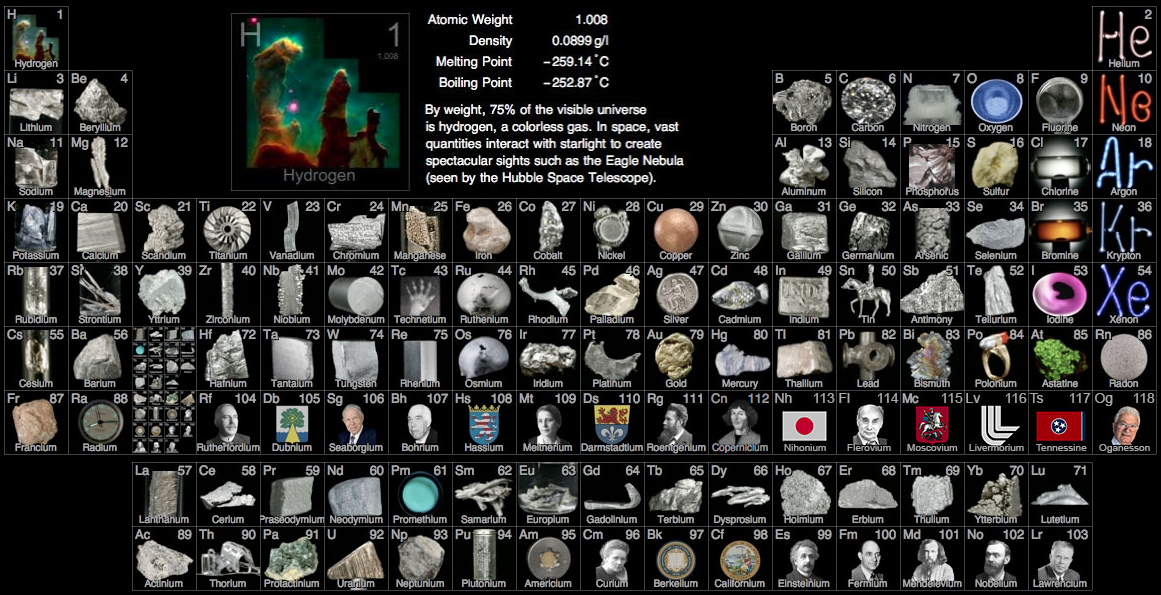
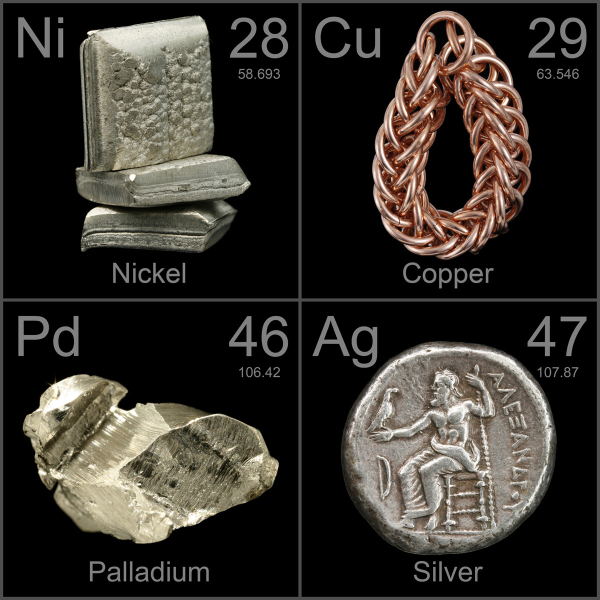
2007
Gray's Photographic Periodic Table
Theodore Gray's Periodic Table.Com is a live version of what is generally regarded as the most beautiful periodic table to be developed so far. It is a treasure trove of pictures, videos and stories. Explore!
Theo is an enthusiast and a collector, and he uses the power of Mathematica (he is a co-founder of Wolfram Research) to drive his astonishing website. It is Theo's aim to be the number one periodic table resource on the web.
Mark Leach, the database curator writes:
"I find Theo's website and approach to be complementary to the more academic WebElements."
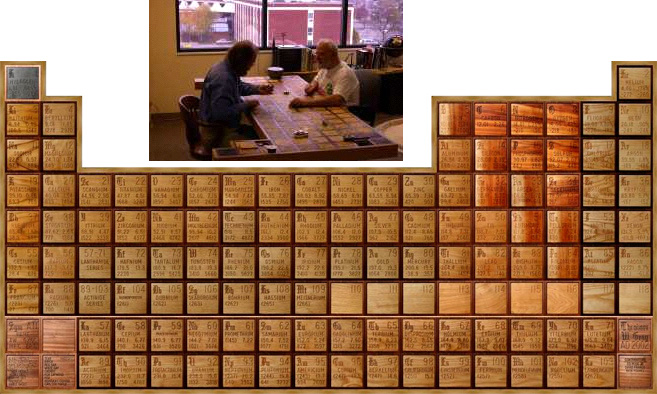
1998
Gray's Wooden Periodic Table Table
Theodore Gray's Wooden Periodic Table Table – a wooden table that incorporates a periodic table – is a treasure trove, both on the web and in reality (his office).
The web site contains over 12 gig of data and beautiful images. Explore!
Theo's new site is periodictable.com.
2019
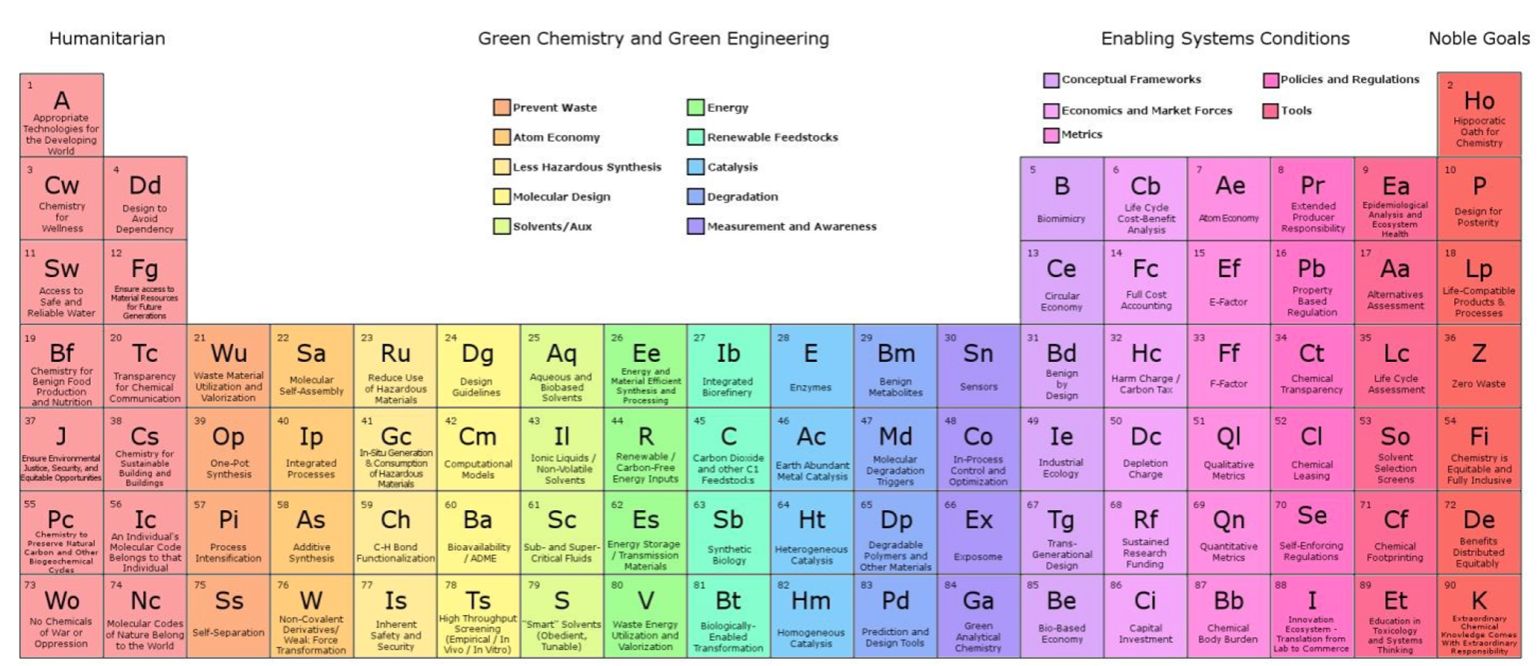
Green & Sustainable Chemistry, Periodic Table of
The periodic table of the elements of green and sustainable chemistry by Paul T. Anastas & Julie B. Zimmerman, Green Chem., 2019,21, 6545-6566, (DOI: 10.1039/c9gc01293a). Also, there is a review article in Chemistry World.
Thanks to Eric Scerri for the tip!
See the website EricScerri.com and Eric's Twitter Feed.
2019
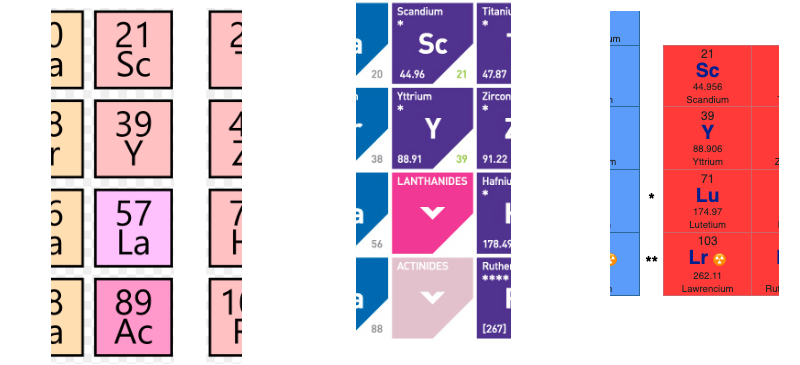
Group 3 of The Periodic Table
There are several ways in which the 'common/modern medium form' periodic table are shown with respect to the Group 3 elements and how the f-block is shown. Indeed, there is even some dispute about which elements constitute Group 3. There are three general approaches to showing Group 3:
- Sc, Y, La, Ac
- Sc, Y than a gap for the lanthanides & a gap for the actinides
- Sc, Y, Lu, Lr
(See Scerri's take and Thyssen's view on this matter.)
So, which one of the three options is 'better'?
The general feeling amongst the knowledgeable is that leaving a gap is not an option, so it comes down to:
Sc, Y, La, Ac vs. Sc, Y, Lu, Lr
René Vernon has looked as the properties of the potential Group 3 elements, including: densities, 1st ionisation energies, ionic radii, 3rd ionisation energies, melting points & electron affinity:
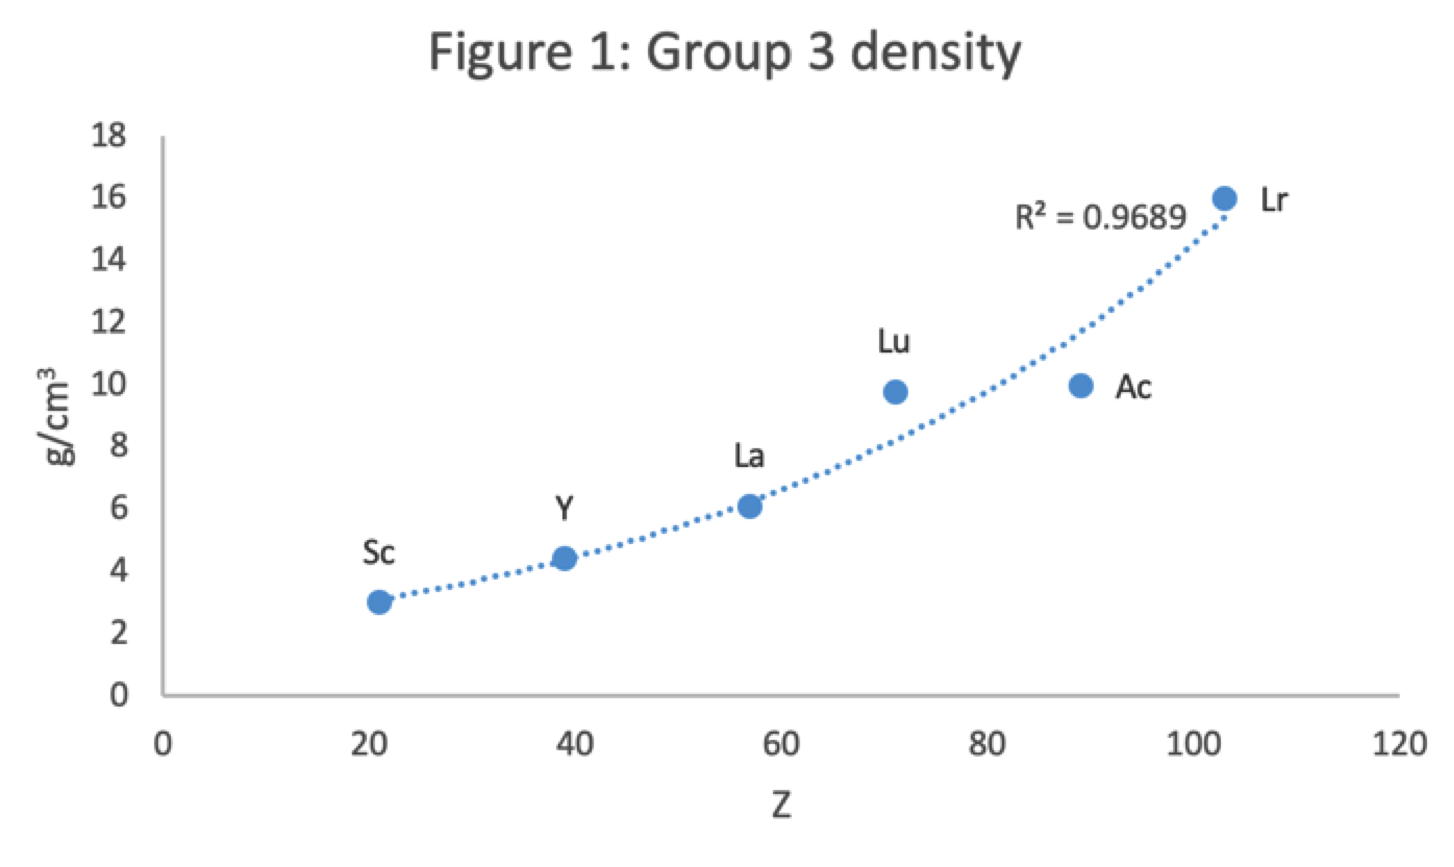
Figure 1 shows that a Z plot of the density values for Sc, Y, La, Lu Ac and Lr follows a smooth trendline.
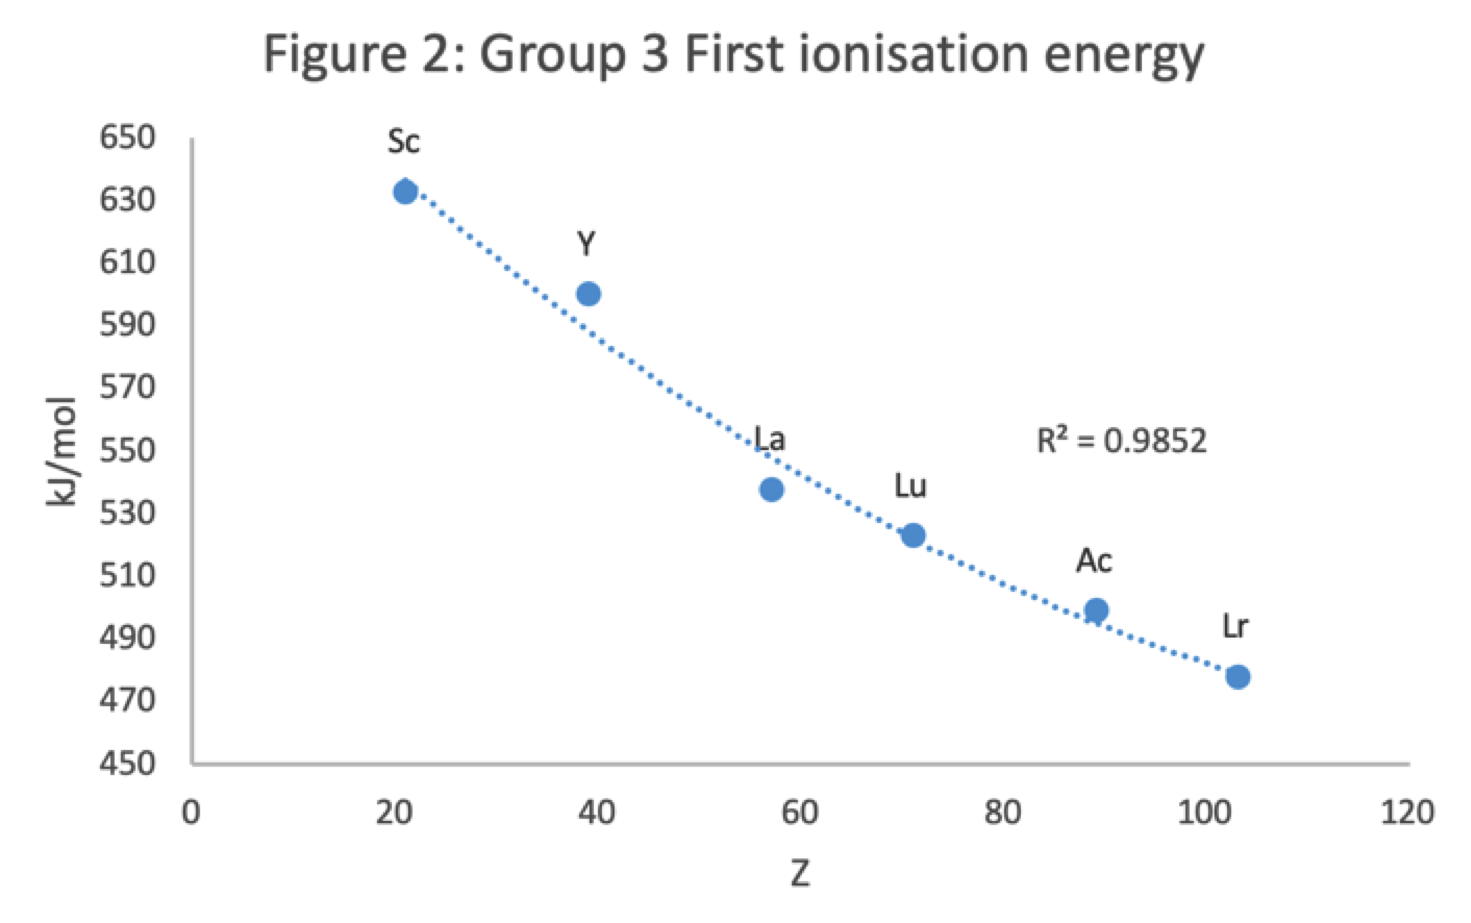
Figure 2 shows that a Z plot of the first ionization energy values follows a smooth trendline.
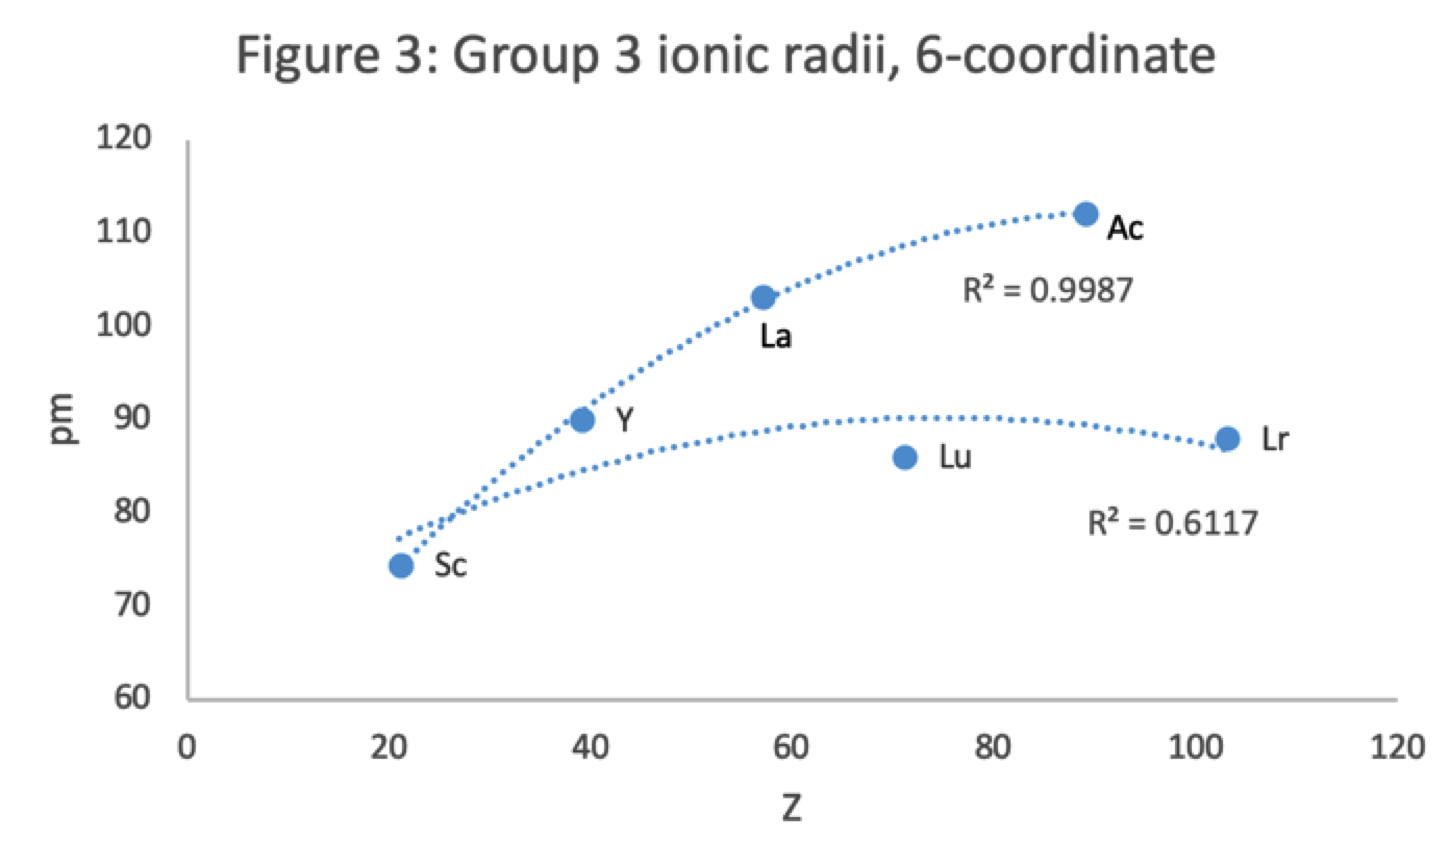
Figure 3 shows that a Z plot of the 6-coordinate ionic radii for the subject elements bifurcates after Y into an -La-Ac tranche (R2 = 0.99) and a -Lu-Lr branch (0.61). The trendline for -La-Ac is smoother.
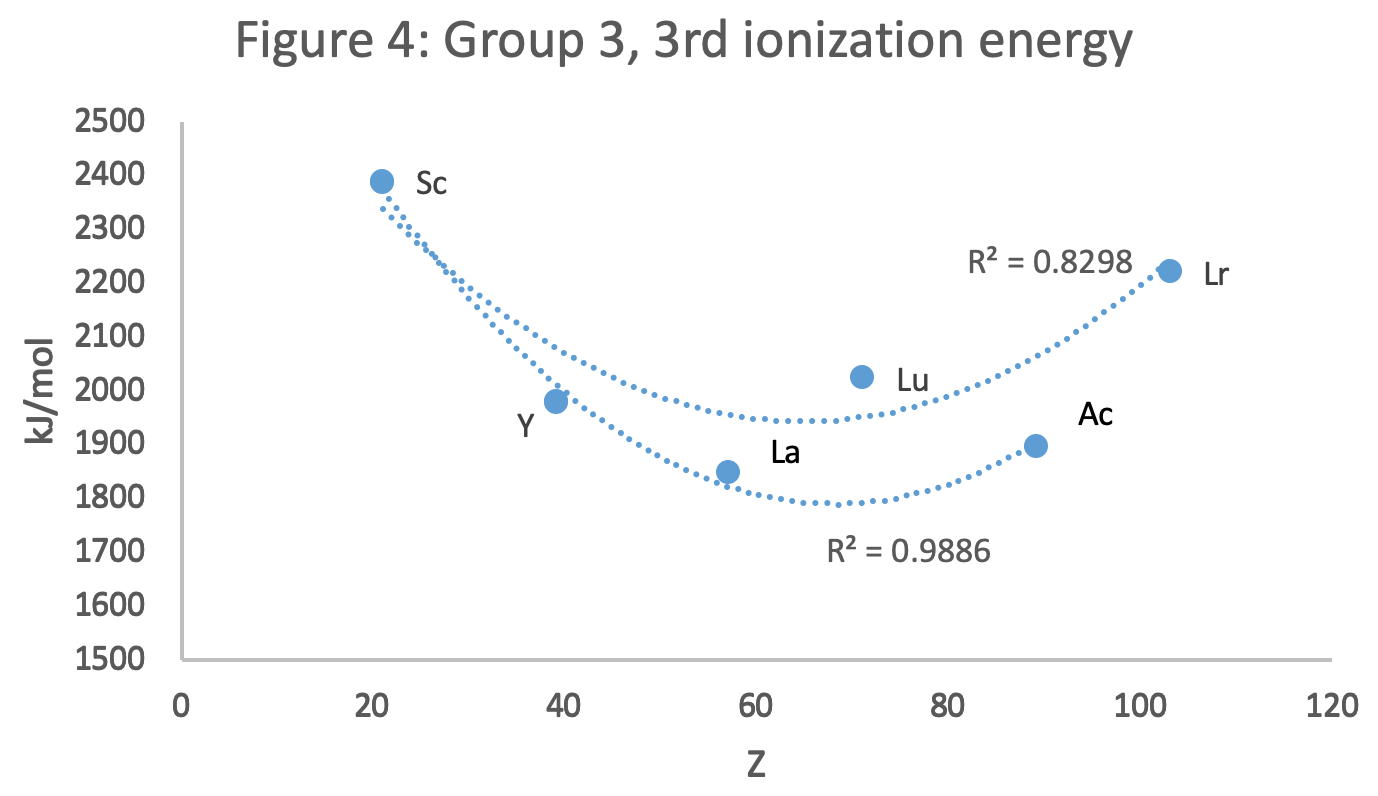
Figure 4 shows a Z plot of 3rd ionisation energy values bifurcating after Y into a -Lu-Lr tranche (R2 = 0.83) and a -La-Ac branch (0.98). The trendline for -La-Ac is smoother.
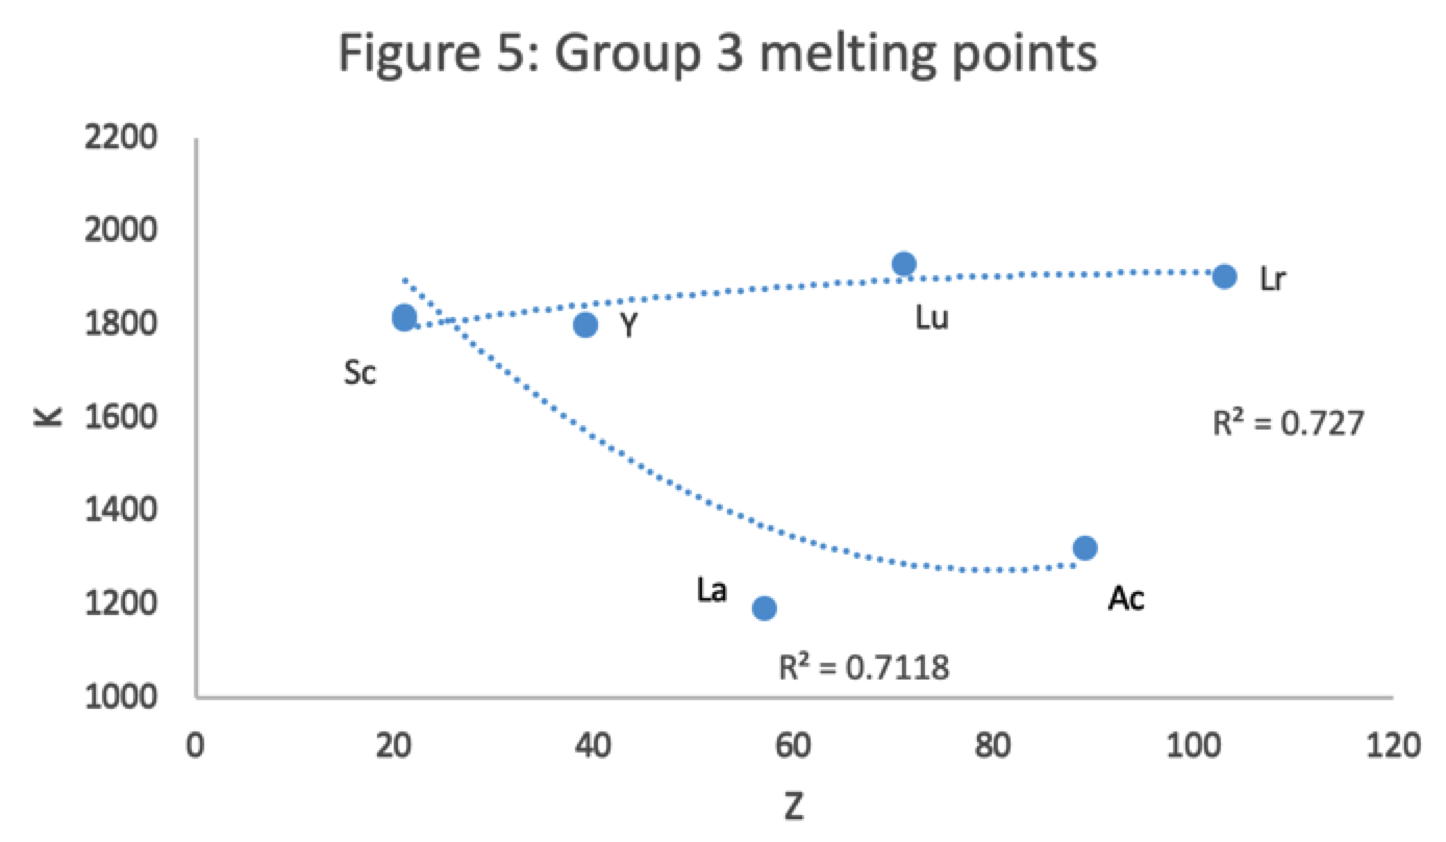
Figure 5 shows that a Z plot of the melting points bifurcates after Y into an -Lu-Lr (R2 = 0.72) tranche and a -La-Ac (0.71) branch. While the fit values for the two options are comparable, -Lu-Lr is preferred since Y and La show a greater departure from trend.
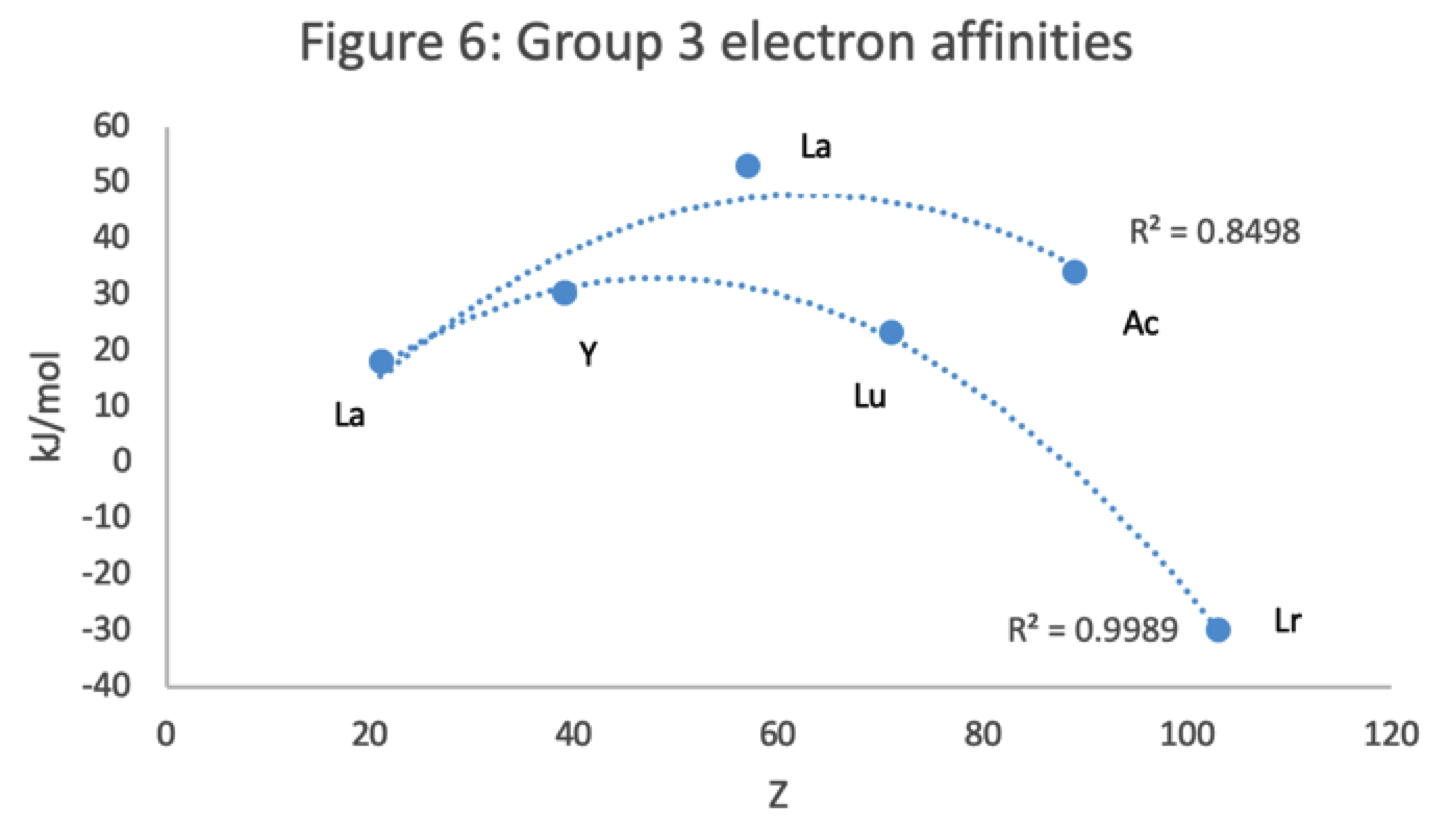
Figure 6 has a Z plot of electron affinity values bifurcating after Y into an -La-Ac tranche (R2 = 0.85) and a -Lu-Lr branch (0.99).[iii] The trendline supports Lu-Lr. The trend-lines by themselves are inconclusive: two show no difference; two support -La-Ac; two support -Lu-Lr.
Upon reviewing the data, René's comment is that: "The net result is that the two options seem inseparable" and he proposes that IUPAC adopt the following periodic table numbering system:
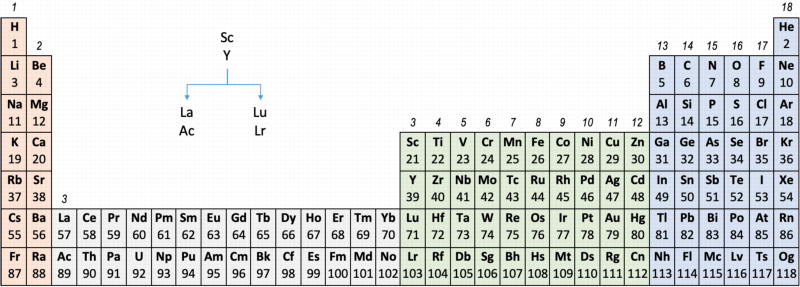
Professor Sir Martyn Poliakoff's [of the Periodic Videos YouTube channel & Nottiningham University] take on this matter:
2006
Group Numbering Systems
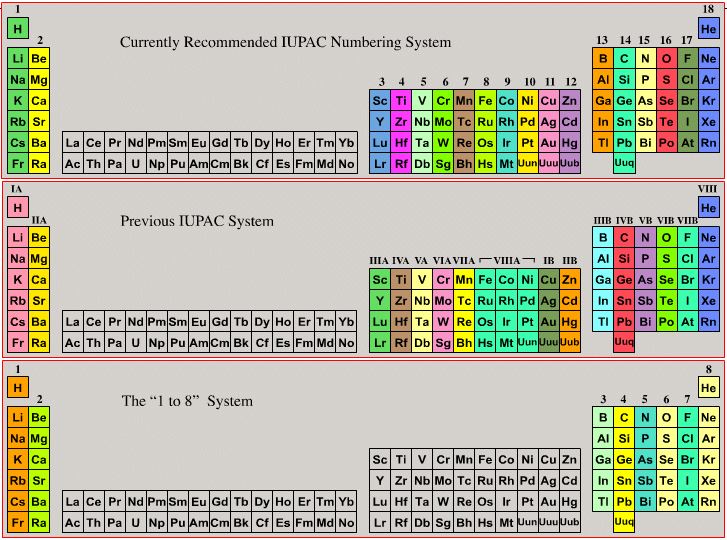
Phase State: Solid, Liquid, Gas at 20°C & 700°C
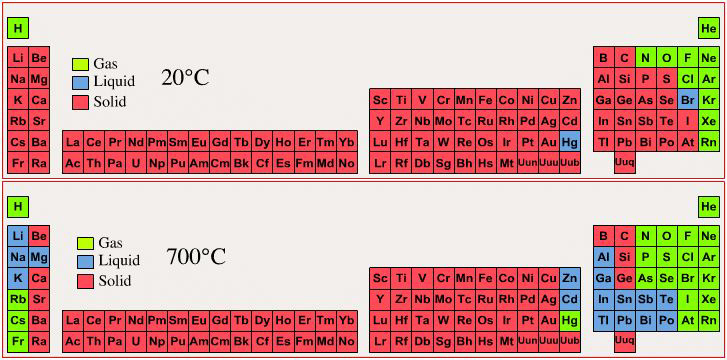
By Mark Leach
1919
Hackh's Periodic Chain
From a Scientific American in March 1919, an article by Ingo W. D. Hackh discussing the classification of the elements.
Included is a periodic chain showing the redox states of the elements:
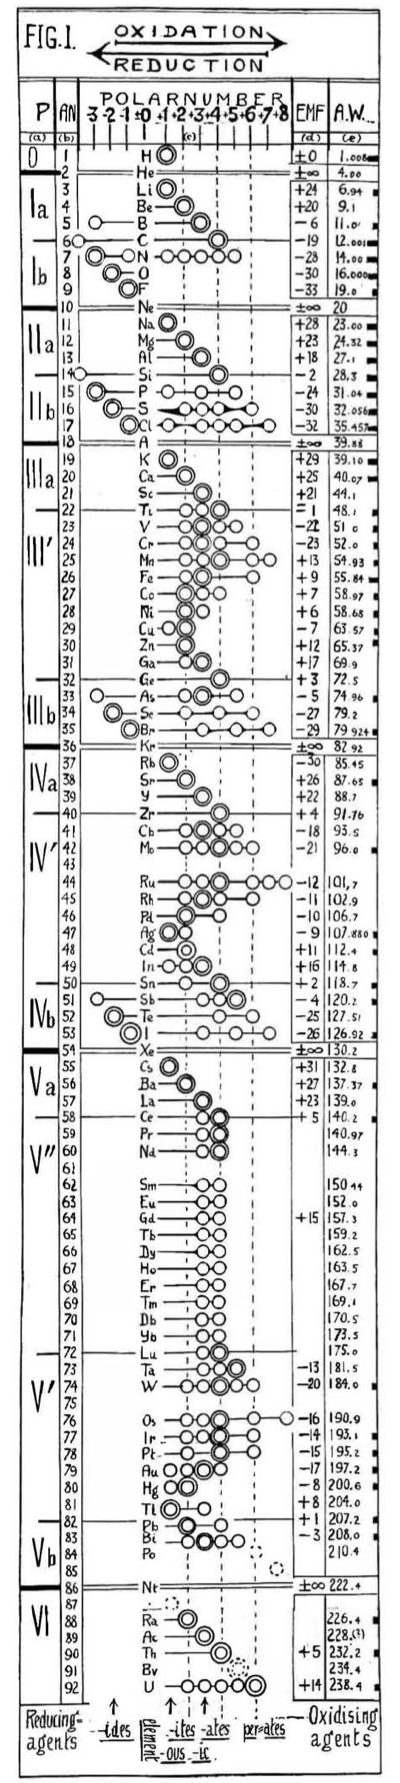
Thanks to Eric Scerri for the tip!
See the website EricScerri.com and Eric's Twitter Feed.
2019
Heritage Periodic Table Display
By Engineered Labs, the Heritage Periodic Table Display.
"Introducing the world's first and only miniature Periodic Table with the actual elements in it.
"Over the last year, we have successfully collected each and every stable element. After considerable R&D, we have finally developed a method of embedding each element in acrylic and we have to say, the result is awesome!
"The Heritage Periodic Table pretty much speaks for itself. The collection looks great on a desk, in your hands, and anywhere else it can be displayed."
1900
History of the Discovery of the Group 18 (erstwhile Group 0) Elements
John Marks has provided a concise history of the discovery of the Group 18 elements and the element name"Nitron/Radon".
Radioactivity was discovered by Becquerel in 1896 and the Curies noted transferred radioactivity rather like the induction of electric or magnetic charge. Radon was discovered in 1900, by Dorn in Halle; Rutherford discovered thoron in 1899; and Debierne discovered actinon in 1903. The time-line is:
- 1868 Lockyer observed the spectrum of helium in the solar corona
- 1894 Ramsay discovers argon
- 1895 Ramsay isolates helium
- 1898 Ramsay discovers krypton, neon & xenon
- 1899 Curie observes an emanation from radium
- 1899 Rutherford observes an emanation from thorium
- 1900 Dorn identifies radon
- 1902 Rutherford & Soddy characterize thoron
- 1903 Rutherford & Soddy isolate radon
- 1903 Debierne observes an emanation from actinium
- 1904 Ramsay names the isotopic emanations exactinio, exradio & exthorio and surmises they are one element, probably an inert gas
- 1908 Professor Sydney Young’s "Stoichiometry" has a periodic table shows niton, Z = 86
- 1909 Ramsay characterizes niton as a group 0 inert gas
- 1910 Cameron's "Radiochemistry" describes the radioactive displacement law
- 1912 The name "niton" accepted by the International Commission for Atomic Weights
- 1913 Soddy expounds theory of isotopes
- 1913 Rydberg's periodic table has Nt (86) for the last inert gas
- 1919 Irving Langmuir's PT has Nt as the last inert gas
- 1922 Niels Bohr’s PT has Nt (86) as the last inert gas
- 1923 GN Lewis’s PT has Nt as the last inert gas
- 1924 CRC’s Handbook of Chemistry and Physics has niton as the last member of Group 0
So niton (from Latin nitens = shining) was noticed by the Curies in 1899 as an emanation from radium. That same year Rutherford noted an identical emanation from thorium, and in 1903 Debierne discovered the same emanation from actinium. All three ('radon', 'thoron' and 'actinon') were identified as an element by Ramsay in 1904 and characterized by him in 1909.
Ramsay named the element niton after its most prominent property viz. that it glowed in the dark.
With the introduction of Soddy's isotopes, it became clear that: thoron was Nt-220, radon was Nt-222 & actinon was Nt-219.
There are natural traces of other isotopes (e.g. Nt-217, Nt-218) from beta disintegration of astatine. So "radon" was just one isotope of niton.
The foregoing history of niton is uncontroversial and the name niton, Nt, for Z = 86 dates at least from Professor Young´s textbook of stoichiometry in 1908.
In 1912, the name 'niton' was adopted by the International Commission for Atomic weights. Rydberg's PT of 1913 has Nt as the last inert gas, as does Irving Langmuir's PT of 1919, Niels Bohr's PT of 1922, GN Lewis's PT of 1923 and even the CRC's Handbook of Chemistry and Physics in 1924.
John Marks concludes:
"Niton, Nt, for Z = 86, was thus established by its discoverers and accepted by the chemistry (and physics) establishment. Radon, Rn, is an error perpetuated by IUPAC [amongst its many sins].
"Radon is an isotope. We do not refer to hydrogen as 'protium', so why are we referring to niton as 'radon'?"
2021
History [of the] Elements and Periodic Table
From the Royal Society of Chemistry (RSC) an interactive Elements and Perioid Table History web page:

Thanks to Eric Scerri for the tip!
See the website EricScerri.com and Eric's Twitter Feed.
2023
Holistic View of Metals & Nonmetals: Exploded View
From Organising the metals and nonmetals: An update by René Vernon from the chemrxiv preprint server.
Rene writes:
Abstract: This paper updates my 2020 article, Organising the metals and nonmetals in which I advocated for parsing the periodic table into four kinds of metals and four of nonmetals. This framework is retained and updated, and augmented with some additional chemistry-related and philosophical observations.
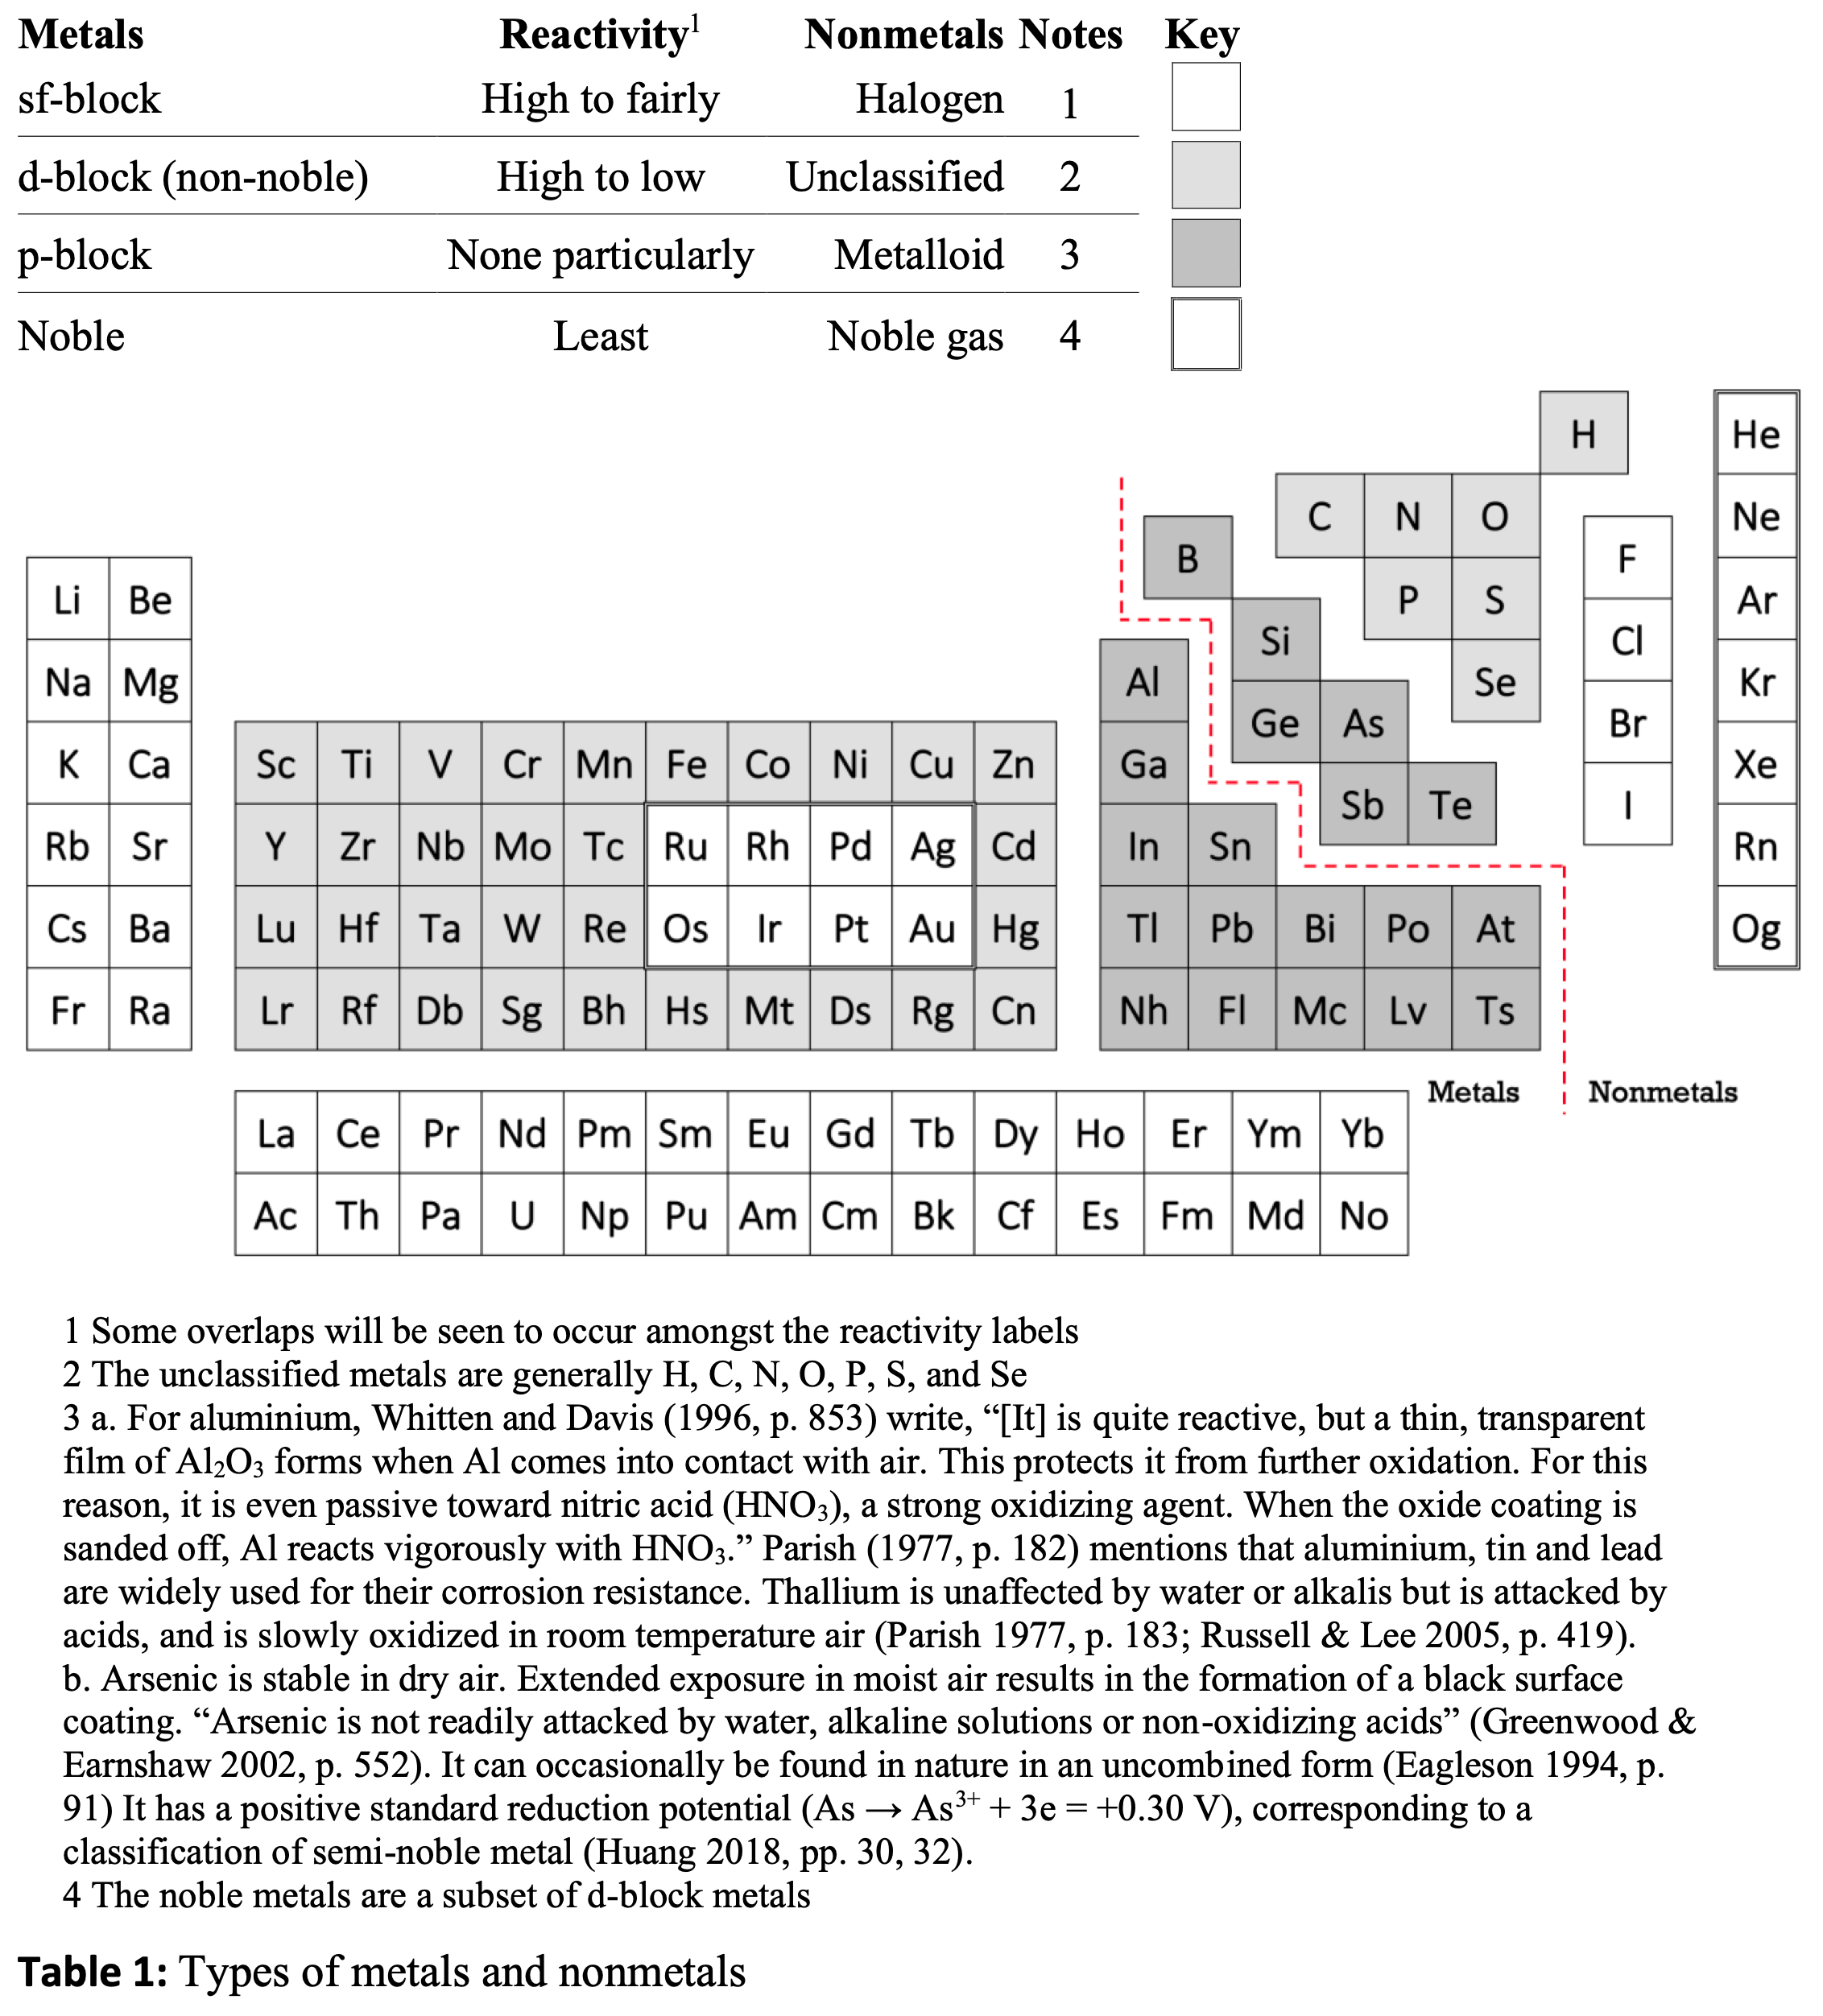
1993
Huheey's Version of The Madelung Rule (For Orbital Filling)
Huheey, J.E., Keiter, E.A., Keiter, R.L.: Inorganic Chemistry: Principles of Structure and Reactivity. 4th edn. HarperCollins College Publishers (1993), p. 22
René Vernon comments: "A peculiar depiction of the Madelung Rule order of filling diagram."
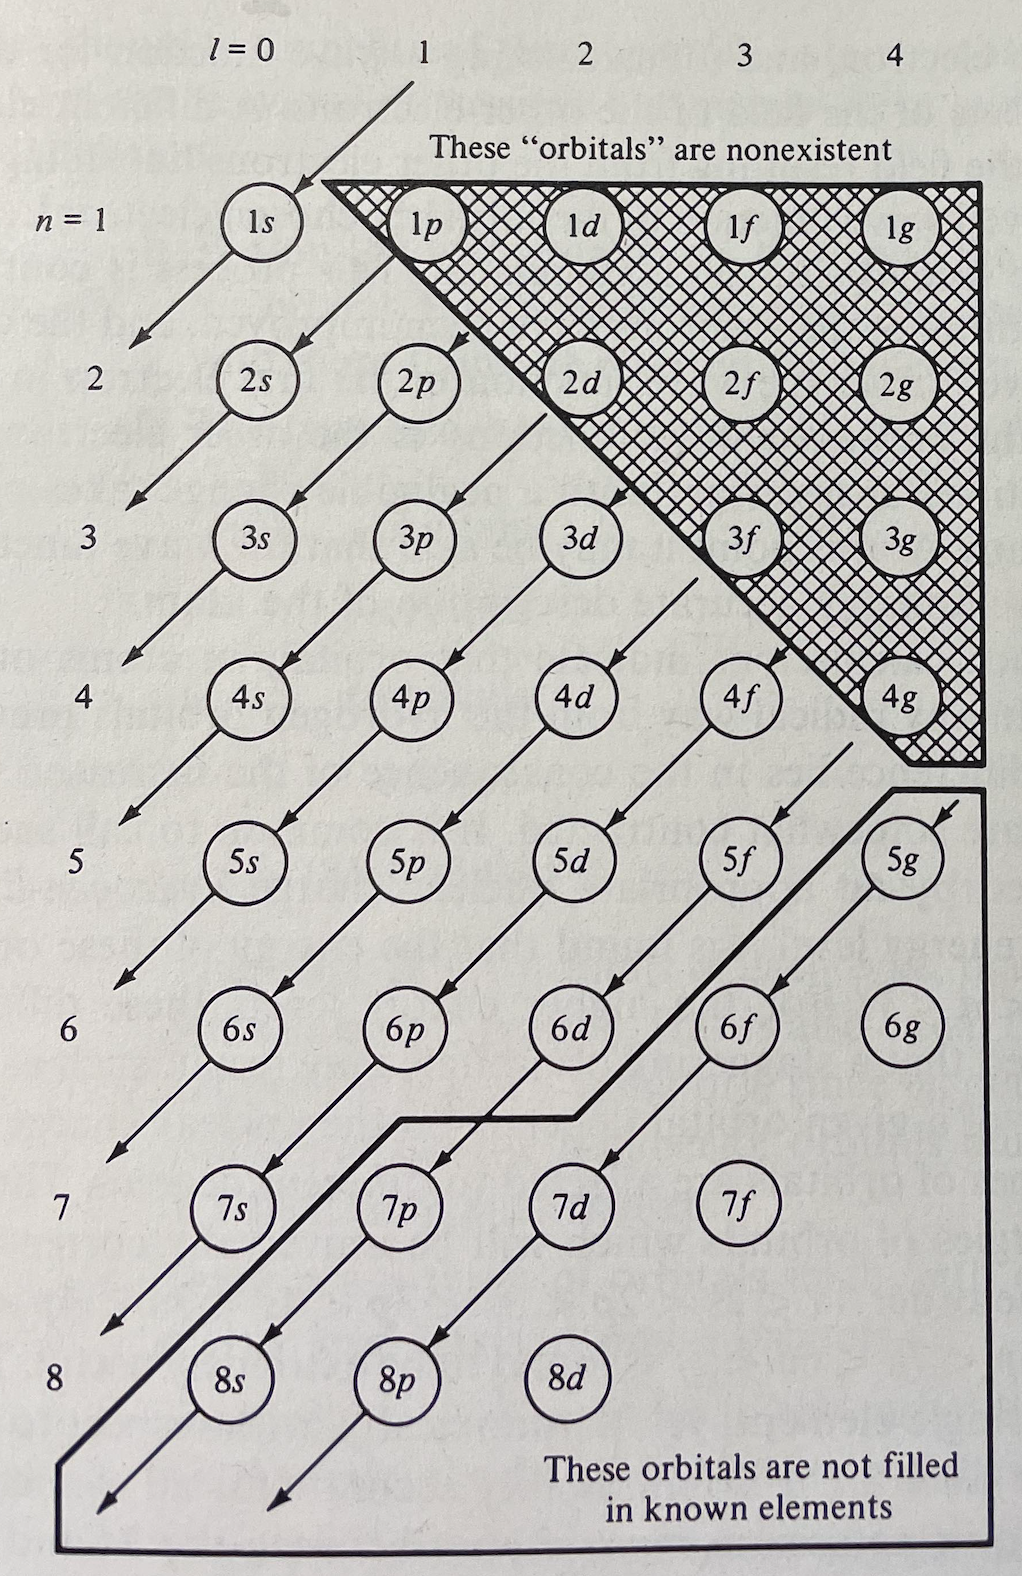
2004
Inorganic Chemist's Periodic Table
Every element has a specialist, somewhere, for whom it is the most important element.
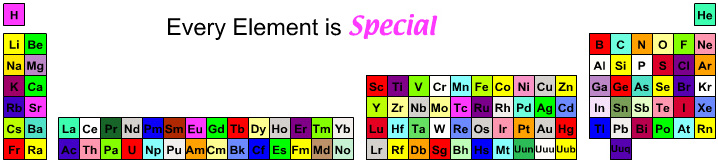
By Mark Leach
2002
Inorganic Chemist's Periodic Table
An Inorganic Chemist's Periodic Table by Geoff Rayner-Canham, here. This PT was used on the cover of Descriptive Inorganic Chemistry, Third Edition.
The major links in the Periodic Table are those of the Groups and Periods. There are other patterns:
- The (n) and (n+10) groups linkages (grey)
- The diagonal relationships (green)
- The "knights move" relationships (tan)
- The aluminum-iron link (red)
- The lanthanoid and actinoid relationships (grey)
- The "combo" elements (violet)
- The "pseudo" elements (blue)
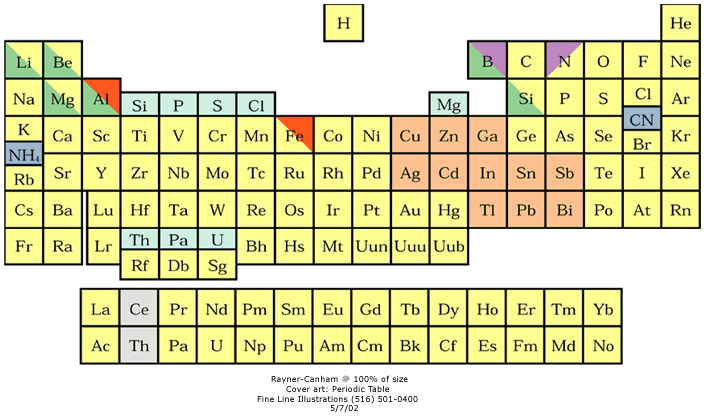
2008
Instruments, Periodic Table of
A periodic table of various scientific instruments and techniques from Thermo Scientific and C&EN.
Download, zoom in & explore the interesting pdf file:
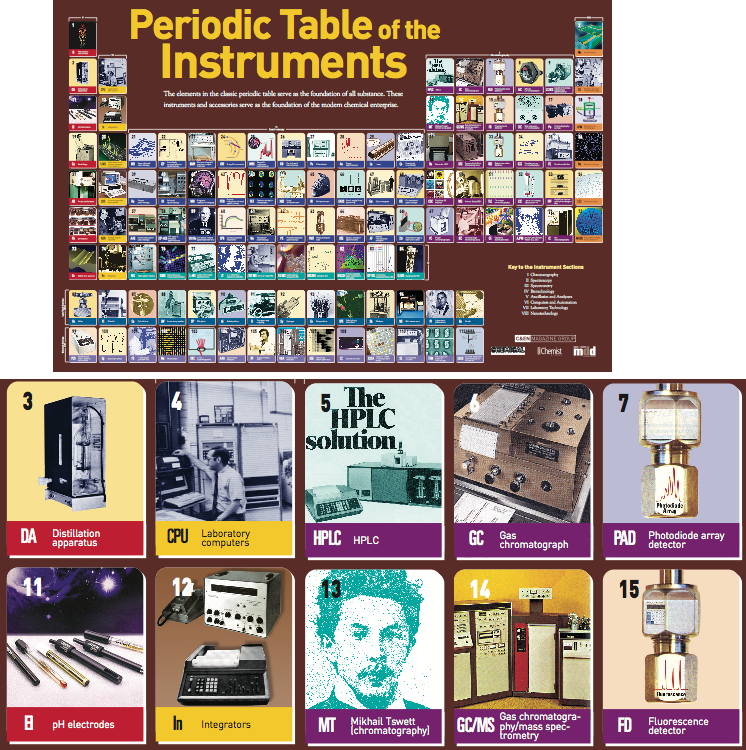
2010
Ionic Radii Database Periodic Table
By the Atomistic Simulation Group in the Materials Department of Imperial College, a database of ionic radii:

2005
Ionic Radii Periodic Table
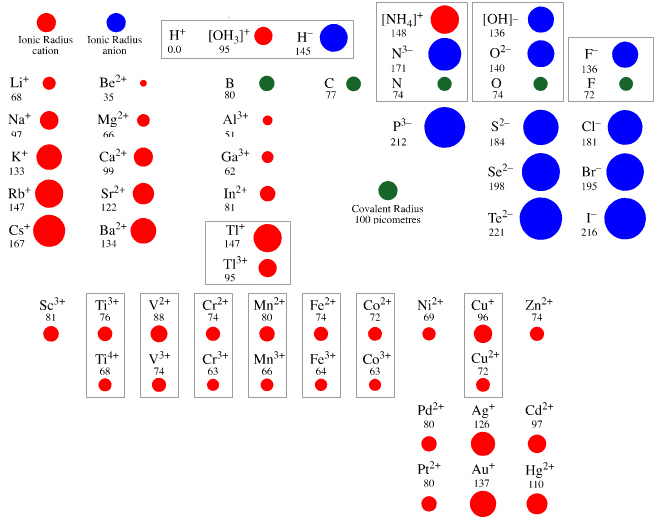
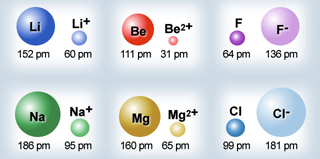
2012
iPhone, Periodic Table of
An article in Scientific American Digging for Rare Earths: The Mines Where iPhones Are Born.
"About 60 miles southwest of Las Vegas, in a mine some 500 feet deep, the beginnings of an iPhone come to life. But the sleek, shiny iPhone is far, far removed from the rocks pulled out of this giant hole, which looks like a deep crater on the moon. Inside the rocks from this mine are rare-earth minerals, crucial ingredients for iPhones, as well as wind turbines, hybrid cars, and night-vision goggles. Minerals such as neodymium are used in magnets that make speakers vibrate to create sound. Europium is a phosphor that creates a bright red on an iPhone screen. Cerium gets put into a solvent that workers use to polish devices as they move along the assembly line, etc.":
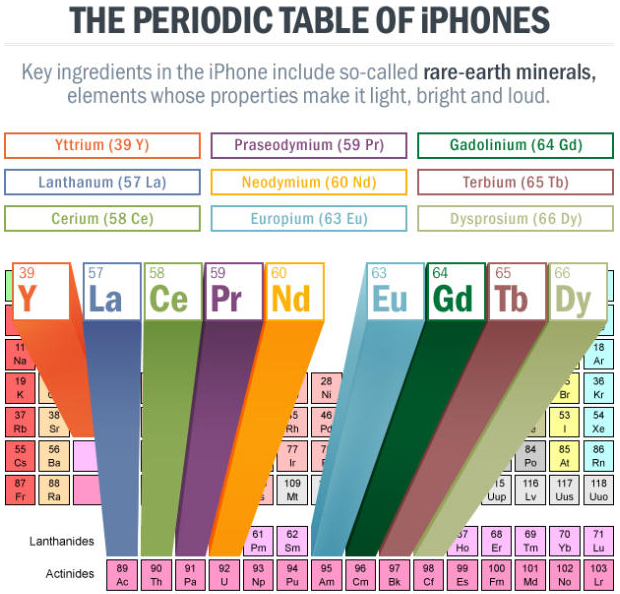
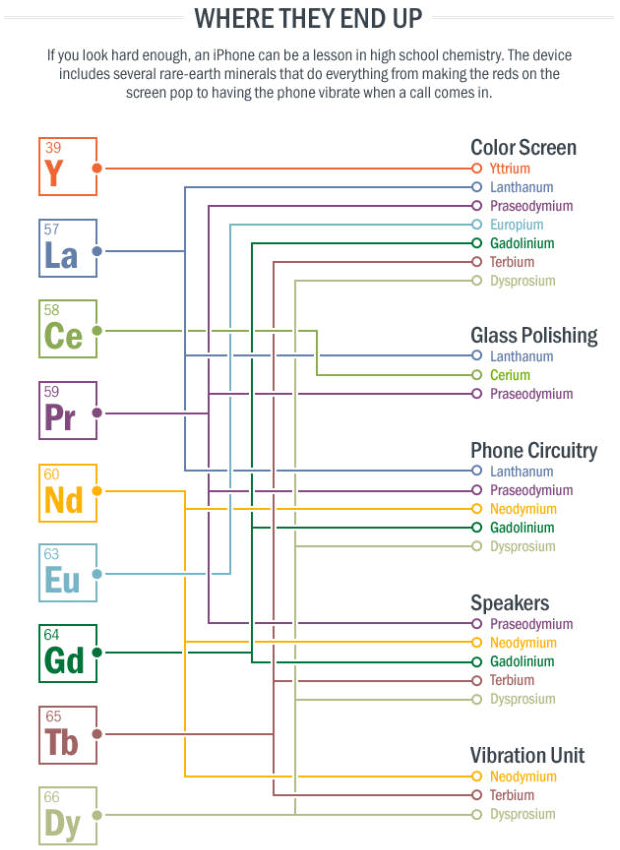
Thanks to Eric Scerri for the tip!
See the website EricScerri.com and Eric's Twitter Feed.
2014
IQS Periodic Tables
By Jordi Cuadros, a set of three pairs of periodic tables in Catalan, English & Spanish pointing out the differences between PT representations of atoms and PT representations of the material substances:
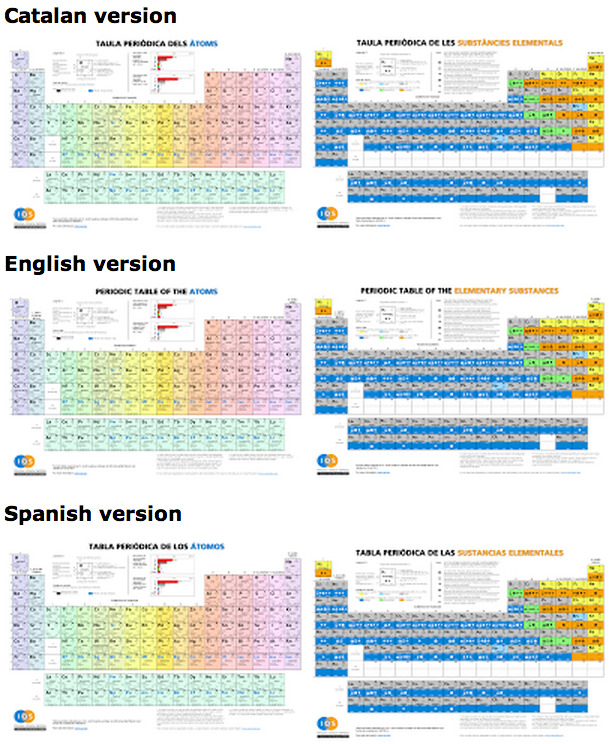
1969
Island of Stability
From Wikipedia: The island of stability in nuclear physics describes a set of as-yet undiscovered isotopes of transuranium elements which are theorized to be much more stable than others. The possibility was proposed by Glenn T. Seaborg in the late 1960s: Prospectd for Further Considerable Extension of the Periodic Table, J.Chem.Educ., 46, 626-633 (1969) and reprinted in Modern Alchemy: Selected Papers of Glenn T. Seaborg (1994).
The hypothesis is that the atomic nucleus is built up in "shells" in a manner similar to the structure of the much larger electron shells in atoms. In both cases, shells are just groups of quantum energy levels that are relatively close to each other.
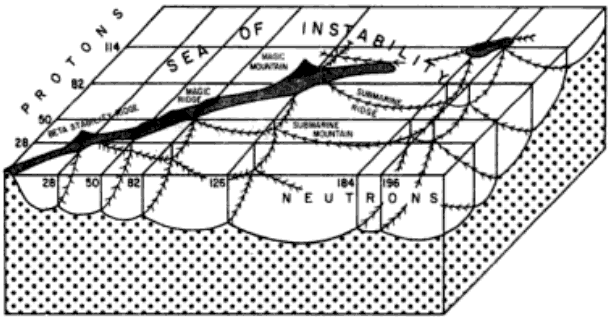
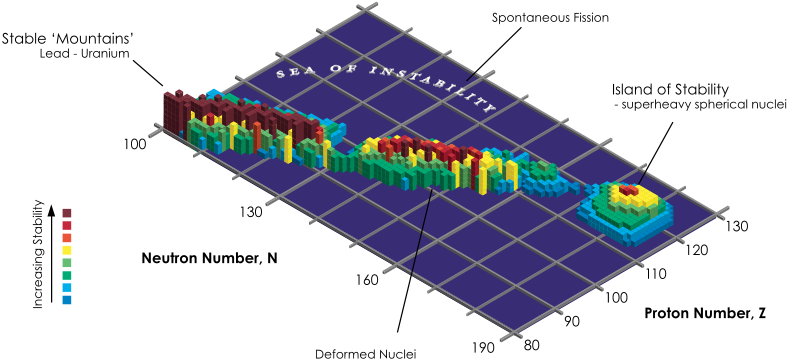
2018
IUPAC Periodic Table of The Elements
The 1 Dec 2018 IUPAC (International Union of Pure and Applied Chemistry) Periodic Table of The Elements. For updates to this table click here.
By virtue of its work in relation with the chemical elements, IUPAC can dispense a periodic table that is up-to-date. IUPAC involvement covers various aspects of the table and data that it unveils, and several reports and recommendations, some quite recent, attest of that input. In particular, IUPAC is directly involved in the following:
- establishing the criteria for a new element discovery
- defining the structure of a temporary name and symbol
- assessing claims resulting in the validation and assignation of an element discovery
- coordinating the naming of a new element, involving the research laboratory and allowing for public comments
- setting up precise rules for how to name a new element
- defining Group 1-18 and collective names
- determining which elements belong to Group 3
- regularly reviewing standard atomic weights
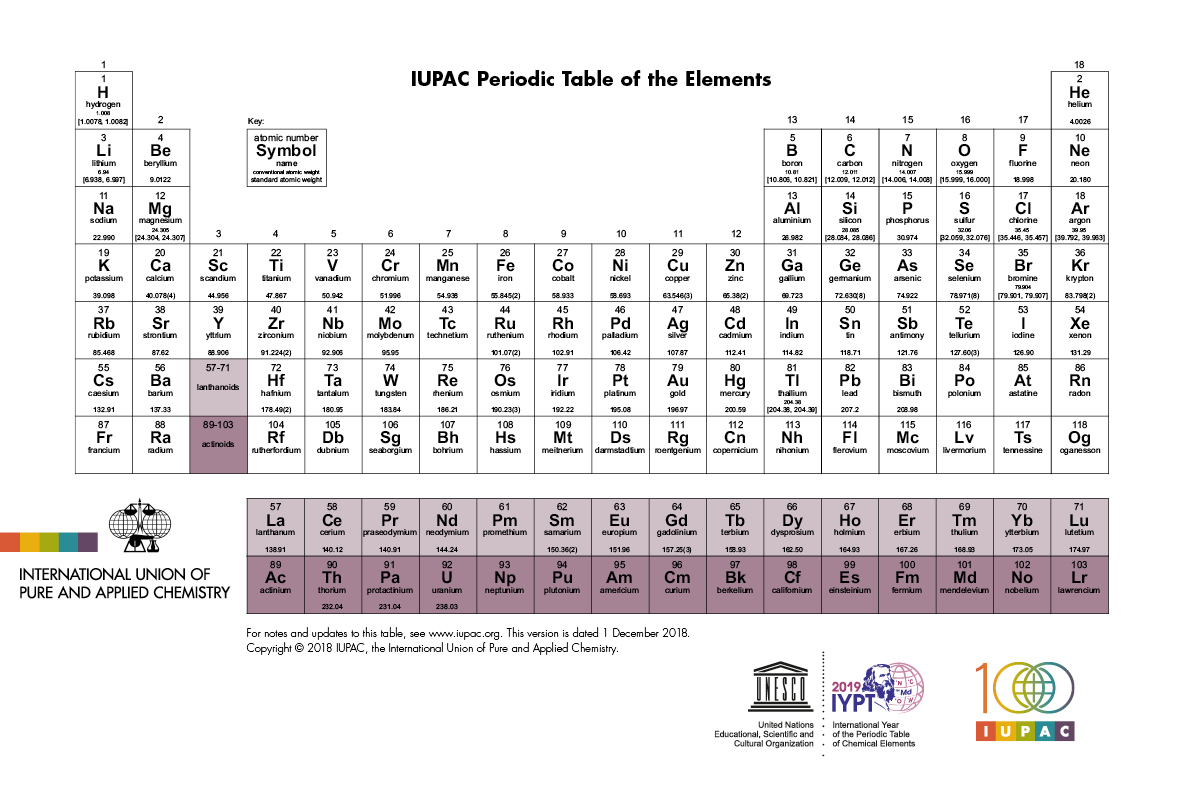
2012
IUPAC Periodic Table of the Isotopes
The Periodic Table of the Isotopes, published by International Union of Pure and Applied Chemistry (IUPAC), is now available from the Commission on Isotopic Abundances and Atomic Weights, which is a commission under the Inorganic Division (Division II) of IUPAC.
The text identifies four types of atom, with respect to isotopes:
- Element has two or more isotopes that are used to determine its standard atomic weight. The isotopic abundances and atomic weights vary in natural terrestrial substances. These variations are well known, and the standard atomic weight is given as lower and upper bounds within square brackets, [ ].
- Element has two or more isotopes that are used to determine its standard atomic weight. The isotopic abundances and atomic weights vary in natural terrestrial substances, but upper and lower bounds of the standard atomic weight have not been assigned by IUPAC or the variations may be too small to affect the standard atomic weight value. Thus, the standard atomic weight is given as a single value with an uncertainty that includes both measurement uncertainty and uncertainty due to variations in isotopic abundances.
- Element has only one isotope that is used to determine its standard atomic weight. Thus, the standard atomic weight is
invariant and is given as a single value with an IUPAC evaluated measurement uncertainty.
- Element has no standard atomic weight because all of its isotopes are radioactive and, in natural terrestrial substances, no isotope occurs with a characteristic isotopic abundance from which a standard atomic weight can be determined.
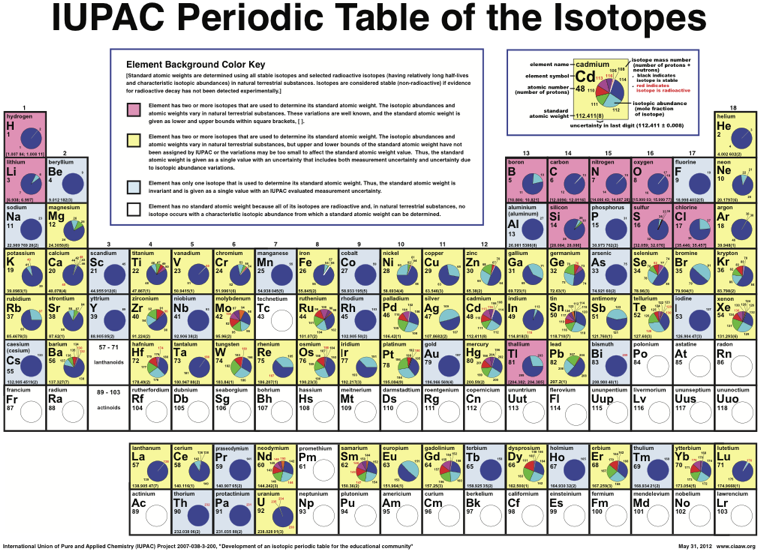
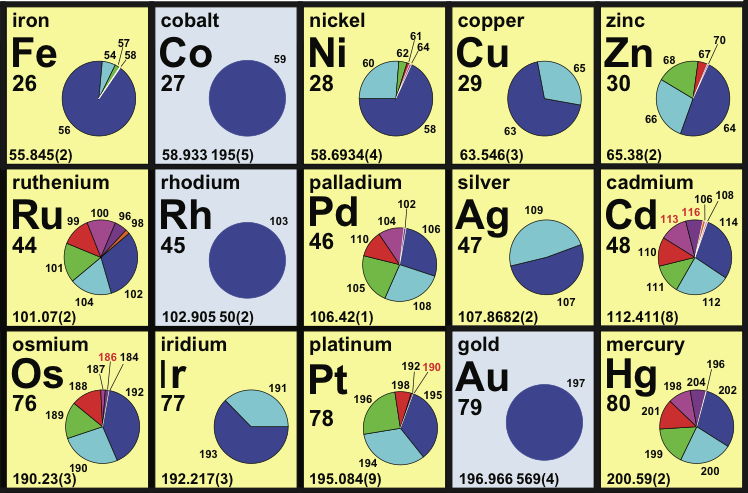
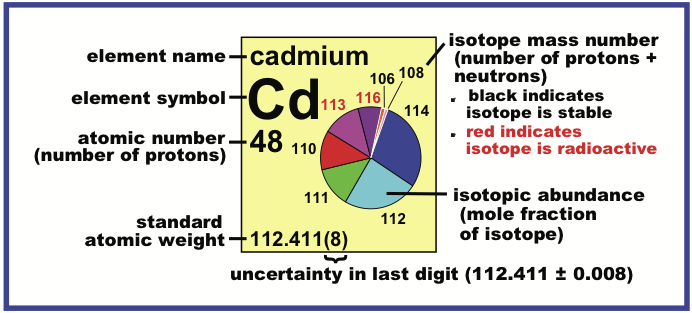
2012
JR's Chemistry Set
For the iPhone and iPad, JR's Chemistry Set makes chemistry interesting and fun to learn. Based upon the innovative Rota Period, it is a handy and powerful reference tool for chemistry enthusiasts and practitioners at all ages and all levels.
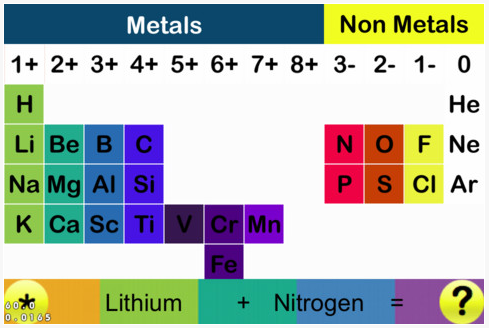
2019
Leach's Empirical Periodic Table
The common/conventional/standard 'medium form' periodic table is based on the 1945 Seaborg formulation, and it is interesting to explore where this formulation – and its 1939 predecessor – come from. (Interestingly, the Werner formulation of 1905 is not cited as a source and there are no other similar formulations in the (this) Periodic Table Database.)
However, it is possible to get to the common/conventional/standard periodic table directly from two readily available data-sets: (1) first ionisation energy of the gas phase atoms, and (2) atomic radius.
The procedure involved plotting the data, rotating 90°, squeezing vertically and smoothing. The points need a little tidying up, and then they can be mapped directly onto the Seaborg formulation periodic table.
The only element which does no obviously 'line-up' with the periodic table is hydrogen, but many modern periodic tables have H floating as it is not obvious if it should be considered to be a Group 1 alkali metal or a Group 17 halogen.
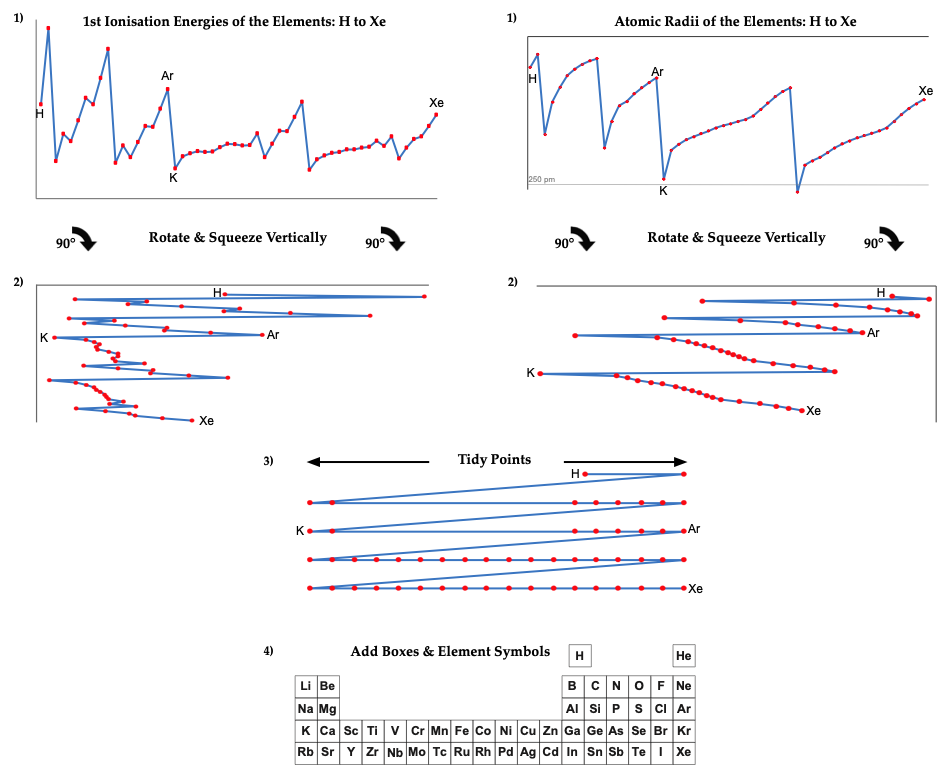
Note:
There are advantages and disadvantages to each data set. The 1st ionisation energy data from NIST is known with up to seven significant figures of precision, but the data jumps about at times due to the presence of the s & p-orbitals, which appears to make the data a little noisy. (Actually, this 'noise' is embedded information about the electronic structure of the atoms.) The atomic radius gives smoother data, but as gas phase atoms do not have hard edges calculated (Clementi 1967) rather than experimental values, must be used.
1964
Lee's Quantum Number Periodic Table
In his book Concise Inorganic Chemistry (pp. 22, 5th Ed, Blackwell Science, 1996), J.D. Lee gives a representation of "Quantum numbers, the permissible number of electrons & the shape of the periodic table".
Note: JD Lee taught Inorganic Chemistry to the curator of this database of periodic tables while at university:
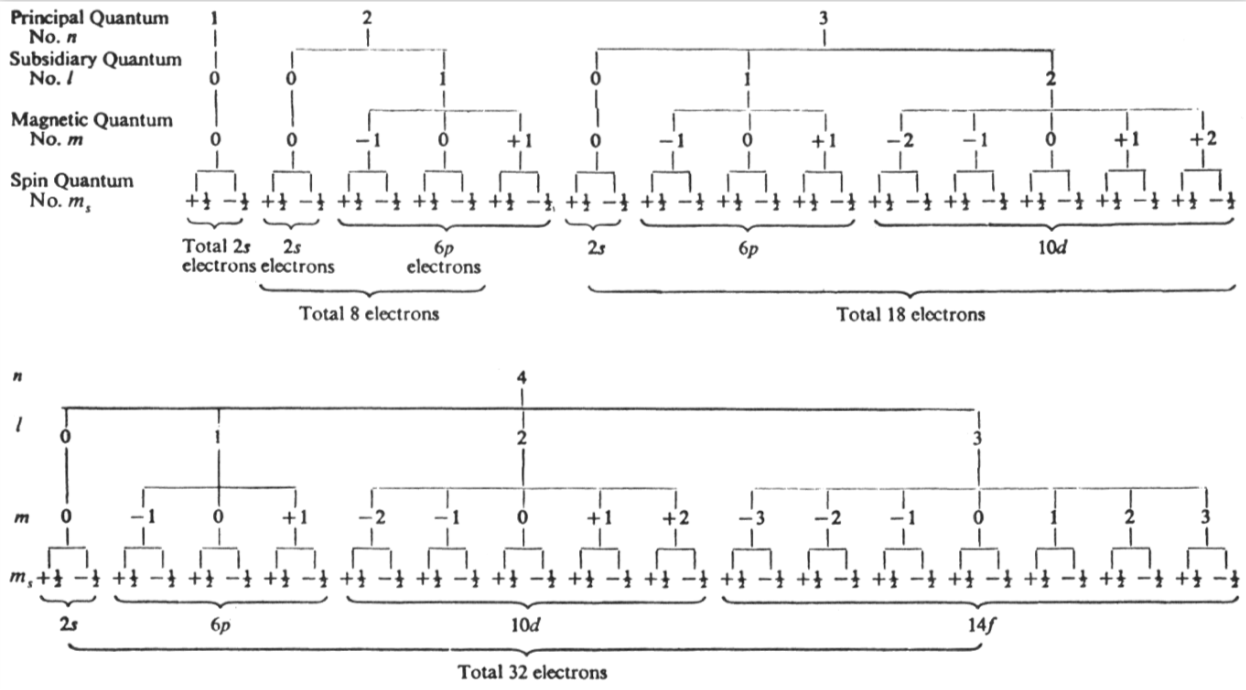
2010
Lewis Octet Periodic Table
A periodic table showing the outer shell of valence electrons associated with Lewis atoms:
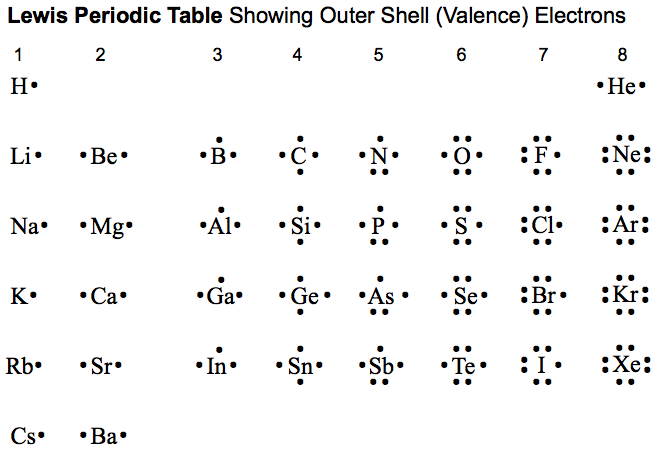
By Mark Leach
1963
Life Science Library Periodic Table
An periodic table in the Life Science Library book, Matter, by Ralph E. Lapp (1963).
The PT is arranged vertically instead of having the usual horizontal format. It is also probably the first book to show pictures of nearly every element, arranged by family:
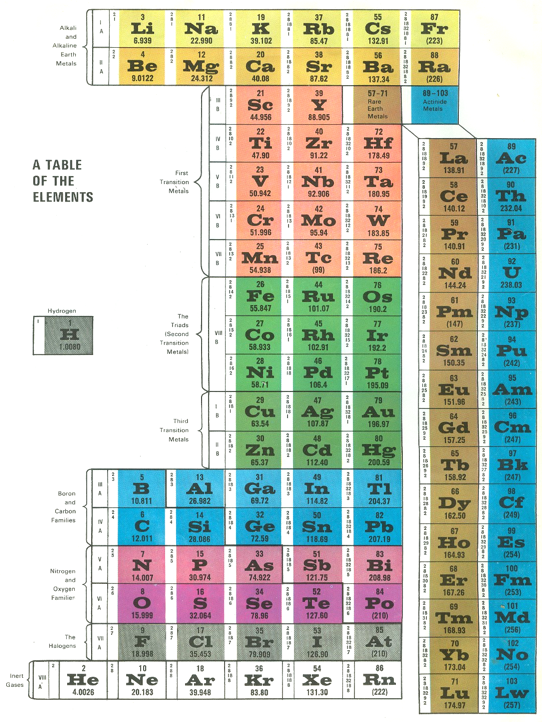
![]()
1995
Periodic Table Live!
A good site with lots of infomation, pictures & video clips, here:
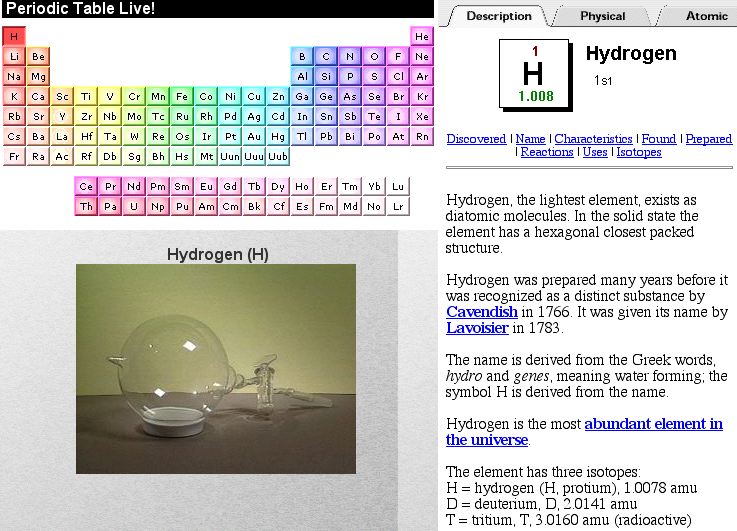
1787
Méthode de Nomeclature Chimique
By Louis Bernard Guyton de Morveau (1737-1816), Antoine Laurent Lavoisier (1743-1794) , Claude-Louis Berthollet (1748-1822) & Antoine-François de Fourcroy (1755-1809) a book: Méthode de Nomeclature Chimique.
The complete scanned book is available. (Click the 'page view' button, or here.)
The book lists the several hundred chemicals known at the time, including chemical elements, and it discusses the nomenclature (naming). Although not a periodic table as such, the information contained in this book was state of the art for 1787.
Click on an image below to enlarge.
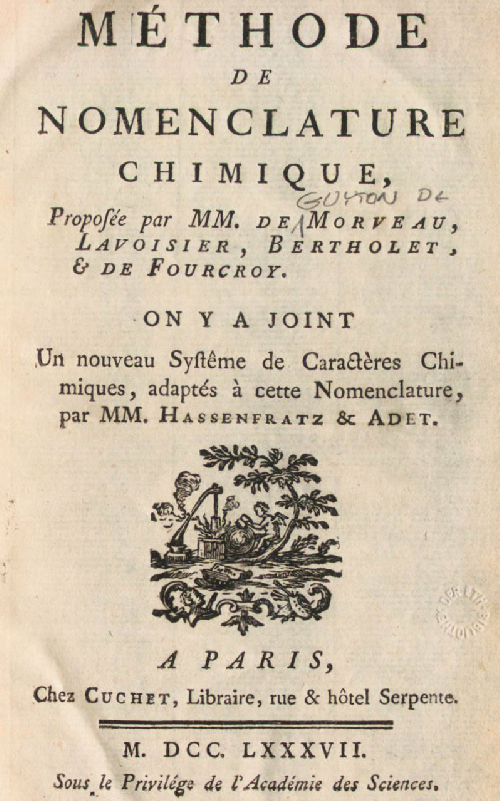

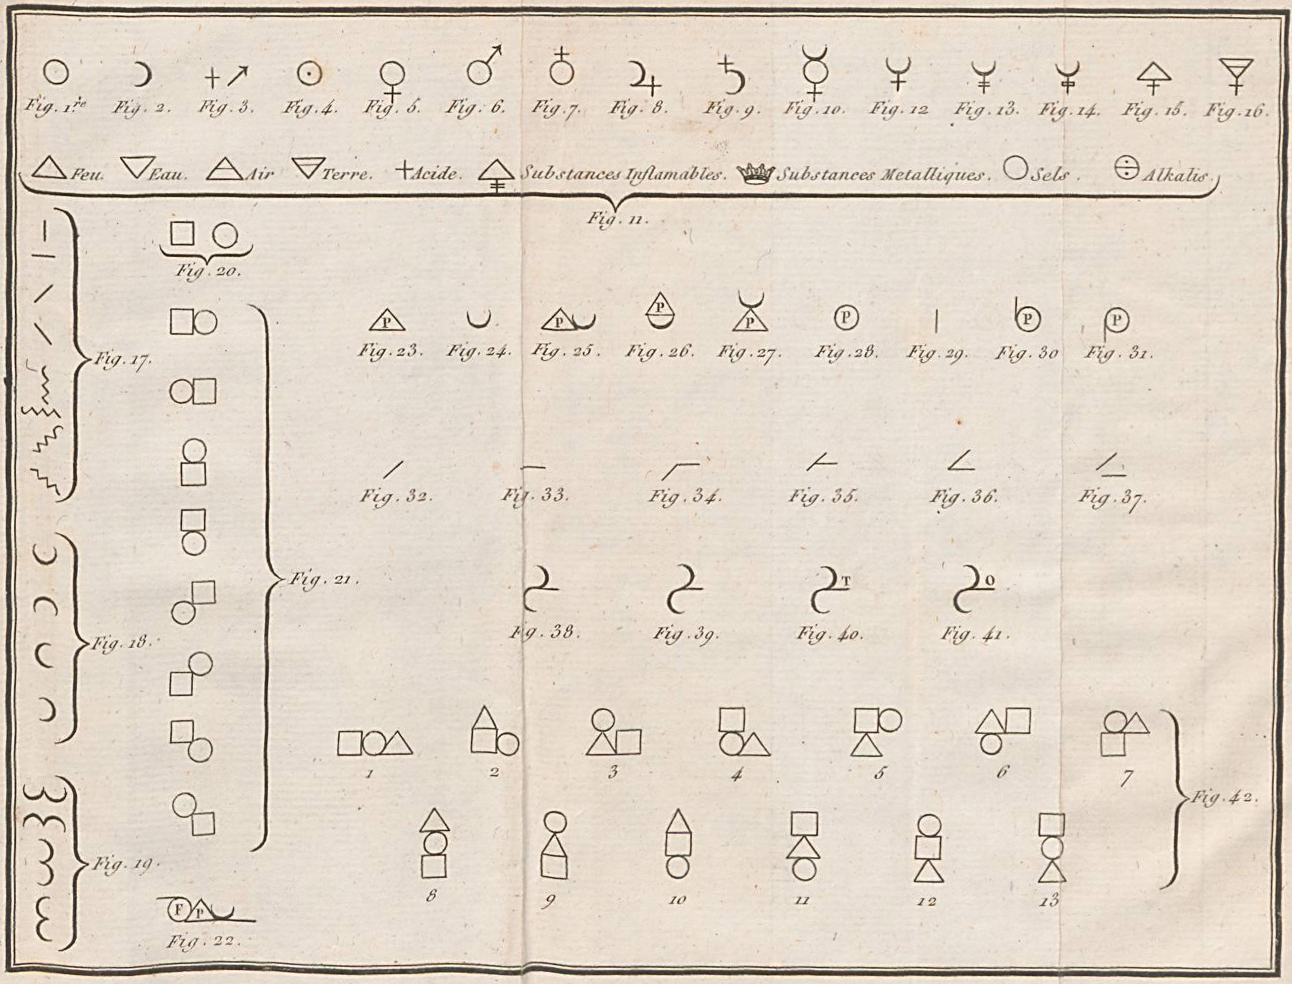
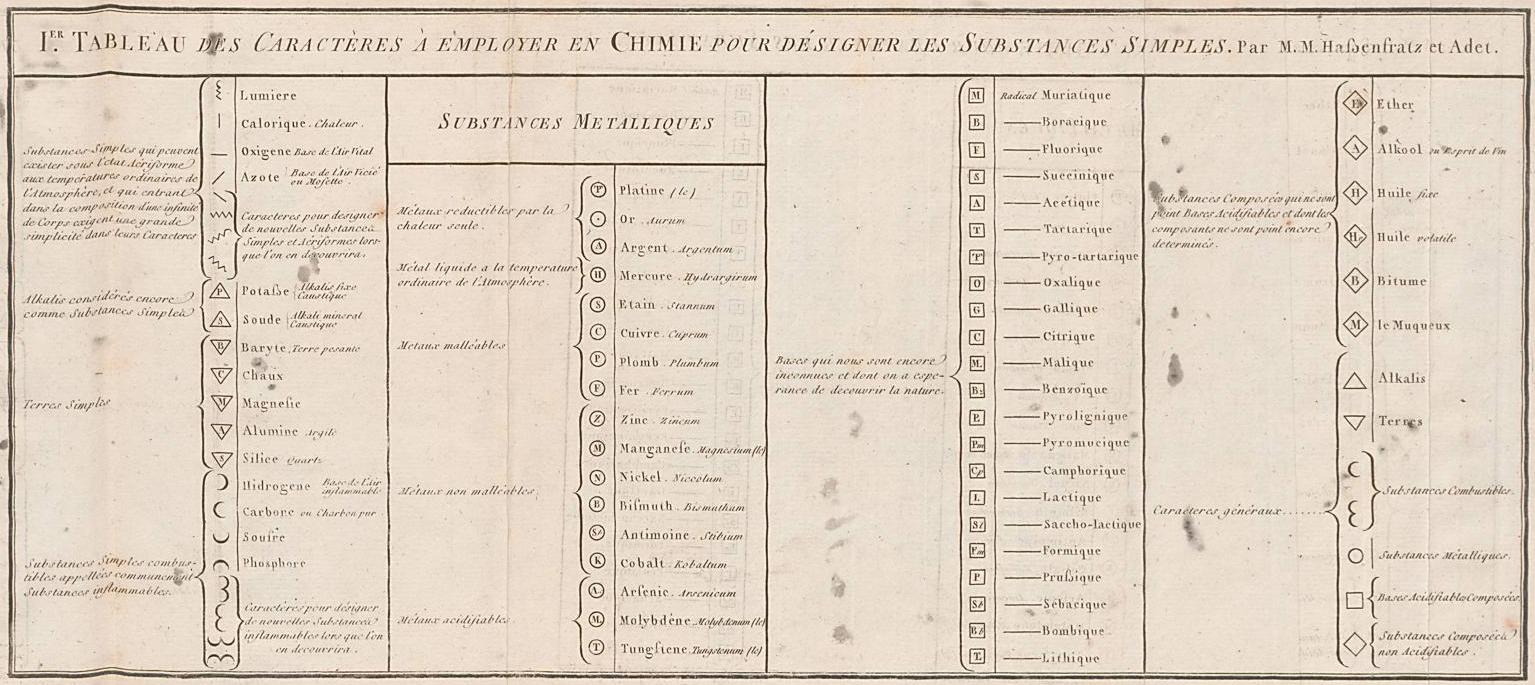
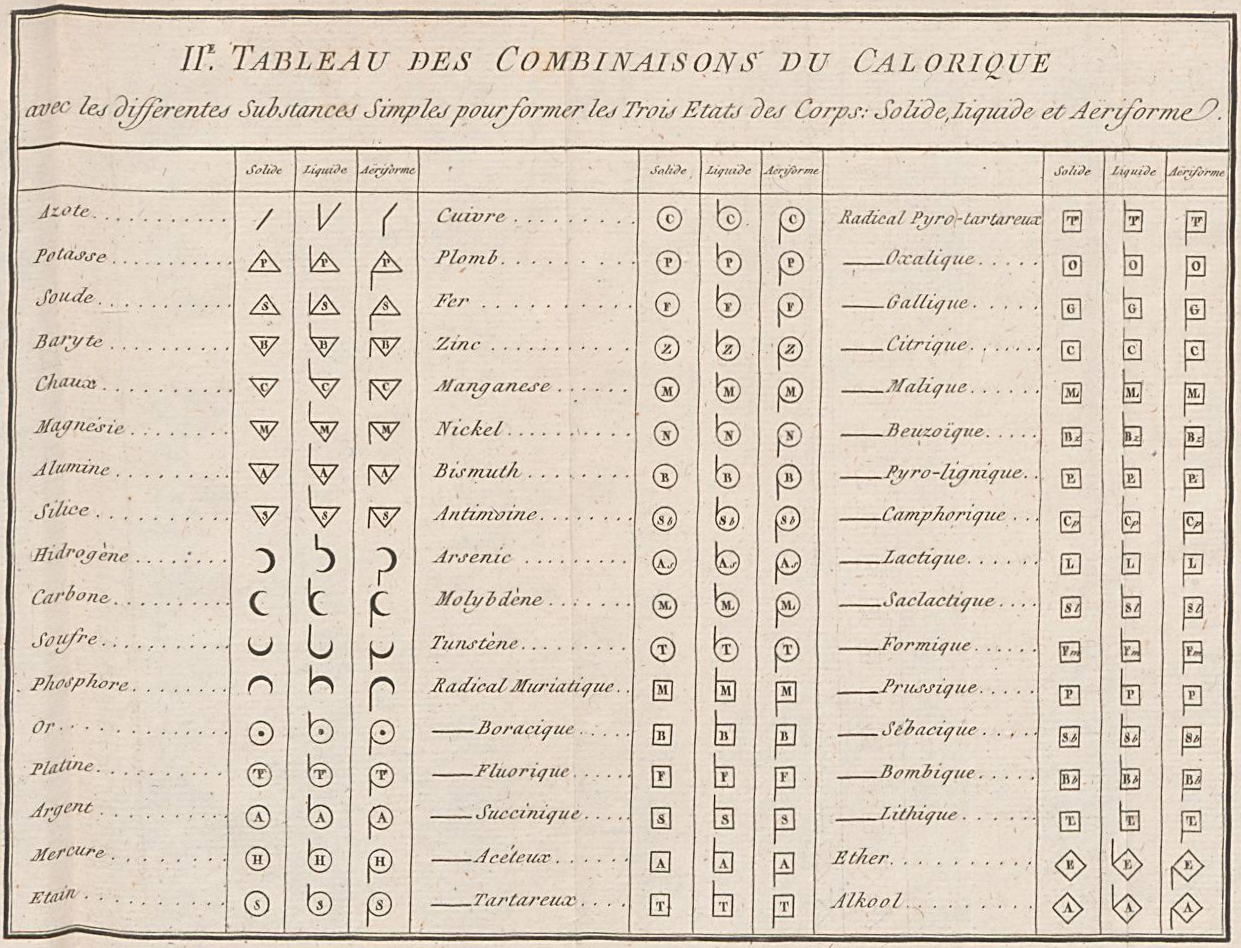
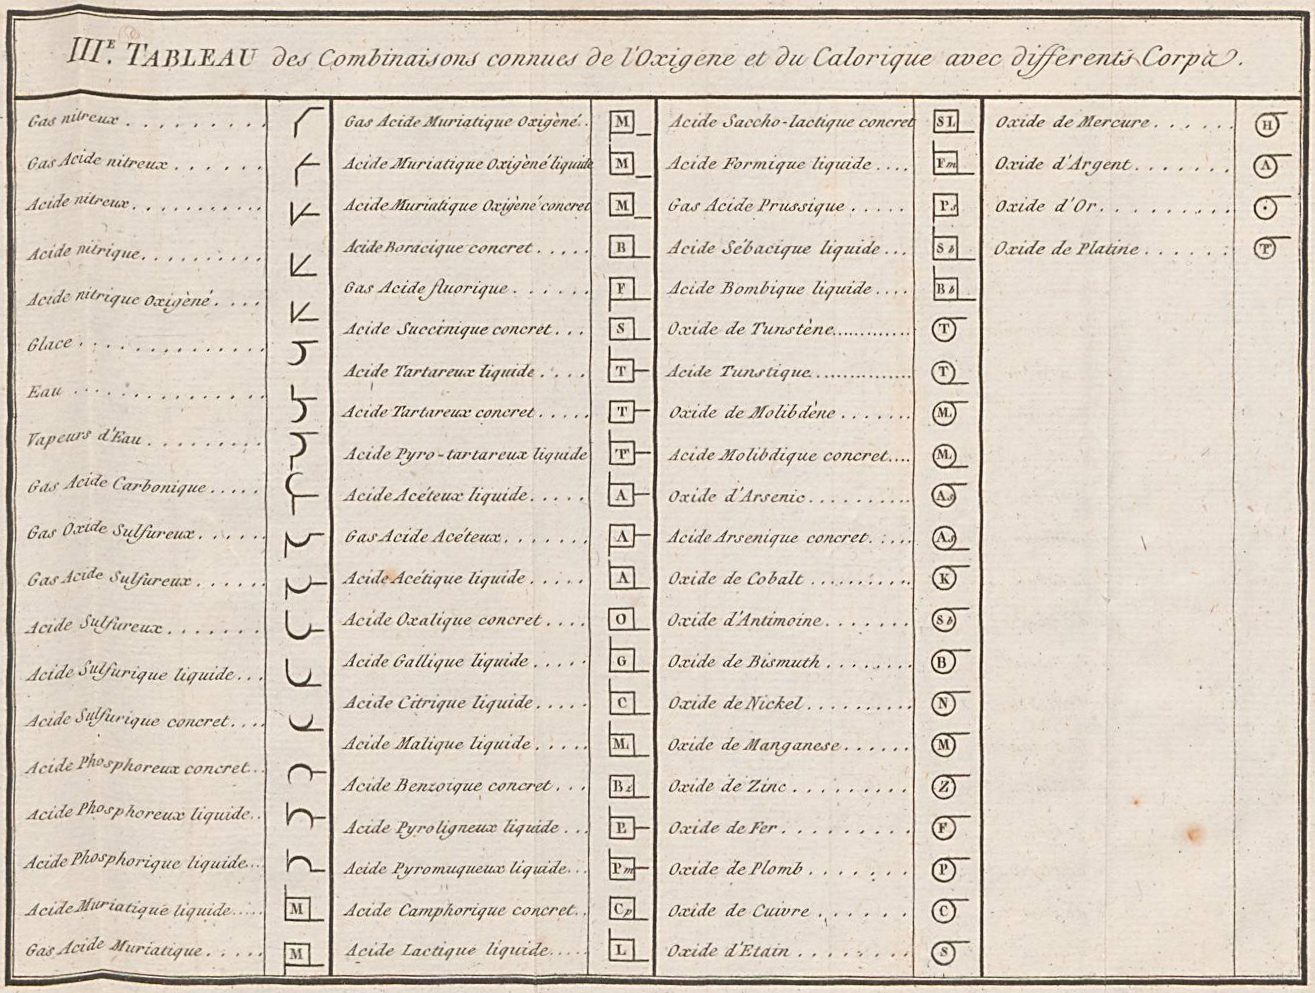
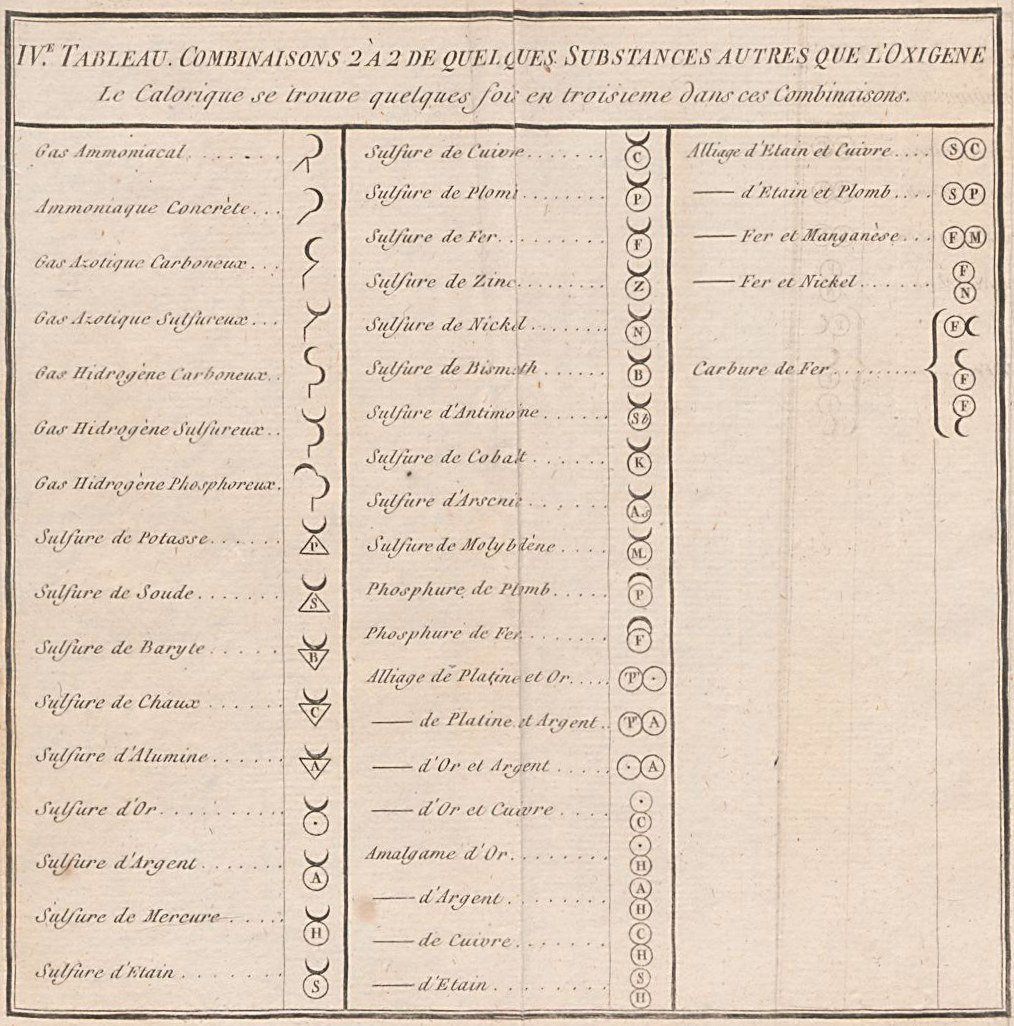
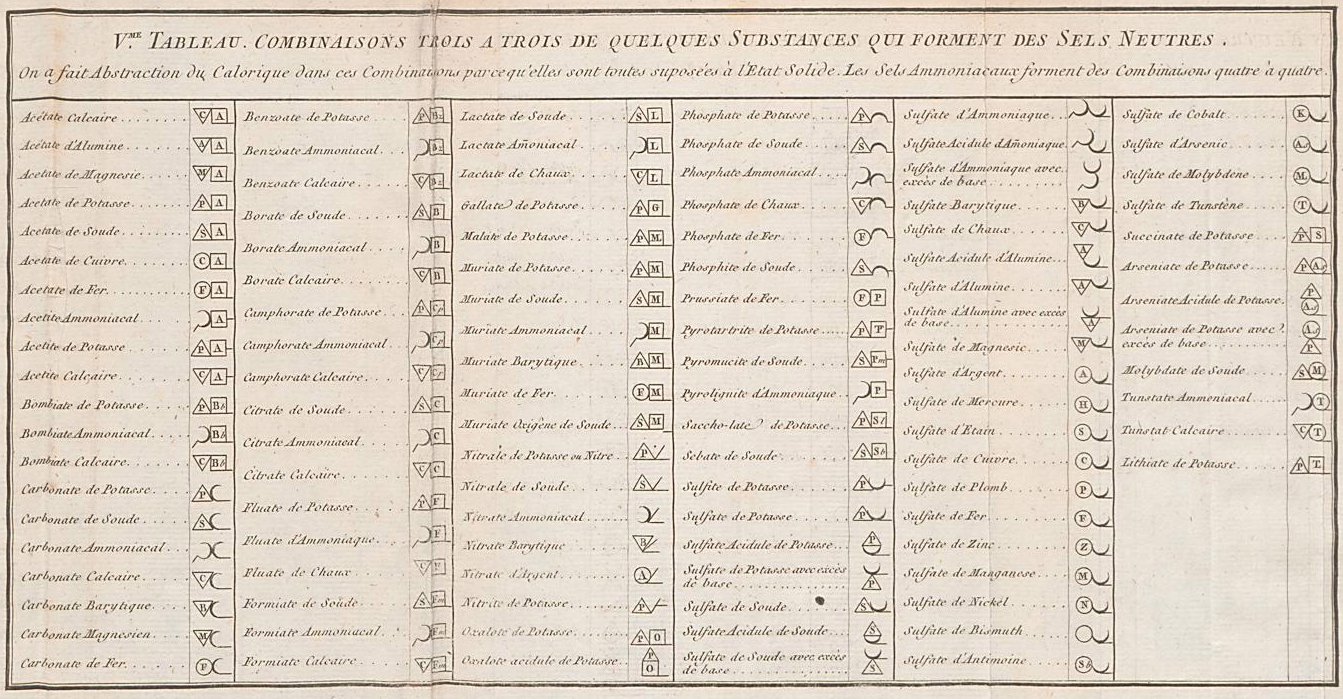
2021
Map of Fundemental Particles
By Domain of Science – Posters & YouTube Channel – a periodic table of the fundamental particles that make up the periodic table.
Domain of Science is produced by physicist Dominic Walliman who is on a quest to make science as easy to understand as possible.

1969
Martin's Crystal Structure Periodic Table
Ref: Martin JW 1969, Elementary Science of Metals, Wykeham Publications, London
René Vernon writes:
Note the unusual placement of La-Ac in two places, under Y and before Ce-Th. On another aspect, Martin writes:
"The non-metals, which occupy the top right-hand corner of the Periodic Table... form about one-sixth of all elements, and they are characterized by having melting-points and boiling points below about 500°C, and by having their solid and liquid phases not conducting electricity. About two-thirds of all elements are metals, and a further one sixth have properties intermediate between those of metals and non-metals."
His approach to the question of which elements are metals and non-metals, and which are intermediate may be the most useful "rough-and-ready" rubric I've seen. It is remarkable for its use of four criteria.
Perhaps we can then parse the elements as follows
Non-metals (16) = 15.5%
Fluids: H, N, O, F, Cl, Br; He, Ne, Ar, Kr, Xe, Rn 2
Solids: P, S, Se*, IIntermediate (16) = 15.5%
Metalloids: B, Si, Ge, As, Sb, Te
Near metalloids: C, At 3
Sub-metalloids: Al, Ga, In, Tl; Sn, Pb; Bi; PoMetals (71) = 68.9%
Be,^ Zn^
All the rest^ Borderline intermediate
Dingle (2017, The Elements: An Encyclopedic Tour of the Periodic Table, Quad Books, Brighton, p. 101) puts the situation this way:
"...the gap between the two extremes [of metals and nonmetals] is bridged... by the poor metals, and... the metalloids – which, perhaps by the same token, might collectively be renamed the poor non-metals.”
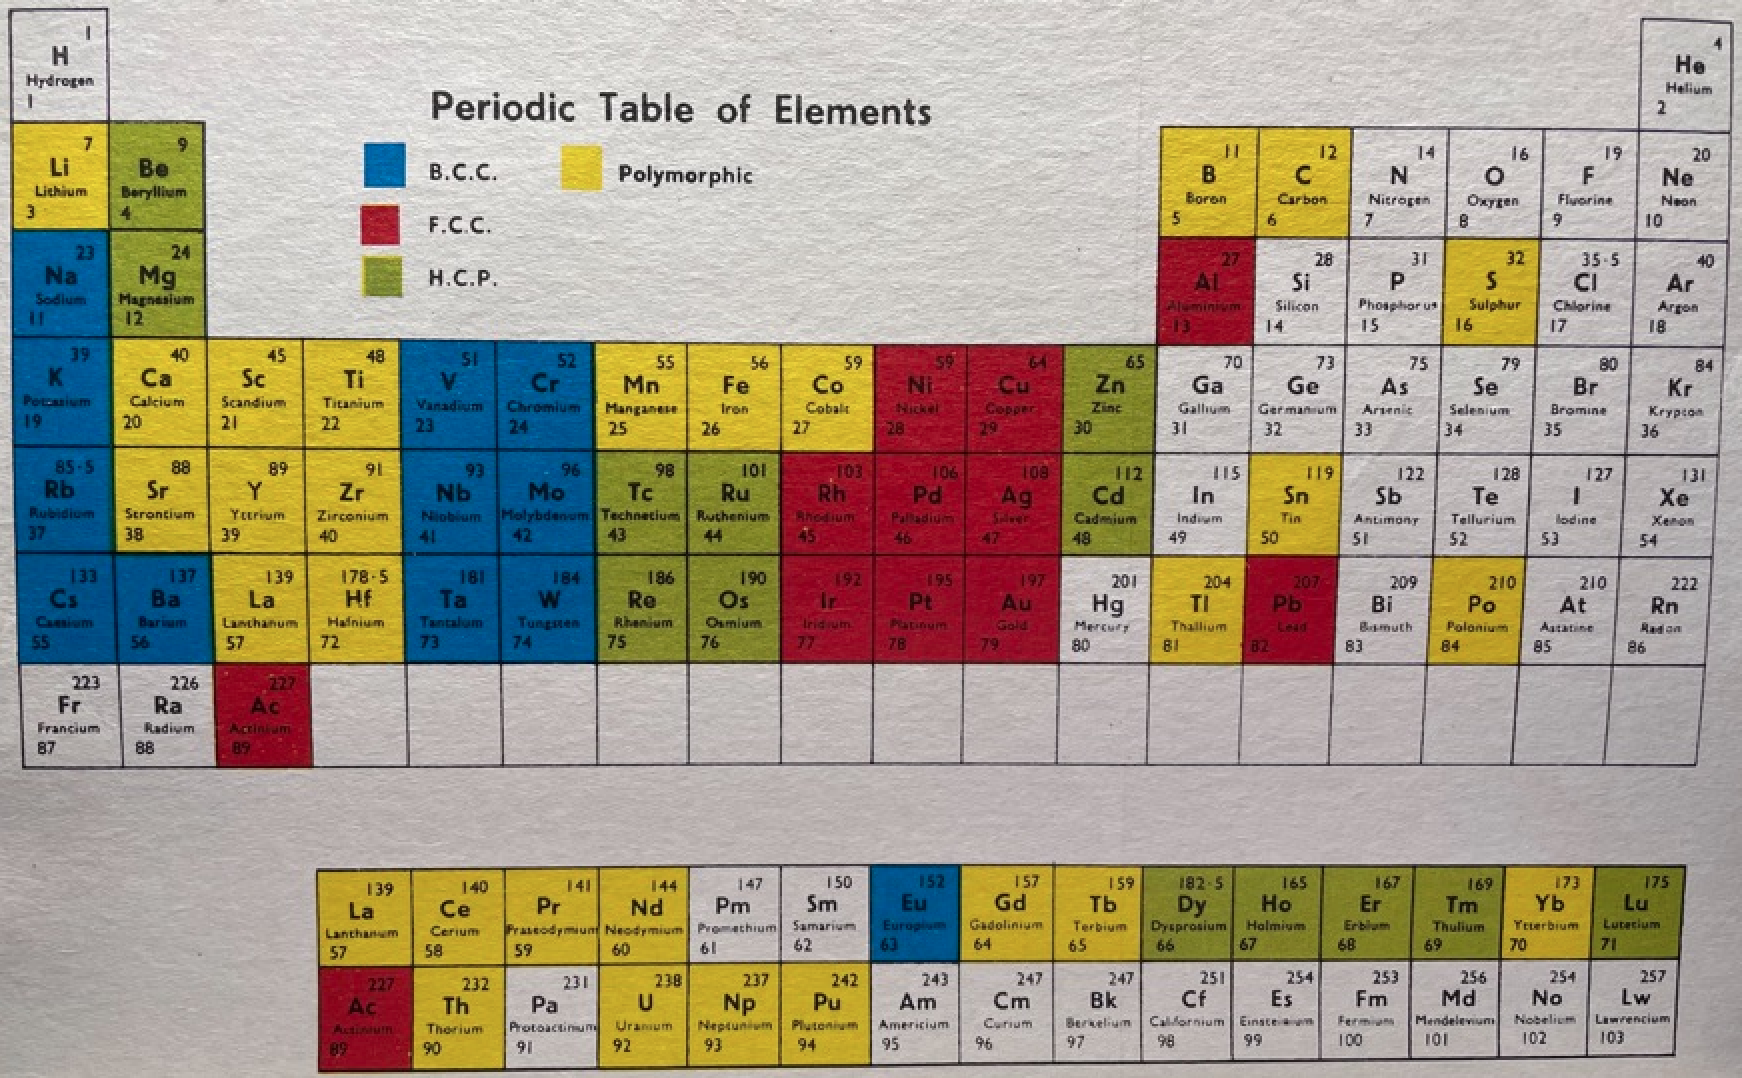
Redrawn by Vernon:
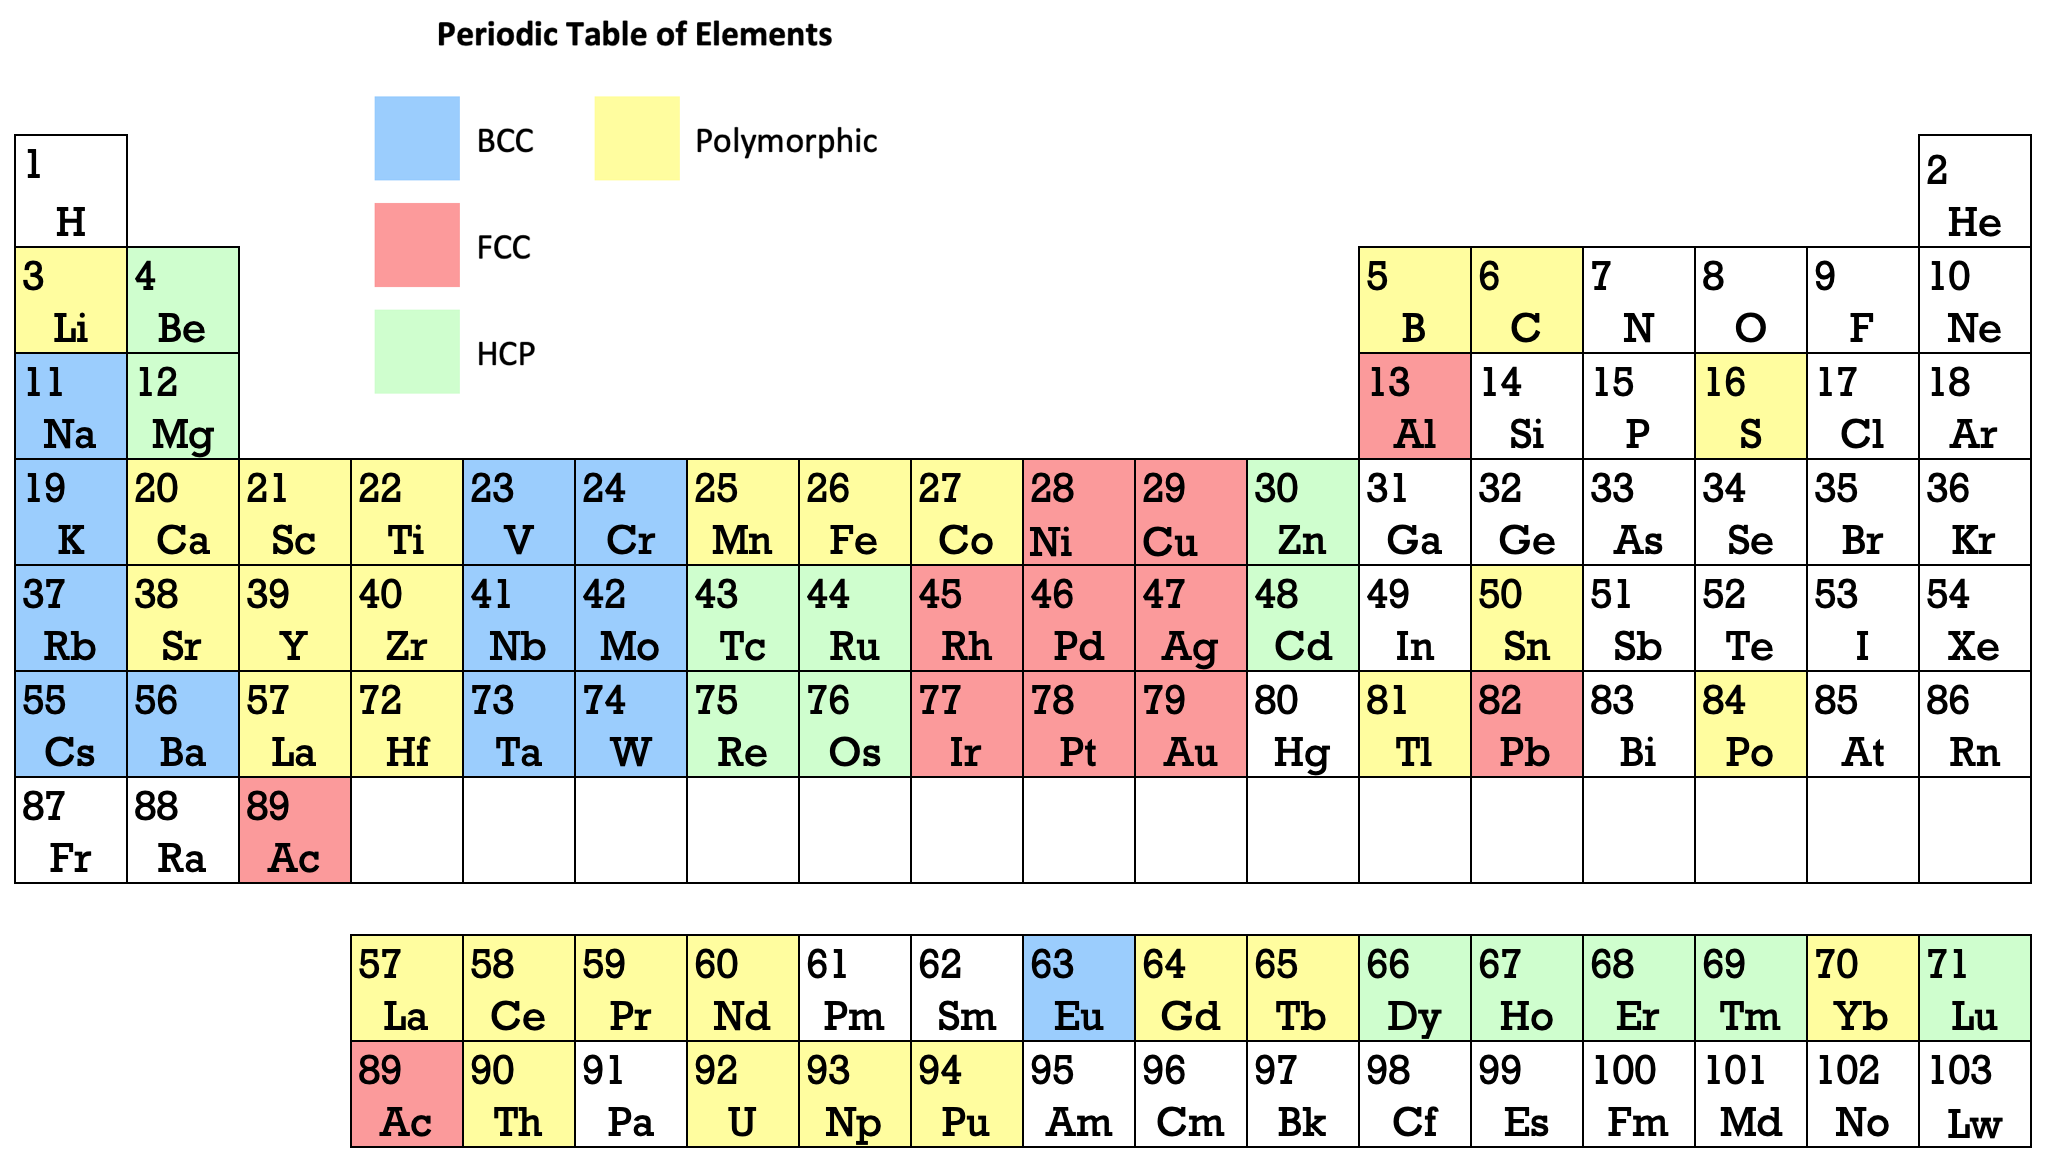
Thanks to René for the tip!
2004
Mass Anomaly Periodic Table
Pairs of atoms where atomic mass does not follow atomic number.
|
Co
|
=
|
58.933 |
Ni
|
=
|
58.69 | ||
|
Ar
|
=
|
39.948 |
K
|
=
|
39.098 | ||
|
Te
|
=
|
127.60 |
I
|
=
|
126.90 |
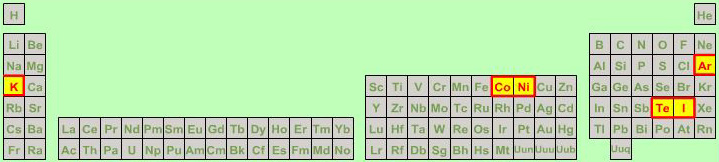
Nature's little quirk – due to the intricacies of nuclear chemistry and isotopic abundance – caused no end of difficulties to the developers of the periodic table in the mid-nineteenth century. Scientists could determine atomic mass, but knew nothing of protons or atomic numbers.
The tellurium-iodine anomaly was a particular problem.
By Mark Leach
2004
Material Type Periodic Table
All of the the main group elements are common laboratory reagents or chemical in bottles. They appear as metals, metalloid (semi-metals) and non-metals. Most of the non-metals are molecular materials while most of the metalloids have an extended network-covalent structure.
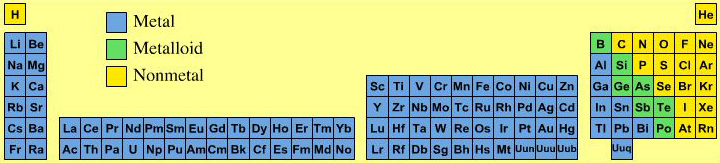
Elsewhere in the chemogenesis web book, material type is discussed in terms of the Laing Tetrahedron, an analysis that classifies binary materials in terms of four extreme types: metallic, ionic, molecular and network. However, none the chemical elements present as ionic materials, only as metals, molecular (van er Waals) and network materials:
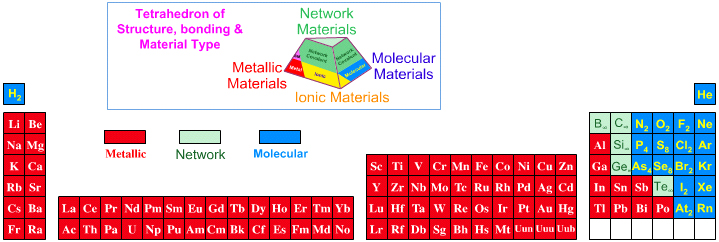
The elements B, C, Si, P, S, Ge, As, Se, Sn, Sb and Te can form allotropes: pure elemental substances that can exist with different crystalline structures from the Wikipedia. Allotropes may be metallic, network or molecular.
By Mark Leach
2007
Mechanical Engineer's Periodic Table
Avallone EA, Baumeister T & Sadegh AM (eds) 2007, Marks' Standard Handbook for Mechanical Engineers, 11th ed., McGraw-Hill, New York, p. 6-6. Click here for a larger version.
This mech eng PT has a couple of odd features: hydrogen is in Group 17 above fluorine and the lanthanides are split:

Thanks to René for the tip!
2014
Medicinal Chemist's Periodic Table
From In The Pipeline, a blog posting about a [free, full access] review entitled, Exploration of the medical periodic table: towards new targets.
- Element symbols in white are known to be essential in man.
- The ones with a blue background are found in the structures of known drugs.
- The orange ones are used in diagnostics.
- The green ones are medically useful radioisotopes.
- The paper notes that titanium and tantalum are coloured blue due to their use in implants.
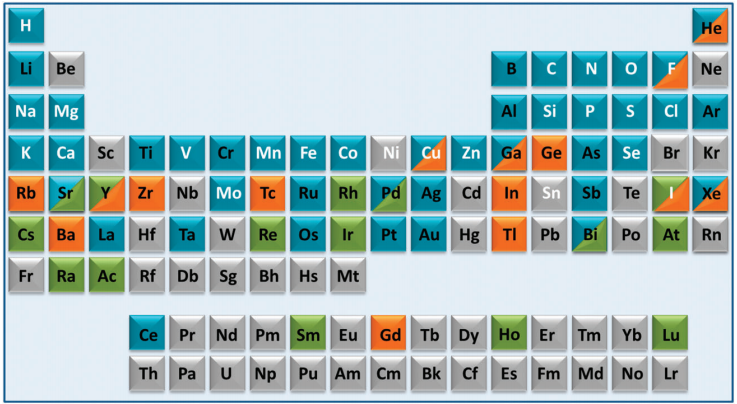
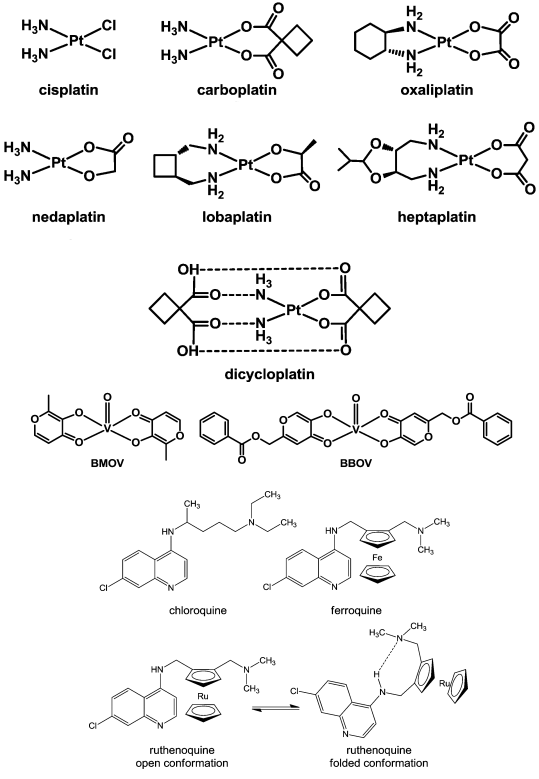
Thanks to Marcus Lynch for the tip!
2015
Medicinal Periodic Table: Elements for Diagnosis & Therapy
Periodic table of elements for diagnosis and therapy from: Gilbert T.R., Kirss R.V., Foster N. & Davies G., 2015, Chemistry: The Science in Context, 4th ed., W. W. Norton & Co., New York, p. 1066:
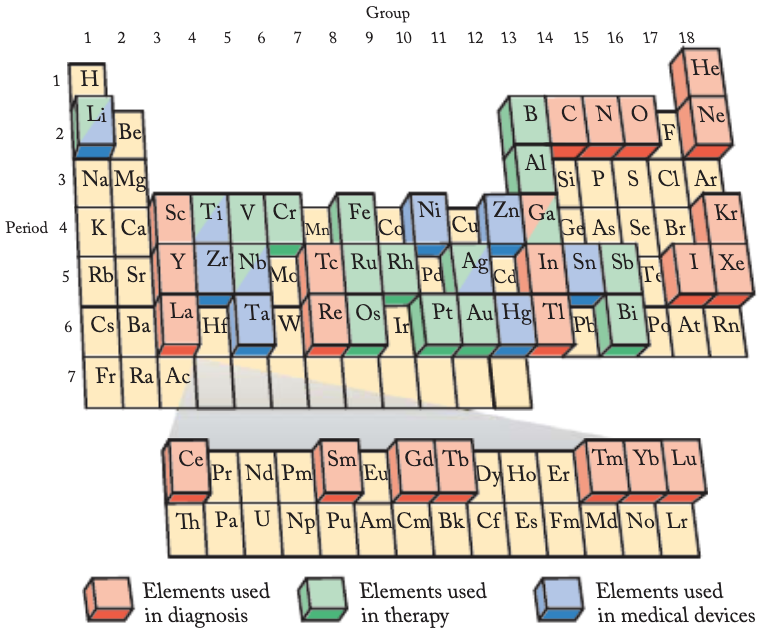
2019
Medicines, Periodic Table of
From C. Van Cleave 1 and D. C. Crans, The First-Row Transition Metals in the Periodic Table of Medicine, Inorganics 2019, 7, 111 (Inorganics 2019, 7, 111; doi:10.3390/inorganics7090111, www.mdpi.com/journal/inorganics).
From the paper, specifically the text associated with the figure:
The periodic table with known medicinal uses of each main group or transition metal element when available. In the following, we list the use of each element.
- Hydrogen (H), boron (B), carbon (C), calcium (Ca), phosphorous (P), potassium (K), magnesium (Mg), vanadium (V), manganese (Mn), iron (Fe), cobalt (Co), copper (Cu), zinc (Zn), selenium (Se), rubidium (Ru), molybdenum (Mo), and cesium (Cs) are commonly found in supplements readily available to the public and are illustrated as such. Helium (He) is crucial in the operation of MRI machines.
- Lithium (Li) as lithium carbonate is the most common treatment of bipolar disorder.
- Beryllium (Be) foil is used as shielding in radiographic instruments.
- Nitrogen (N), as nitrous oxide, is a common anesthetic.
- Oxygen (O) has many medical uses, including anesthetics and resuscitation, and is illustrated here for use in ventilation.
- Fluorine (F) and tin (Sn) as stannous fluoride are a common ingredient in toothpaste.
- Sodium (Na) and chlorine (Cl) are used as NaCl in saline solutions.
- Aluminum (Al) compounds are a common active ingredient in antiperspirant deodorants.
- Silicon (Si) is used in antacid products.
- Sulfur (S) is illustrated as campden tablets, which are used for sterilization in beer fermentation.
- Argon (Ar) lasers are used in eye surgery.
- Zirconium (Zr) is used in immuno-positron emission tomography (PET) imaging while scandium (Sc) is a candidate for the same technique.
- Titanium (Ti), palladium (Pd), niobium (Nb), nickel (Ni), and tantalum (Ta) are used in medical implants.
- Chromium (Cr) is shown as Cr(III) picolinate, which is a controversial supplement used in lowering insulin resistance.
- Gallium (Ga), yttrium (Y), technetium (Tc), lanthanum (La), astatine (At), and actinium (Ac) are all used in nuclear medicine.
- Arsenic (As), as As(III) trioxide, is used to treat certain forms of leukemia.
- Bromine (Br) as KBr is an active ingredient in canine seizure medication.
- Krypton (Kr) was used in lung ventilation studies but has since been phased out.
- Strontium (Sr) is used in Sensodyne® toothpaste.
- Rhodium (Rh), ruthenium (Ru), and rhenium (Re) complexes are used as anticancer agents.
- Silver (Ag) is used in antibacterial ointments.
- Indium (In) is used in white blood cell scans.
- Antimony (Sb) is used in leishmania medicine.
- Barium (Ba) is used in X-ray imaging of the gastrointestinal tract.
- Tungsten (W) is used in shielded syringes.
- Iridium (Ir) is used in brachytherapy.
- Gold (Au) was used as a treatment for rheumatoid arthritis but has been phased out.
- Mercury (Hg) is used in dental amalgams.
- Lead (Pb) is used in X-ray aprons.
- Bismuth (Bi) is used in stomach ulcer medicine.
- Neon (Ne), germanium (Ge) cadmium (Cd), tellurium (Tl), hafnium (Hf), osmium (Os), polonium (Po), francium (Fr), radon (Rn), and radium (Ra) although most of these are toxic elements for human life, some of these elements are under development as potential agents for disease treatment but to our knowledge they are not currently used for beneficial applications in medicine.
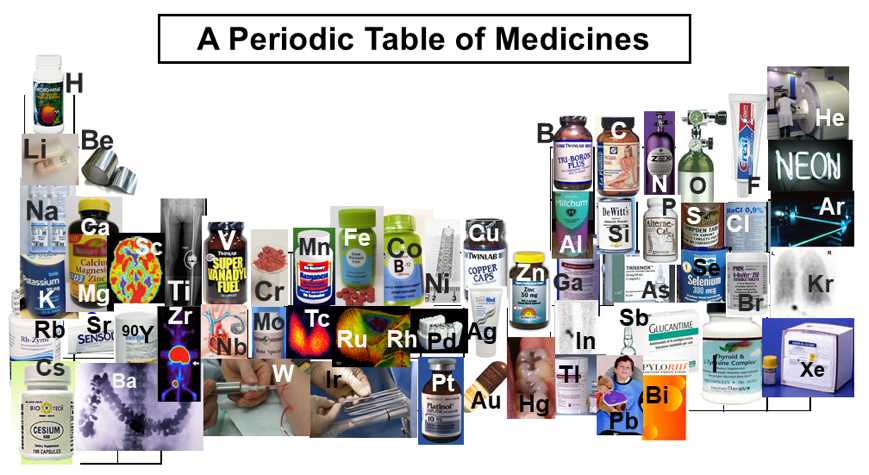
2005
Merck Periodic Table of The Elements
The Merck periodic table of the elements, here:
2000
Metal Crystal Structure Periodic Table
Developed from Dr S.J. Heyes' First Year Inorganic Chemistry lecture notes (Oxford University):
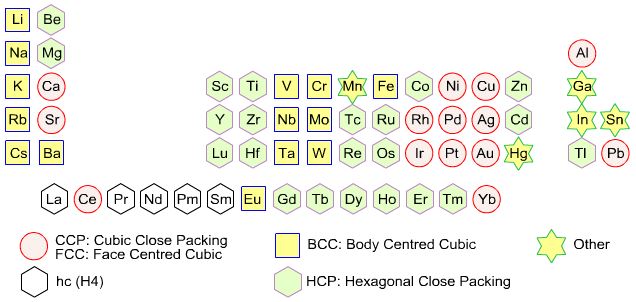
1996
Metals in Medicine Periodic Table
From Metal Complexes in Aqueous Solutions by Martell & Hancock, a periodic table of metals in medicine.

1987
Mineralogical-Crystallochemical Classification of Elements
From Jour. Fac. Sci., Hokkaido Univ., Ser. IV. vol. 22, no. 2, Aug., 1987, pp. 357-385, The Connection Between the Properties of Elements and Compounds; Mineralogical-Crystallochemical Classification of Elements by Alexander A. Godovikov & Yu Hariya.
Any mineralogical-crystallochemical classification of elements must provide answers to the following queries:
- Which type of compounds certain elements will prefer to form under given conditions of mineral genesis (elementary substance, chalcogenide, oxide, oxysalt, etc.,)
- Whether the element will play a role of a cation or anion of a certain valency
- Which type of chemical bond the resulting mineral compound will have
Click images below to enlarge:
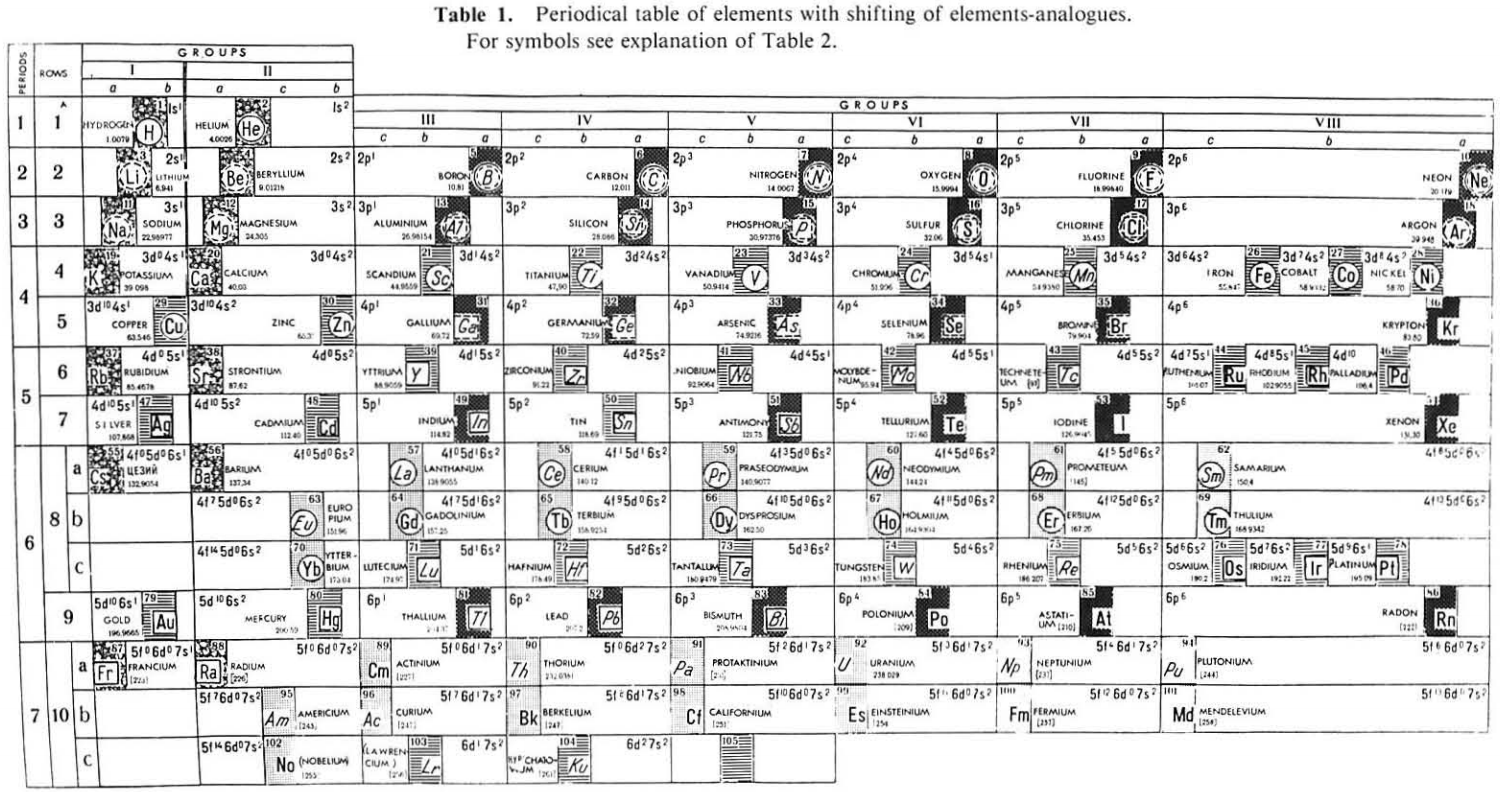
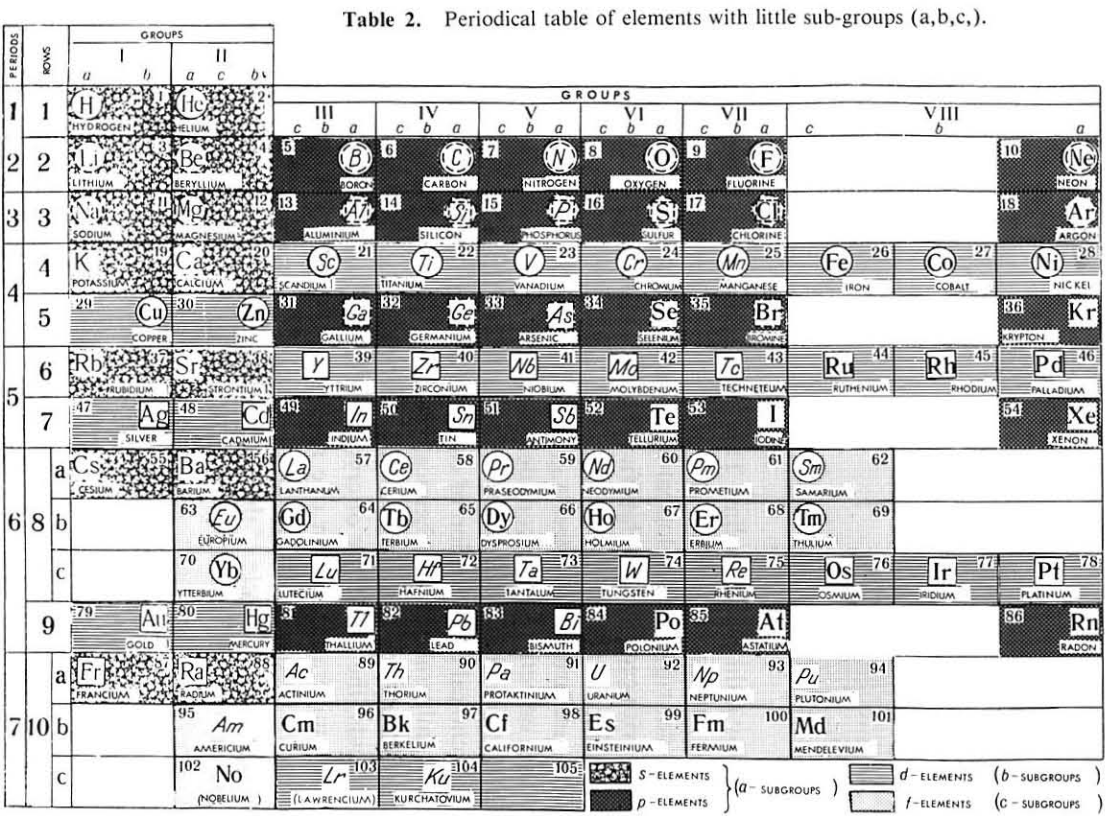
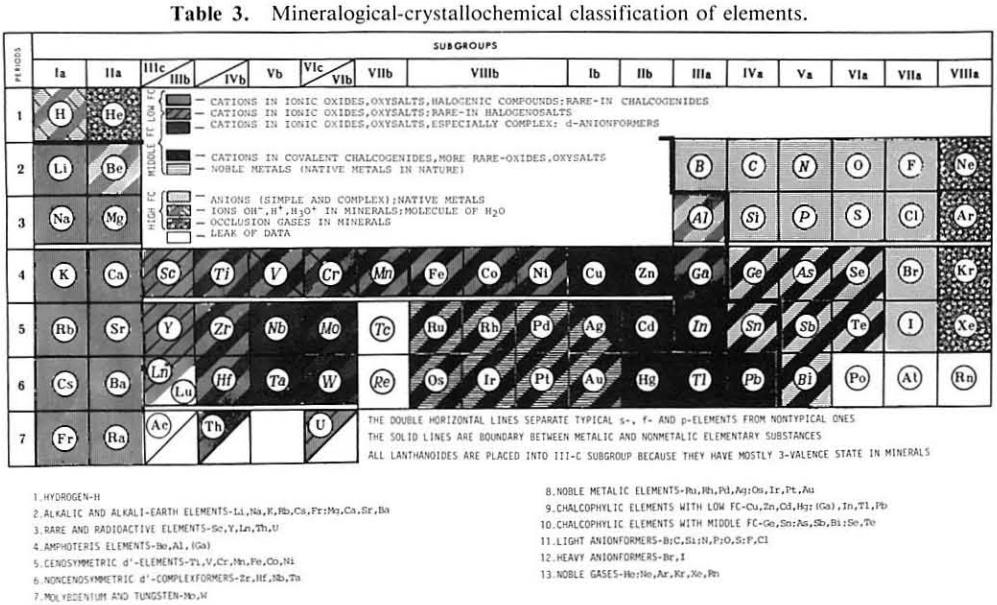
Thanks to René for the tip!
2005
Minerals by Chemical Composition
Lists minerals by percent element. From the excellent webmineral mineralogy database:
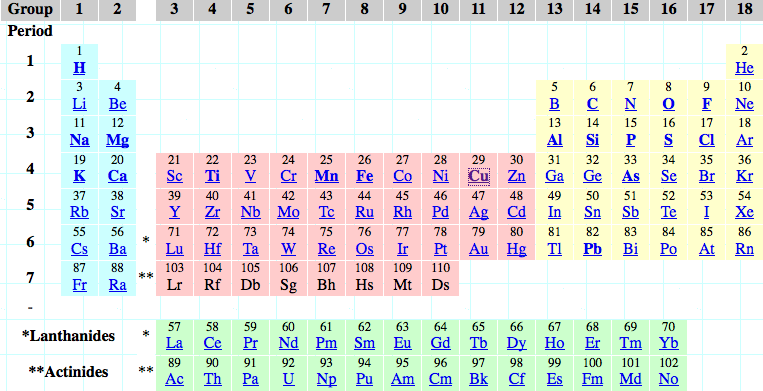
2020
Molar Magnetic Susceptibilities, Periodic Table of
Periodic Table of Molar Magnetic Susceptibilities by René Vernon, who writes:
I had read that the lanthanides were characterised by their magnetic properties, but never fully appreciated what this means. To this end, here is a table of Molar Magnetic Susceptibility (MMS) values (χ) for the elements, where MMS is a measure of how much a material will become magnetised in an applied magnetic field.
Formally, MMS is the ratio of magnetisation M (magnetic moment per unit volume) to the applied magnetising field of intensity H, allowing a simple classification into two categories of most materials responses to an applied magnetic field:
Alignment with the magnetic field, χ > 0, gives rise to paramagnetism
Alignment against the magnetic field, χ < 0, gives rise to diamagnetismSix observations:
1. The average value for each block is:
- s 20
- p –35
- d 125
- 4f 46,000
- 5f 522
2. Lanthanides having unpaired 4f metals (Ce to Tm) have magnetic susceptibilities two to four orders of magnitude larger than those of "normal" metals.
3. Mn (511), Pd (540), O (3415) [this is actually the triplet diradical molecule O2] & Bi (-280) stand out. [A magnetic cross would be good for repelling a bismuth vampire.]
4. MMS reduces going down all groups of the d-block. The average reduction going from 4d to 5d is 50%.
5. In group 3 there is a reduction of 48% on going from Y to La. If Lu is instead placed under Y the reduction is 2%.
6. There are at least six, rather than three, ferromagnetic metals.
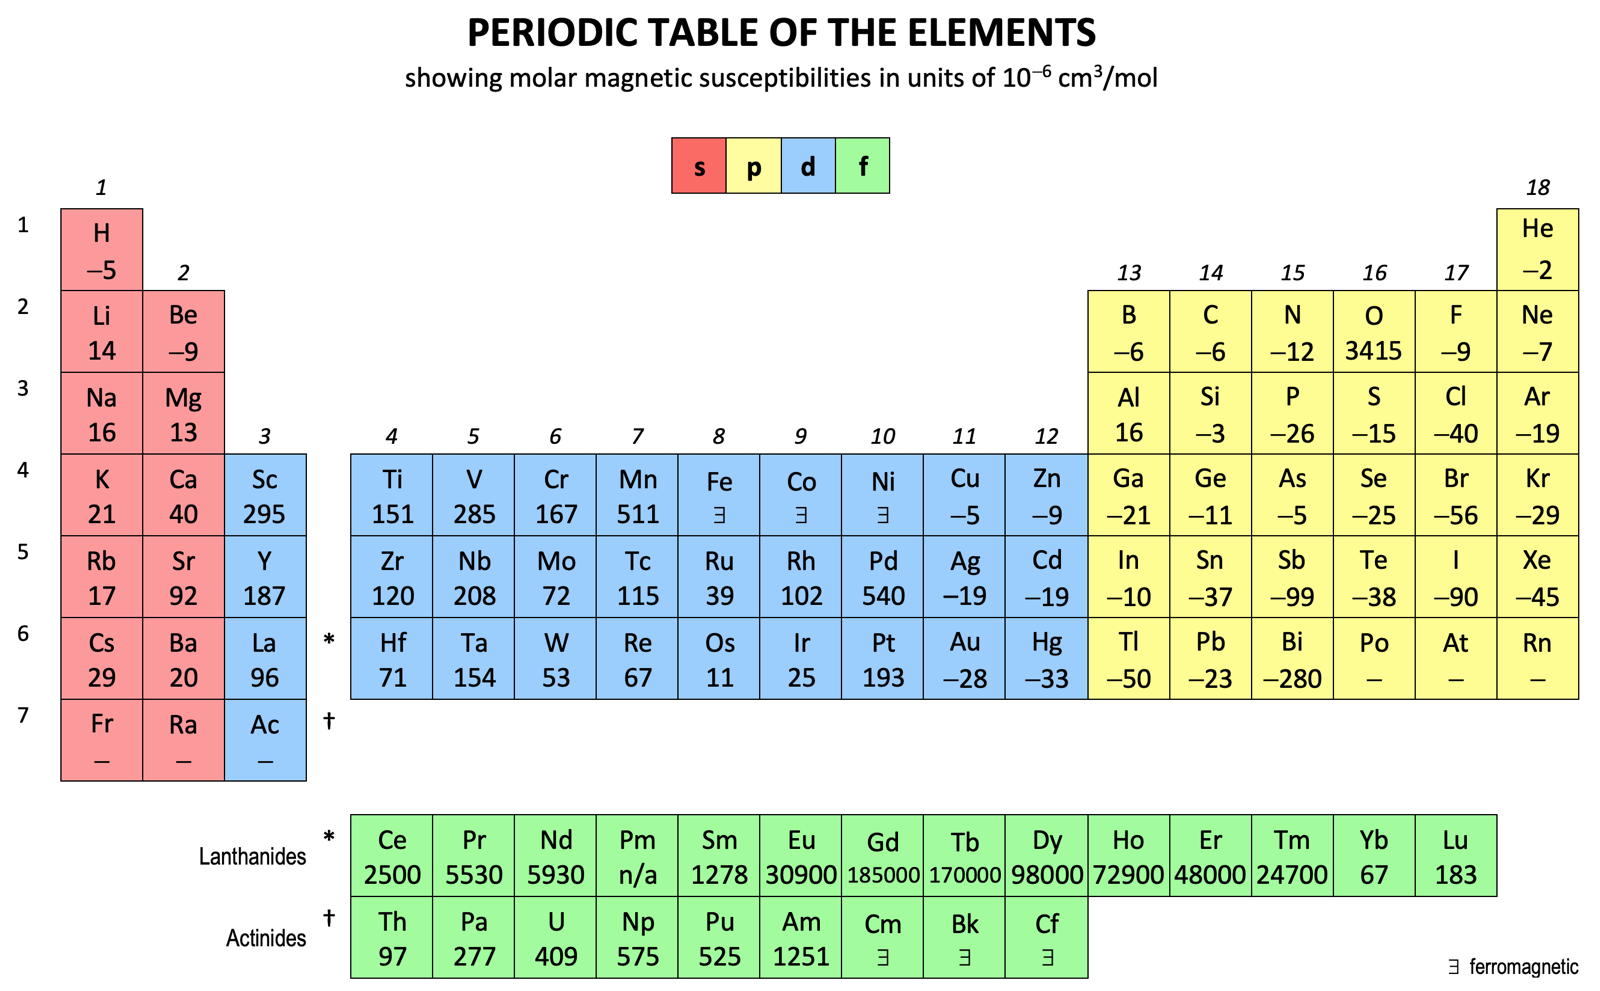
2018
Murov's Colours of the Elements
Steven Murov writes :
"The element squares of this periodic table have colors resembling the actual colors of the elements. The table provides insight useful for helping to distinguish metals and non-metals as well as observations on elements of unusual color. The colors were taken from https://www.chemicool.com/ and applied with RGB codes."
The tables are available online at:
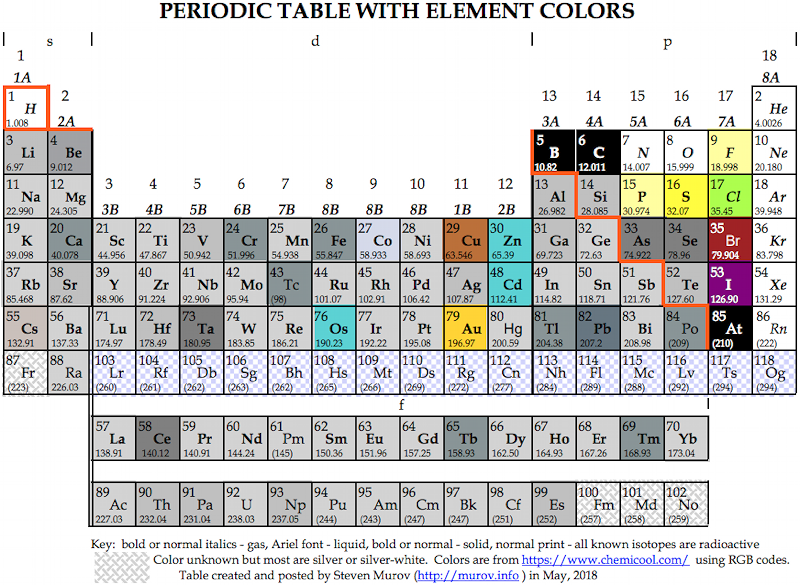
2019
Nature's IYPT Interactive Periodic Table
Nature's IYPT Interactive Periodic Table.
"To celebrate the International Year of the Periodic Table of Chemical Elements, our editors have curated research papers, commentaries and multimedia from Nature and the Nature Research journals. Dive in to find out what connects sodium with Sri Lanka, how many times astatine was discovered and where the White House got its name... And much more!"
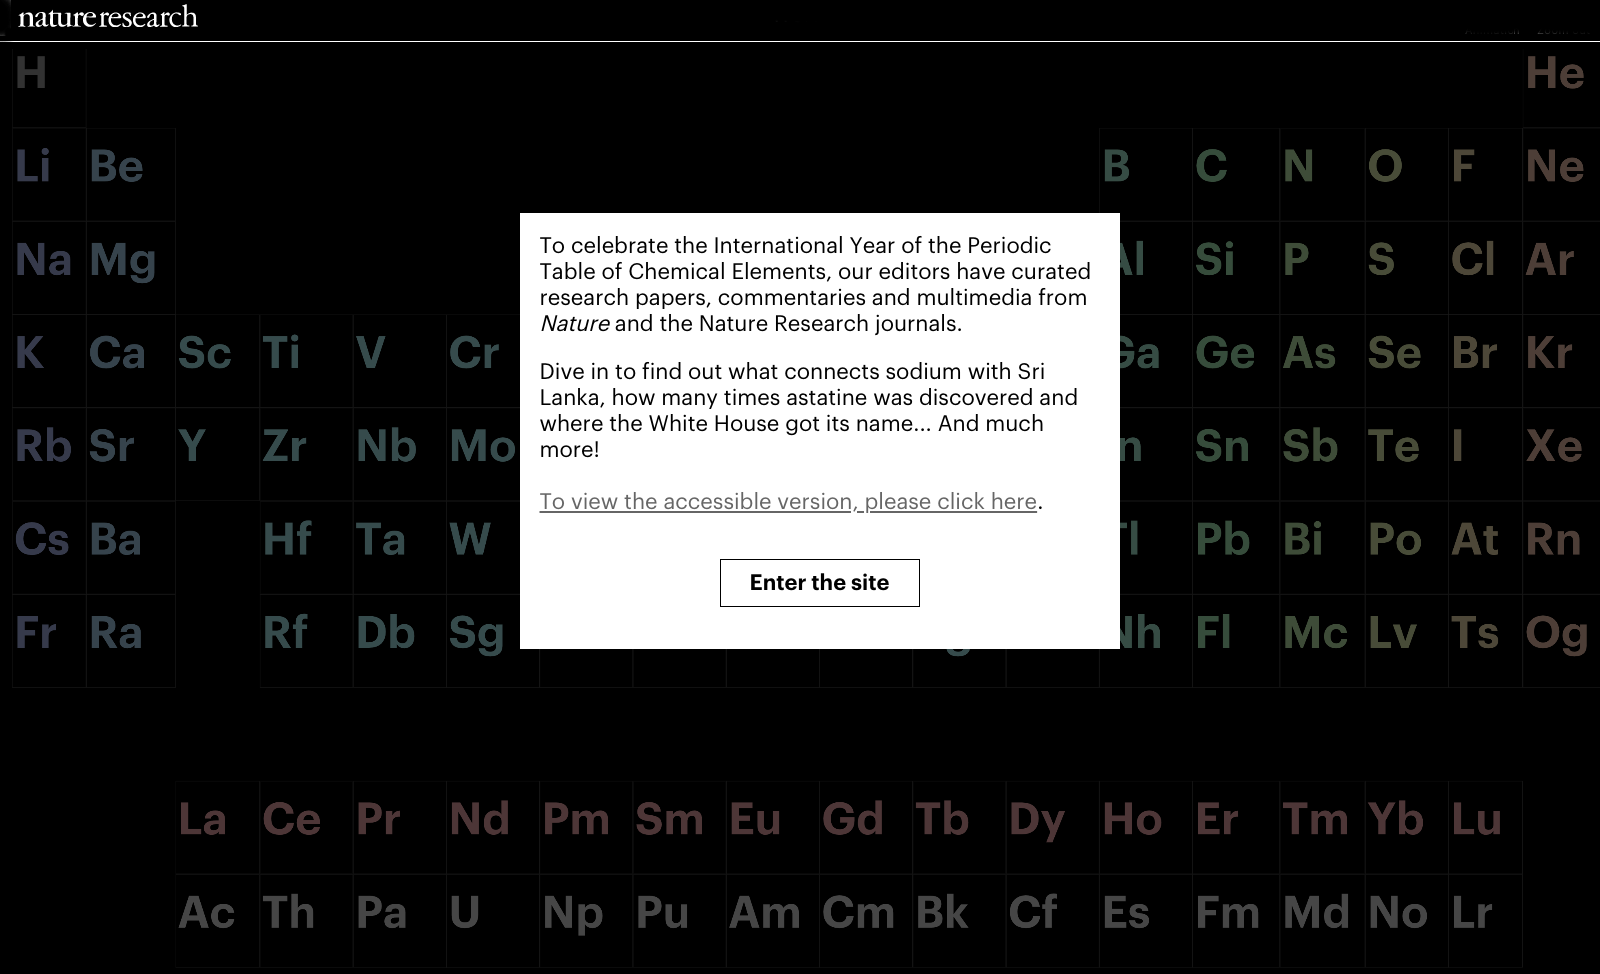
Thanks to Eric Scerri – who appears – for the tip!
See the website EricScerri.com and Eric's Twitter Feed.
2020
Nawa Version of Maeno's Nuclear Periodic Table
Nagayasu Nawa - "A Japanese school teacher and periodic table designer" - has developed two versons of the Hagino-Maeno Nuclear Periodic Table.
Nawa writes:
"I have made two Nuclear PTs based on Hagino-Maeno (2020). I have tried to express the Nuclear PT visually by using symbols such as '〇','◇','☓' or small '〇' or '●' in a binary way so that people with colour blindness could understand it. And the other have been with the ' QUAD electronic data."
Click either of the images below to enlarge:
2018
Nawa's V.E.T. Periodic Table & Hourglass
Nagayasu Nawa, the prolific designer of periodic tables, here and here, has come up with an orbital filling periodic table and a corresponding hourglass animation. Nawa writes:
"I have turned the v.e.c. PT into the GIF animation that I call the electron hourglass, 1 second for each element. It takes 120 seconds from 1H to 120 Ubn. I have coloured orbital with colour derived from each shell's name, such as:
- K kiwi
- L lapis lazuli
- M mauve
- N navy
- O orange
- P purple
- Q quick silver"
Click image to enlarge.
2021
Nawa's Multi Periodic Table
Nagayasu Nawa - "A Japanese school teacher and periodic table designer" - has developed a "Multi" Periodic Table with three formulations: long-form, upsidedown long-form & circular with era of discovery, electronic structure and abundance data.
Click here to download the .pdf file.
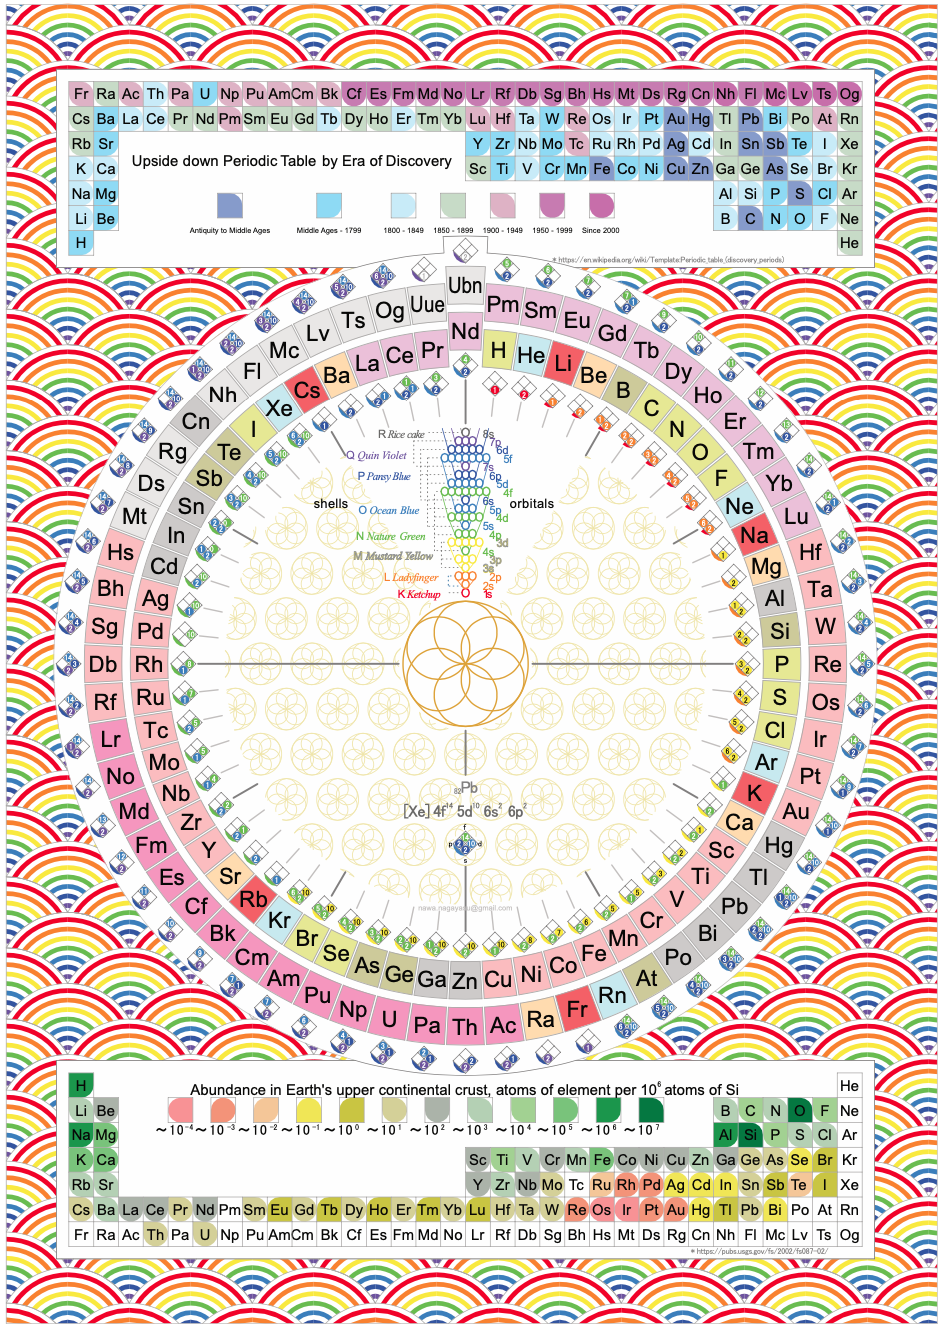
2021
Nawa's Rainbow Periodic Table
Nagayasu Nawa - "A Japanese school teacher and periodic table designer" - has developed a Rainbow Periodic Table that is stuffed full of data.
Click here to download the .pdf file.
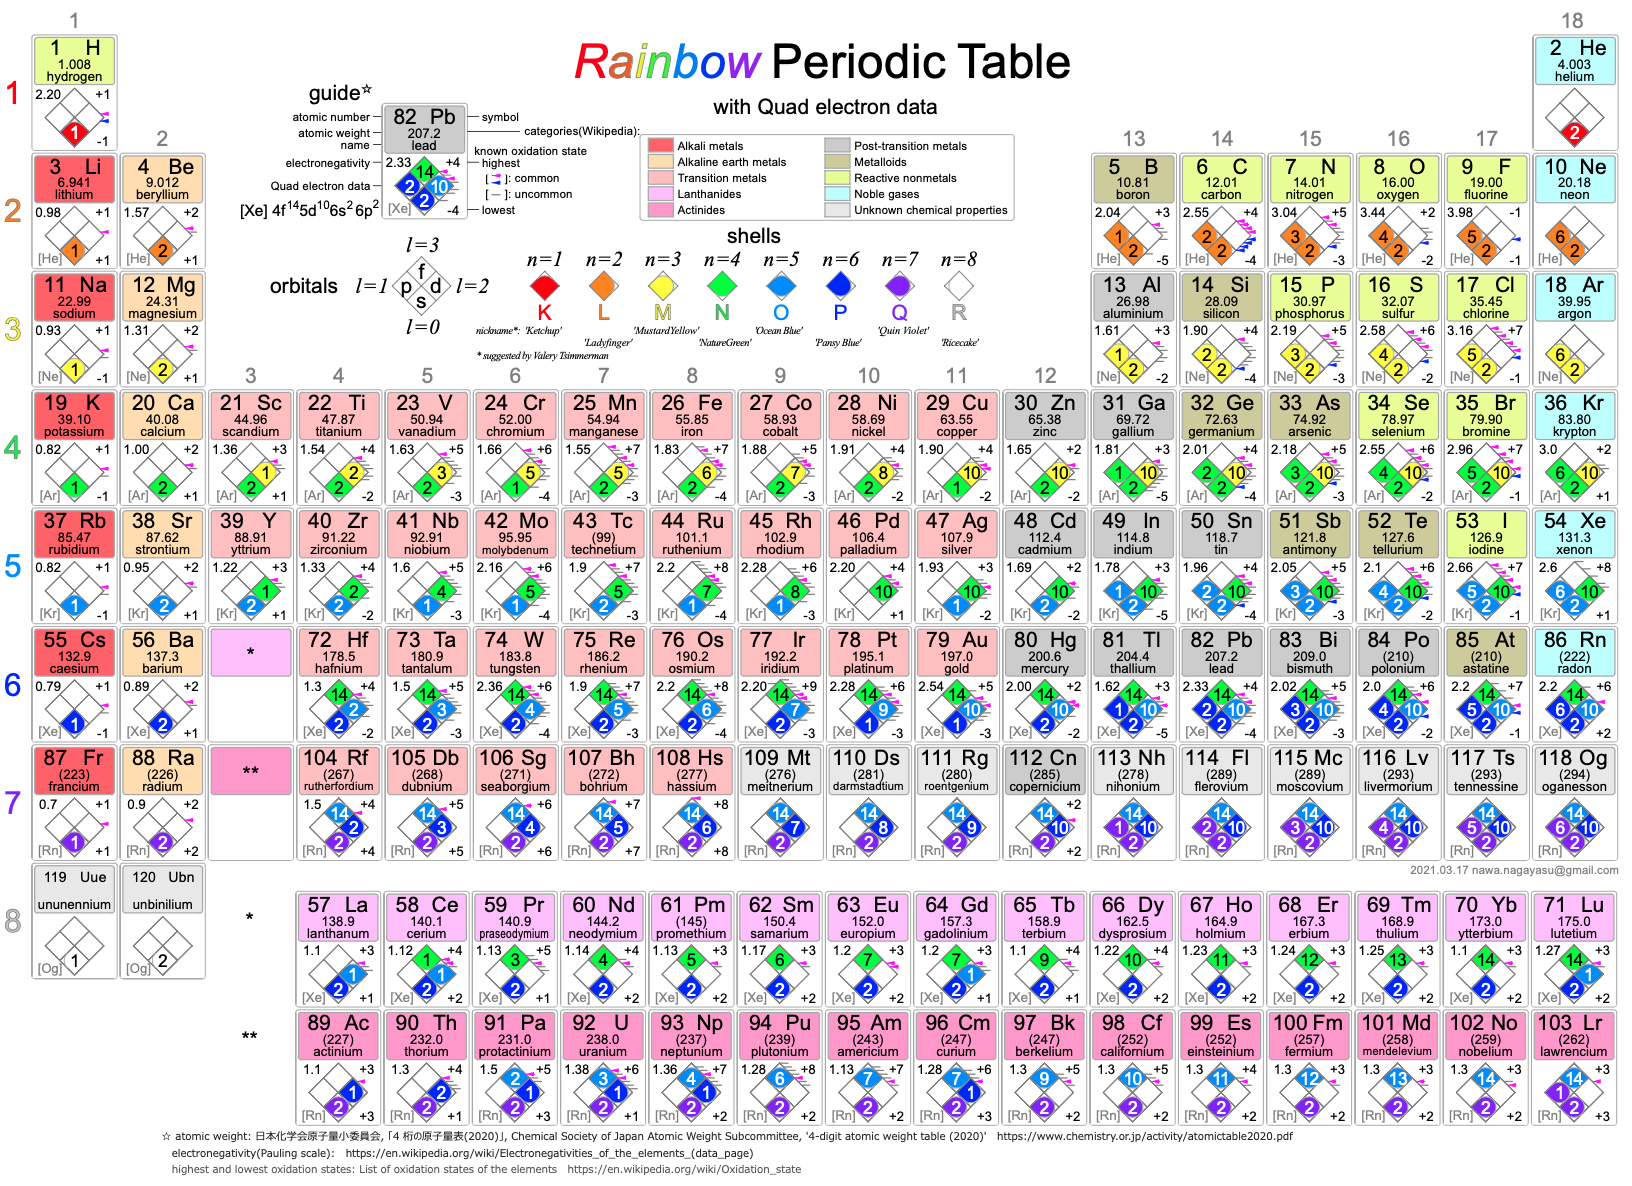
2007
Neutron Cross Section, Periodic Table of
From environmentalchemistry.com a periodic table of elements sorted by thermal neutron cross section (in barns).
EnvironmentalChemistry.com: Environmental, Chemistry & Hazardous Materials News, Information & Resources provides chemistry, environmental and hazardous materials news, careers & resources including: in depth articles; a detailed periodic table of elements; chemical database; hazmat emergency response guides; hazmat placarding information; and much mor..
Element neutron cross section is determined by the individual isotopes, and a table of isotope cross section data is available at NIST.
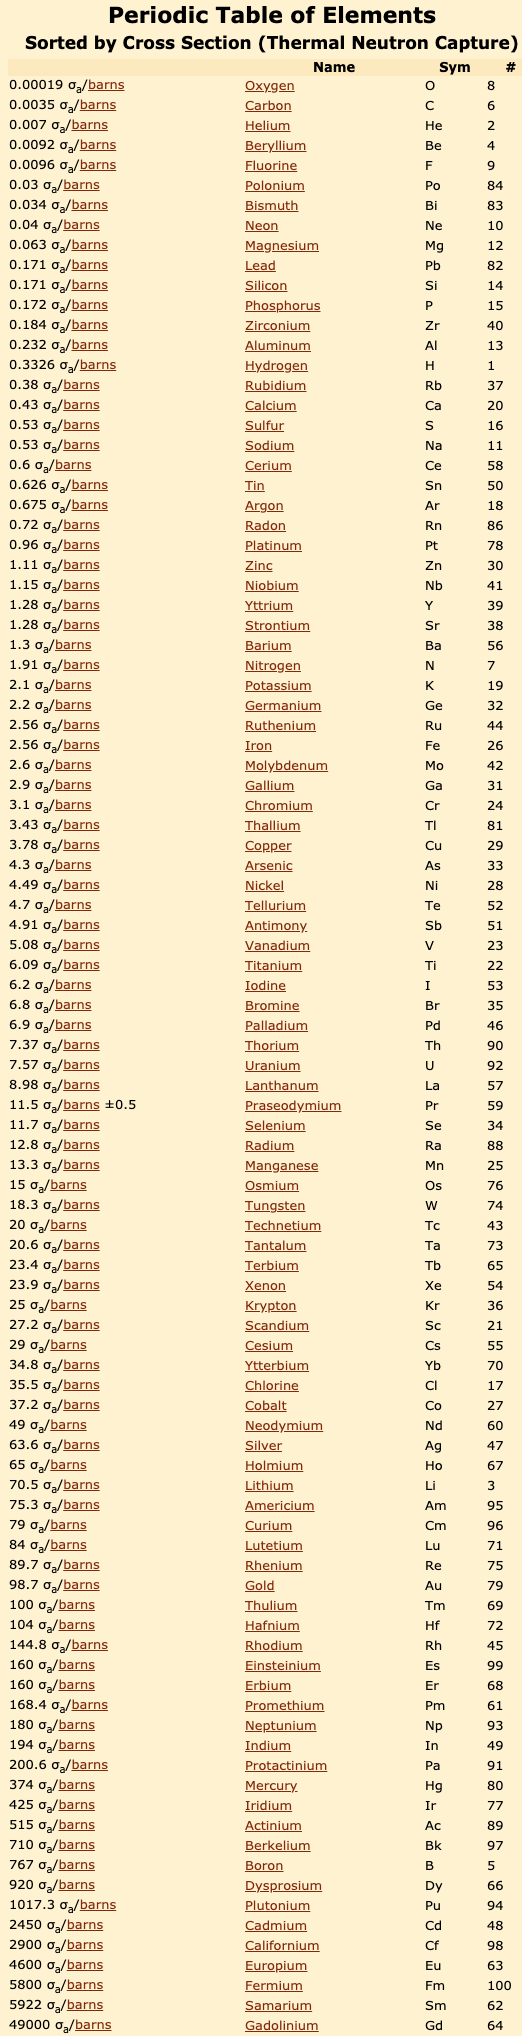
2010
NIST Atomic Physical Reference Data
Access the NIST (National Institute of Standards and Technology) physical reference data:
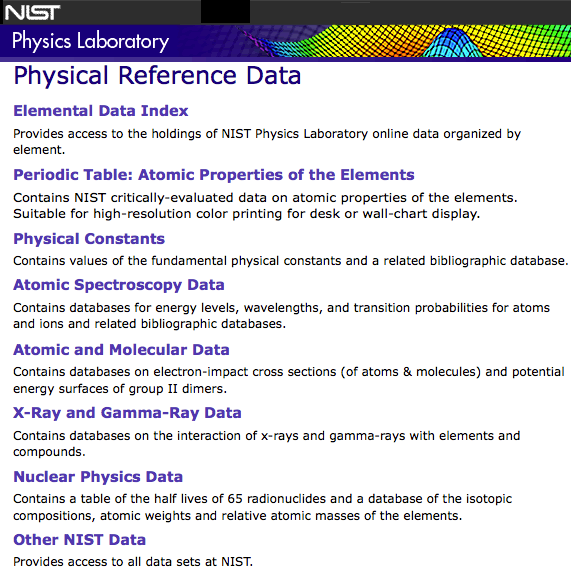
1998
NMR Nuclear Spin Periodic Table(s)
An nuclear magnetic resonance (NMR) spectroscopy periodic table giving information the nuclear spins, etc., of the chemical elements, from the Bruker corporation website:
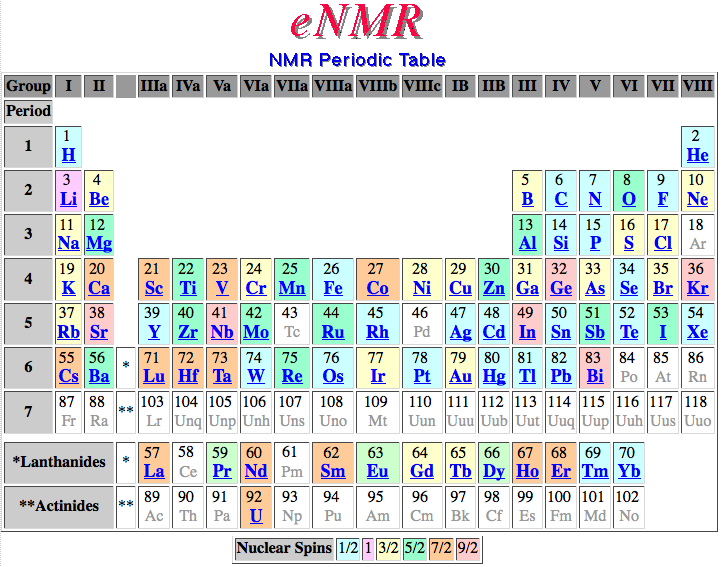
And, another:
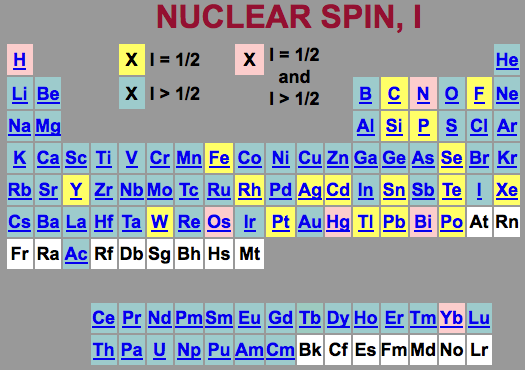
The range of NMR active nuclei observable on a particular instrument is, in part, a function of the configuration of the spectrometer and the choice of available probes. The periodic tables below identify the nuclei that have resonance frequencies within the detection range of the Lake Forest College Inova and the EFT-60 NMR spectrometers.
The nuclei in red are I=1/2 and yield spectra with narrow, non-overlapping resonances. The nuclei in blue have quadrapolar moments and may give rise to broad or very broad resonances in their spectra.
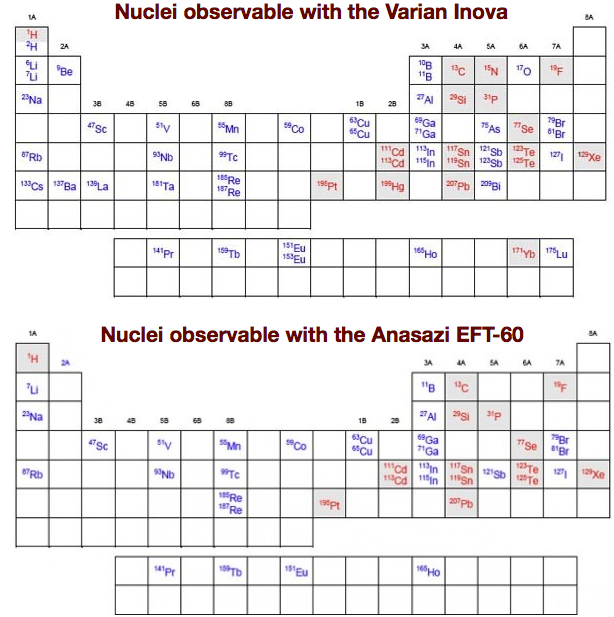
2020
Nuclear Periodic Table
A nuclear periodic table by Kouichi Hagino & Yoshiteru Maeno from Kyoto University published in Foundations of Chemistry here & here (open access).
"Elements with proton magic-number nuclei are arranged on the right-most column, just like the noble-gas elements in the familiar atomic periodic table.
"The periodic properties of the nuclei, such as their stability and deformation from spherical shape, are illustrated in the table. Interestingly, there is a fortuitous resemblance in the alignments of the elements: a set of the elements with the magic number nuclei 50(Sn), 82(Pb) and Fl(114) also appears as the group 14 elements in the atomic periodic table. Thanks to this coincidence, there are similarities in the alignments beyond 41(Nb) (e.g., Nb-Ta-Db or La-Ac in the same columns) in both the nuclear and atomic periodic tables of the elements.
"Related documents can be found: http://www.ss.scphys.kyoto-u.ac.jp/elementouch/index.html
![]()
![]()
2019
Nucleosynthesis of the Heavy Elements
A PBS video explaining how neutron star mergers lead to the formation of heavy elements, and how a merger only 80 million years before the formation of the solar system, 4.5 billions years ago, seeded the Earth wth the heavy elements of the periodic table:
2010
Nucleosynthesis Periodic Tables
The buildup of heavy elements from lighter ones by nuclear fusion.
Helium, and some lithium, was produced by cosmic (or primordial) nucleosynthesis from 2 to 20 minitues after the Big Bang, here and here:

From the Encyclopedia of Science:
Today most element-building nucleosynthesis takes place in stars.
Stellar nucleosynthesis converts hydrogen into helium, either by the proton-proton chain or by the carbon-nitrogen-oxygen cycle. As a star evolves, a contracting superdense core of helium is produced from the conversion of hydrogen nuclei into helium nuclei.
Eventually, the temperature and pressure inside the core become high enough for helium to begin fusing into carbon. If the star has more than about twice the Sun's mass, a sequence of nuclear reactions then produces heavier elements such as oxygen, silicon, magnesium, potassium, and iron. Successively heavier elements, as far as iron (in the most massive stars) are built up in later stages of stellar evolution by the triple-alpha process. The heaviest elements of all are produced by explosive nucleosynthesis in supernova explosions, by mechanisms such as the p-process, r-process, and s-process:

From FigShare (Athanasios Psaltis):
Our quest to explain the origin of the elements started in the late 1950's by two famous papers independently - E. M. Burbidge et al., Rev. Mod. Phys. 29, 547 (1957) & A.G.W. Cameron, Pub. Astron. Soc. Pac. 69, 201 (1957) - whose authors claimed that the elements are created in astrophysical environments. This is the well-known periodic table of elements, but where each element is labeled by the environment that is created (e.g Supernova explosion etc.).


In 2017 the LIGO gravitional wave detector identified the merger of two neutron stars, an event which produces large quantities of gold, platinum etc. Thus, an updated periodic table of nucleosyntheis looks like this, from an interesting SDSS blog:

Conal Boyce has prepared a Janet Left-Step Nucleosynthesis Periodic Table. Conal writes:
"This formulation was created by mapping the Ivans/Johnson color-coding scheme onto a Janet grid, using Tsimmerman half-cells. Although several attempts to contact Professor Jennifer Johnson failed, I did receive enthusiastic feedback on this LST mapping from Professor Inese Ivans, and decided to make it public on that basis."

2018
Number of Stable Isotopes by Element
When plotting the number of stable isotopes against element, and against atomic number Z, it is clear that elements with an even atomic number are likely to have more stable isotopes (average 4.9) than elements with an odd atomic number (average 1.3). Click here for the Excel file. There is a Wikipedia page here.
The effect is striking in graphical form:

By Mark Leach
1914
Oddo-Harkins Rule
The Oddo-Harkins rule holds that elements with an even atomic number (such as carbon) are more common than elements with an odd atomic number (such as nitrogen). This effect on the abundance of the chemical elements was first reported by Giuseppe Oddo in 1914 and William Draper Harkins in 1917. See the Wikipedia page:

1936
Orbital Filling With Electrons
Students of chemistry are often confused why the orbitals fill with electrons: 1s2, 2s2, 2p6, 3s2, 3p6, 4s2, 3d10, 4p6... etc., because the 3d10 seems to be 'out of sequence'.
This 'out of sequence' difficulity is nicely explained if the orbitals are arranged in a slightly different way:

The aufbau principle states that in the ground state of an atom or ion, electrons fill atomic orbitals of the lowest available energy levels before occupying higher levels. For example, the 1s shell is filled before the 2s subshell is occupied. In this way, the electrons of an atom or ion form the most stable electron configuration possible.
The order in which these orbitals are filled is given by the n + ![]() rule, also known as the Madelung rule (after Erwin Madelung), the Janet rule or the diagonal rule.
rule, also known as the Madelung rule (after Erwin Madelung), the Janet rule or the diagonal rule.
Orbitals with a lower n + ![]() value are filled before those with higher n +
value are filled before those with higher n + ![]() values. In this context, n represents the principal quantum number and ? the azimuthal quantum number. The values
values. In this context, n represents the principal quantum number and ? the azimuthal quantum number. The values ![]() = 0, 1, 2, 3 correspond to the s, p, d and f orbital lables.
= 0, 1, 2, 3 correspond to the s, p, d and f orbital lables.
Julio Gutiérrez Samanez writes:
"I send you the diagram below that reconciles quantum mechanics (diagram for filling the electronic cells) with the Janet table or LSPT. Explaining the duplication of periods with the duplication of the quantum number n, and the introduction of Tao (T) spin of the level or spin of the period, which explains the parity of the symmetric periods."

2020
Orbitals of the Outermost Electrons in 2D, Periodic Table of
By Meszi of visulizing.all.things.science@gmail.com, a Periodic Table of Orbitals of the Outermost Electrons in 2D, from reddit.
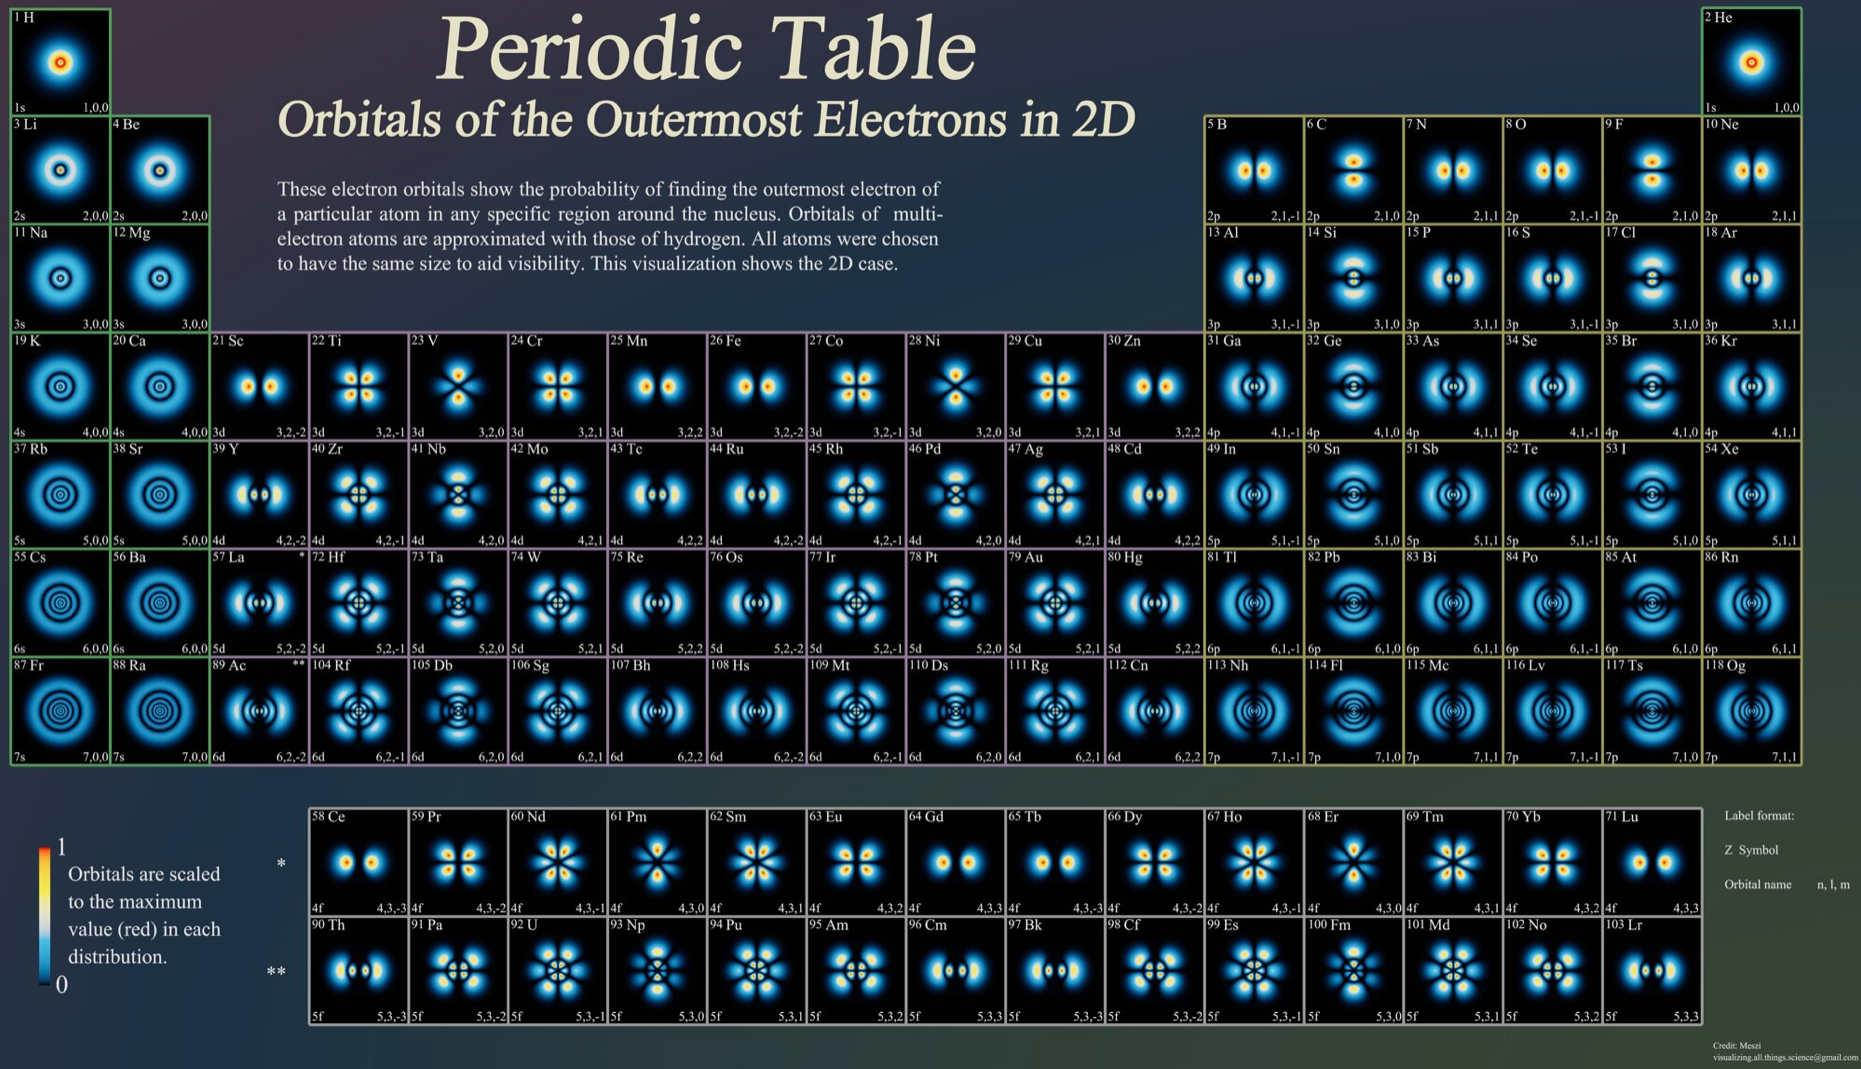
2009
Orbitron Gallery of Atomic Orbitals
The Orbitron gallery of atomic orbitals is a poster available from Mark Winter's Web Elements:
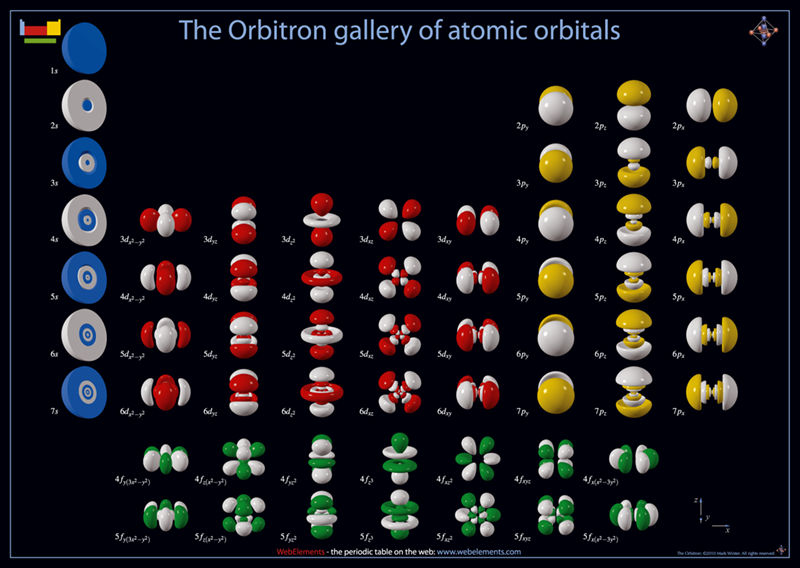
The orbitron web page is here.
2004
Organic Chemist's Periodic Table
Organic chemistry is dominated by carbon, hydrogen, oxygen and nitrogen. Other elements are commonly encountered in the organic lab, others less commonly and some... almost never at all...
A less than useful formulation (!):
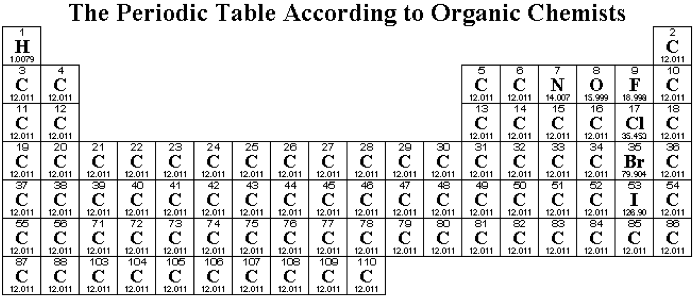
followed by a slightly more useful organic chemist's periodic table:
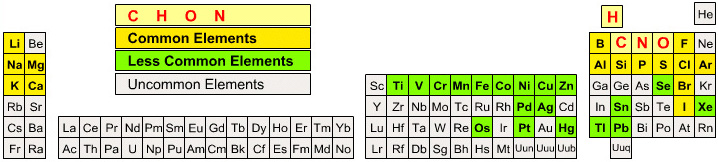
By Mark Leach
2018
Organic Chemist's Periodic Table (another one)
The Periodic Table as seen by an Organic Chemist... a T-Shirt by REDBUBBLE:
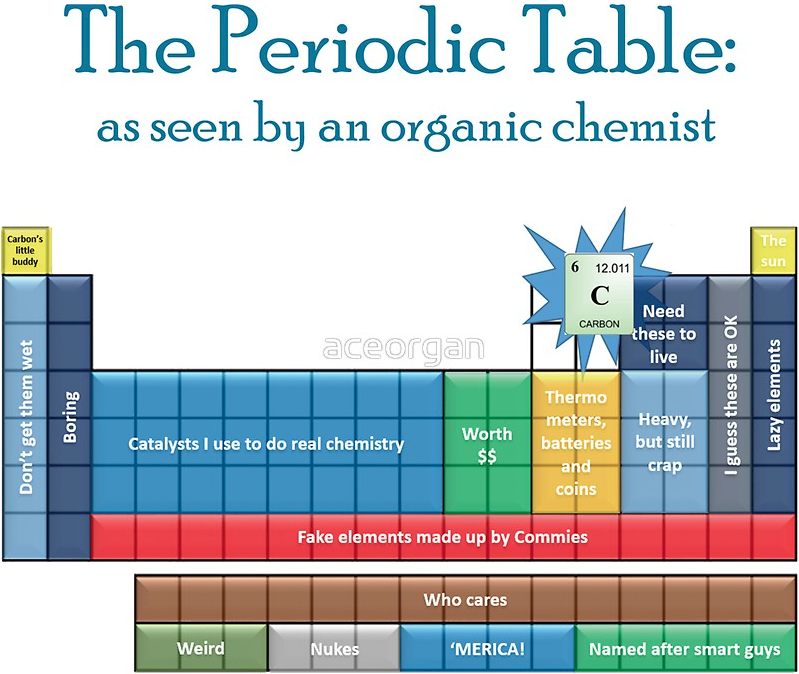
Thanks to Marcus Lynch for the tip!
2008
Organometallic Periodic Table
Wikipedia has pages on many types of organometallic compound, and a periodic table for accessing these organometallic pages, such as the one below (which happens to be on the organotin page):
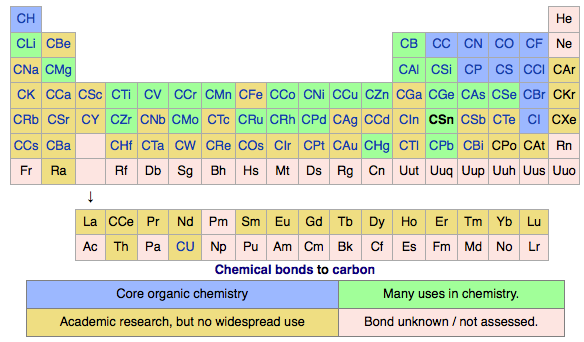
1942
Paneth's Table
Published by Paneth in 1942 in an article in Nature in which he suggests that newly discovered elements such as Z = 43 should be given names by their discoverers. The other highlighted elements (below) had also not yet been named.
Element 43 had been discovered 9 years earlier but had not been given an official name because there was reluctance to consider synthetic elements on the same footing as naturally occurring ones. This changed as a result of Paneth's article.
For more information see Eric Scerri's, A Tale of Seven Elements, OUP, 2013.
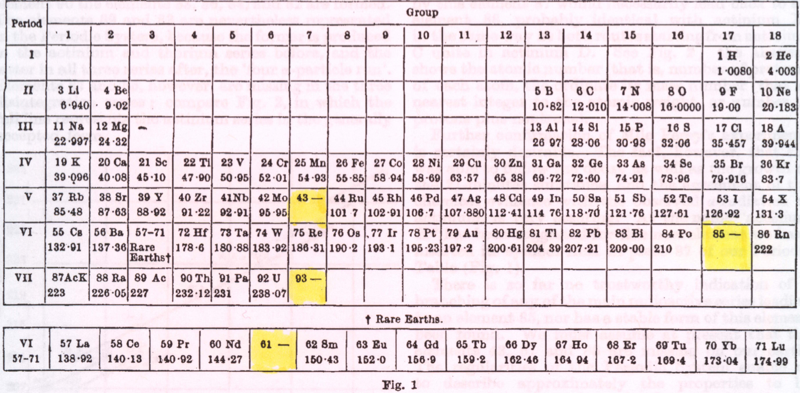
Thanks to Eric Scerri for the tip!
See the website EricScerri.com and Eric's Twitter Feed.
1960
Pauling's Complete Electronegativity Scale
From The Nature of The Chemical Bond, 3rd Ed, pp 93, Pauling gives a periodic table showing the electronegativity of the elements.
Notice how the d block appears between groups 3 and 4 (13 & 14), rather than between groups 2 and 3 (2 & 13):
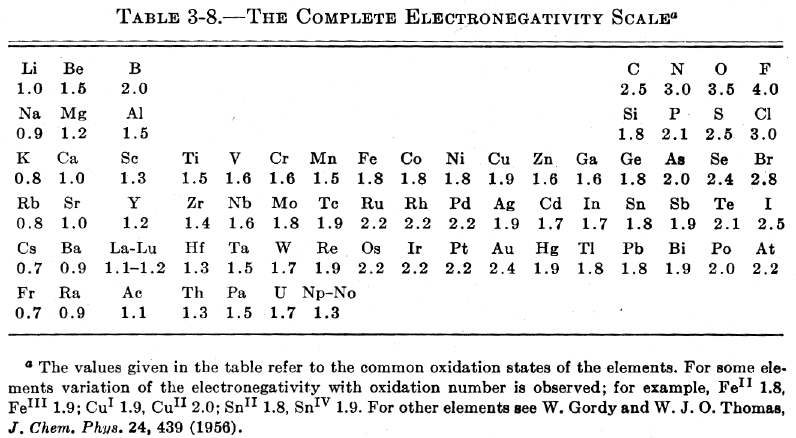
2022
Periodic Table of Periodic Tables
René Vernon has collected the PT formulations in this PT database and classifed them as:
Short, Triangular, Medium, Long, Continious, Folding, Spatial & Unclassified
and tabulated them by date. The 'working document' is currently a word file.
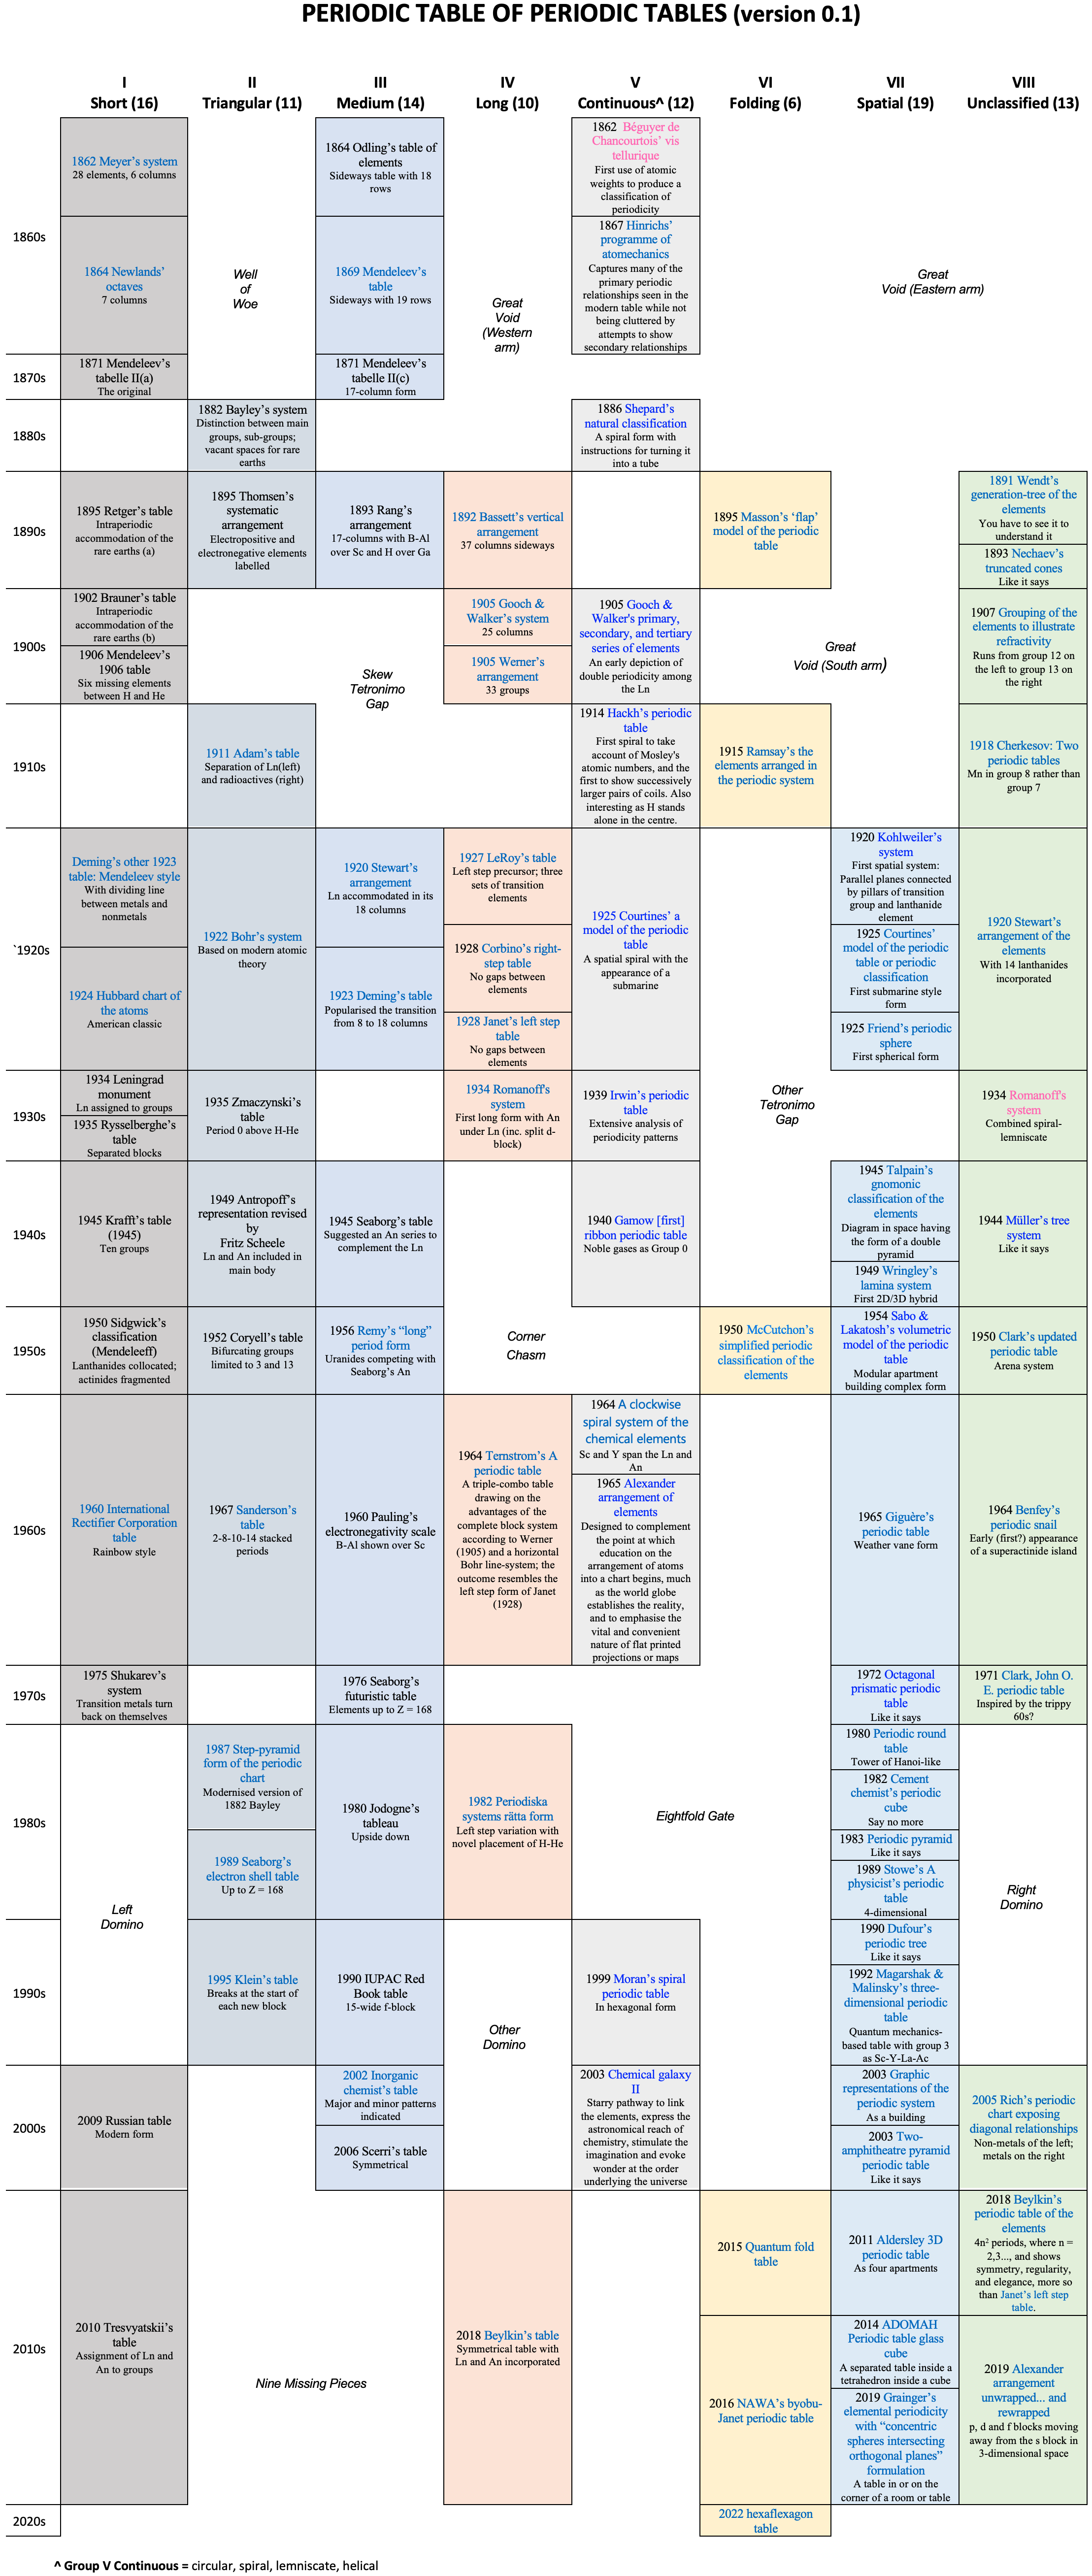
2024
Periodic Table Regions
Permanent link to the comic: https://xkcd.com/2913/
Image URL (for hotlinking/embedding): https://imgs.xkcd.com/comics/periodic_table_regions.png

Thanks to Marcus for the tip!
2008
Periodic Table X
Periodic Table X is a periodic table for the Macintosh.
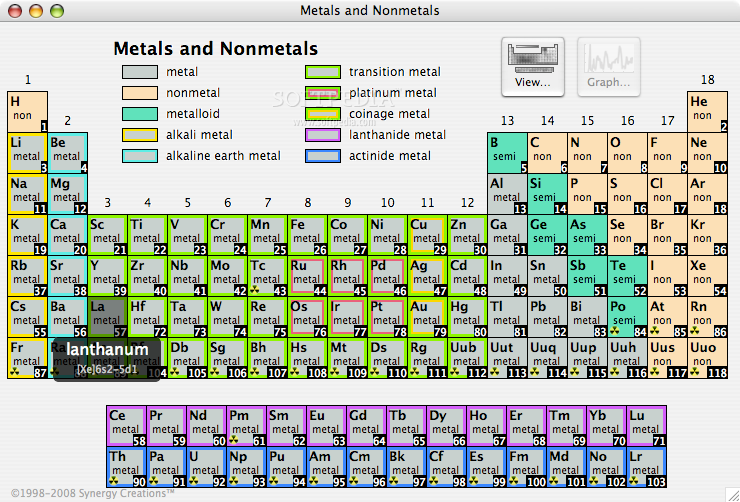
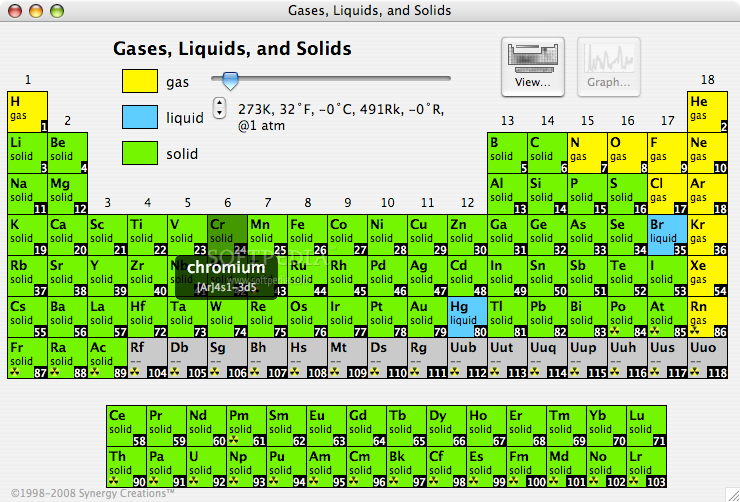
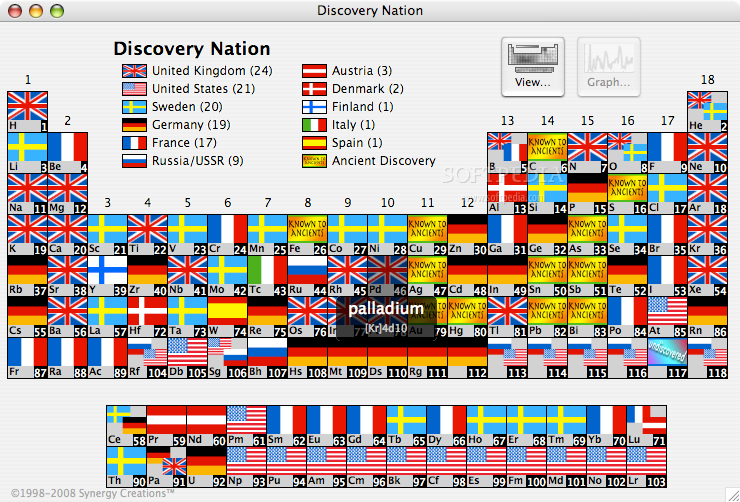
2011
Periodicity Periodic Table
From Wikipedia, a PT showing the main periodic trends:
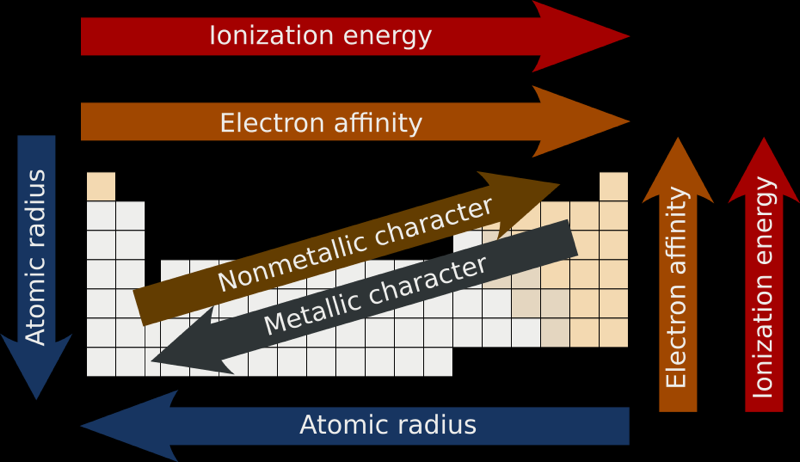
2017
PeriodicStats
A periodic table with a minimalist design ethic, optimized for phones and tablets:

2004
Phase State: Solid, Liquid, Gas at 20°C & 700°C
By Mark Leach
2019
Physical Origin of Chemical Periodicities in the System of Elements
From de Gruyter: Physical origin of chemical periodicities in the system of elements, Chang-Su Cao, Han-Shi Hu, Jun Li* and W. H. Eugen Schwarz*, Pure Appl. Chem. 2019; 91(12).
Published Online: 2019-11-30 | DOI: https://doi.org/10.1515/pac-2019-0901 (open access)
Abstract:
The Periodic Law, one of the great discoveries in human history, is magnificent in the art of chemistry. Different arrangements of chemical elements in differently shaped Periodic Tables serve for different purposes. "Can this Periodic Table be derived from quantum chemistry or physics?" can only be answered positively, if the internal structure of the Periodic Table is explicitly connected to facts and data from chemistry.
Quantum chemical rationalization of such a Periodic Tables is achieved by explaining the details of energies and radii of atomic core and valence orbitals in the leading electron configurations of chemically bonded atoms. The coarse horizontal pseudo-periodicity in seven rows of 2, 8, 8, 18, 18, 32, 32 members is triggered by the low energy of and large gap above the 1s and nsp valence shells (2 ≤ n ≤ 6 !). The pseudo-periodicity, in particular the wavy variation of the elemental properties in the four longer rows, is due to the different behaviors of the s and p vs. d and f pairs of atomic valence shells along the ordered array of elements. The so-called secondary or vertical periodicity is related to pseudo-periodic changes of the atomic core shells.
The Periodic Law of the naturally given System of Elements describes the trends of the many chemical properties displayed inside the Chemical Periodic Tables. While the general physical laws of quantum mechanics form a simple network, their application to the unlimited field of chemical materials under ambient 'human' conditions results in a complex and somewhat accidental structure inside the Table that fits to some more or less symmetric outer shape. Periodic Tables designed after some creative concept for the overall appearance are of interest in non-chemical fields of wisdom and art.
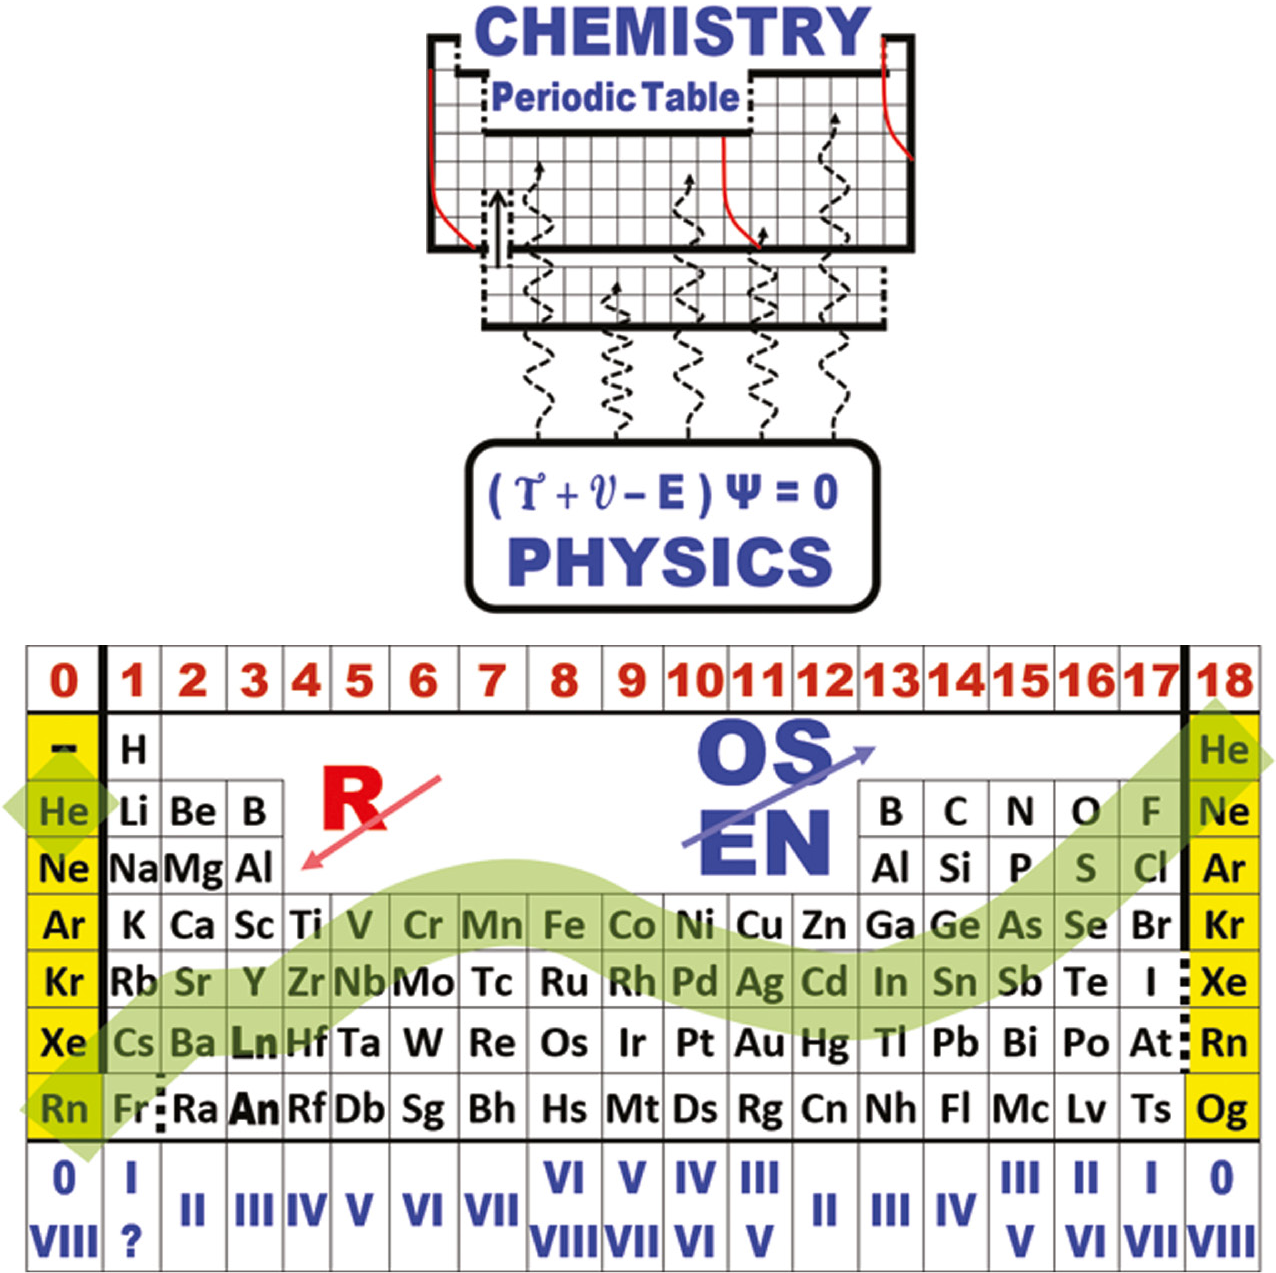
2016
Pictures & Words
A couple of periodic tables from Keith Enevoldsen with information shown in Pictures & Words:

Thanks to Eric Scerri for the tip!
See the website EricScerri.com and Eric's Twitter Feed
2018
Places of the Periodic Table
An interactive, searchable Google map of places associated with the developers of the periodic table and with the chemical elements with links to further information brought to you by Carmen Giunta and James Marshall, with the encouragement of the ACS Division of the History of Chemistry (HIST), to mark the International Year of the Periodic Table (IYPT). This is an interactive searchable map of places associated with the developers of the periodic table and with the chemical elements with links to further information.
Examples include places where elements were discovered or synthesized, mineral sources of elements, places where discoverers of chemical periodicity worked, and places for which elements were named. Each entry contains links to further information about the person, place, or event described. The type of site is indicated (for example, lab, residence, mineral source, etc.), as well as whether (to the best of our knowledge) the historical site still exists at the location. For more information on the type of site, please consult this key to the map's fields. The map is intended for educational and informational purposes only, and is not meant as a travel guide. If you wish to visit a site on this map, please consult other resources to confirm access, and use common sense. (Read more here.)

Thanks to Eric Scerri for the tip! See the website EricScerri.com and Eric's Twitter Feed.
1997
Ptable
Ptable is an excellent, data filled, dynamic periodic table with an intuitive and flexible interface, available in 50 languages:
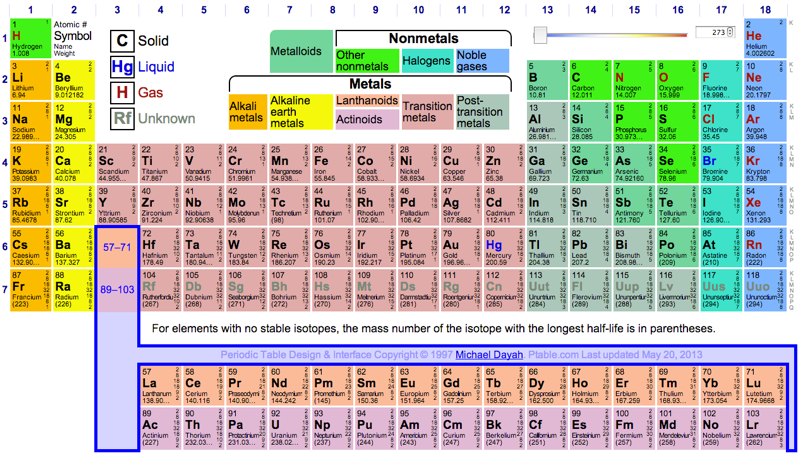
2006
Radioactivity Periodic Table
A periodic table showing the elements that have no stable isotopes, so that all samples are radioactive:
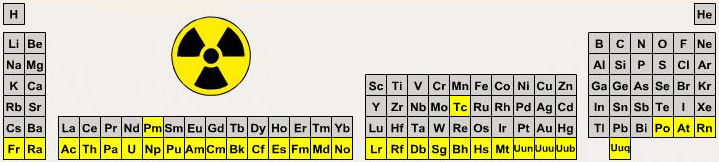
By Mark Leach
2010
Recipe For A Human Shirt
By Sean Fallon and available from Fashionably Geek, A Recipe For Humans Shirt:
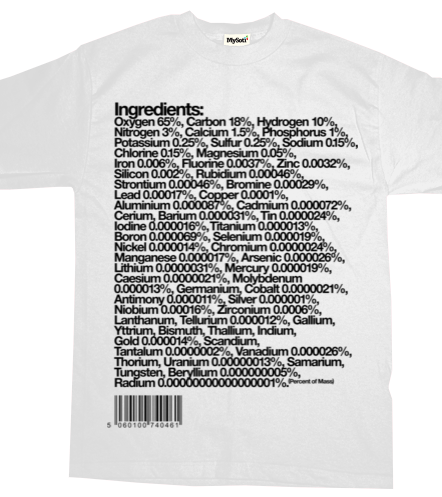
2016
Rejected Element Names, Periodic Table of
A periodic table of rejected element names by Andy Brunning's Compound Interest:
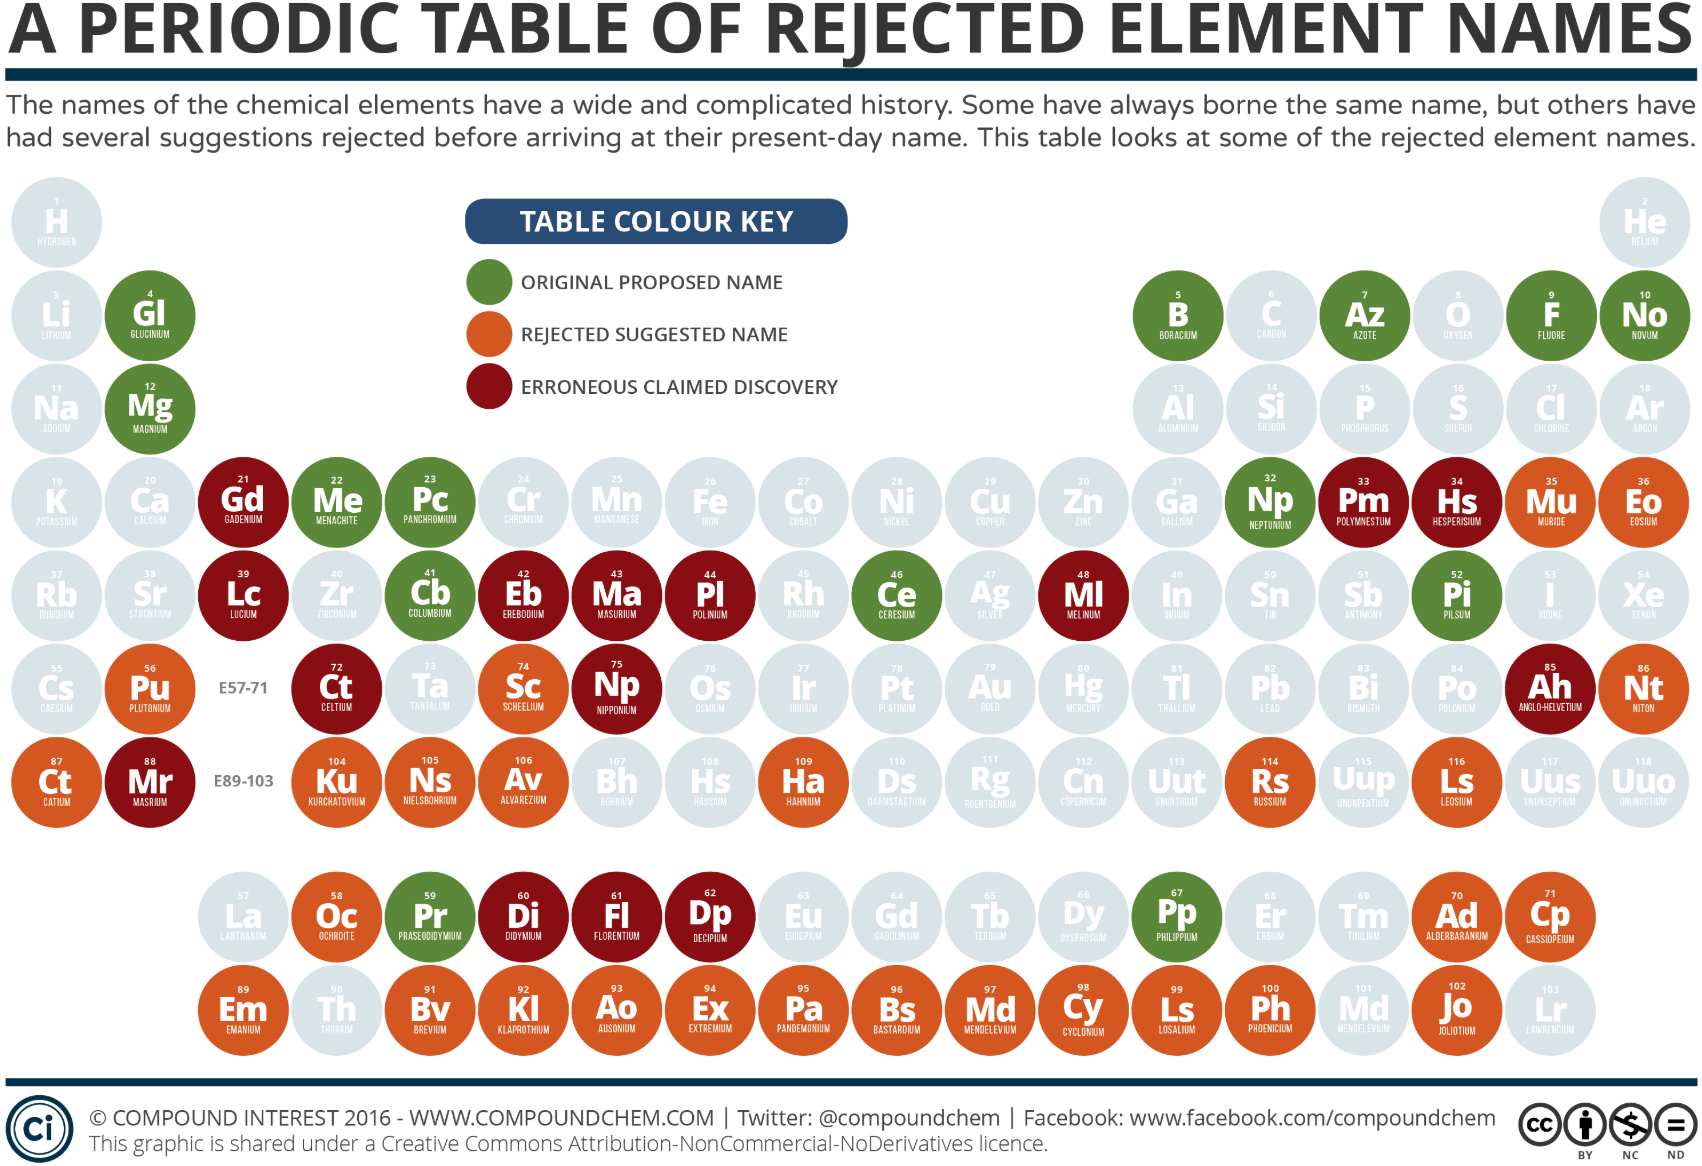
Thanks to Eric Scerri for the tip!
See the website EricScerri.com and Eric's Twitter Feed.
2017
Restrepo's Similarity Landscape
Building Classes of Similar Chemical Elements from Binary Compounds and Their Stoichiometries by Guillermo Restrepo, Chapter 5 from: Elements Old and New: Discoveries, Developments, Challenges, and Environmental Implications p 95-110.
From the abstract:
Similarity is one of the key concepts of the periodic table, which was historically addressed by assessing the resemblance of chemical elements through that of their compounds. A contemporary approach to the similarity among elements is through quantum chemistry, based on the resemblance of the electronic properties of the atoms involved. In spite of having two approaches, the historical one has been almost abandoned and the quantum chemical oversimplified to free atoms, which are of little interest for chemistry. Here we show that a mathematical and computational historical approach yields well-known chemical similarities of chemical elements when studied through binary compounds and their stoichiometries; these similarities are also in agreement with quantum chemistry results for bound atoms. The results come from the analysis of 4,700 binary compounds of 94 chemical elements through the definition of neighbourhoods for every element that were contrasted producing similarity classes. The method detected classes of elements with different patterns on the periodic table, e.g. vertical similarities as in the alkali metals, horizontal ones as in the 4th-row platinum metals and mixed similarities as in the actinoids with some transition metals. We anticipate the methodology here presented to be a starting point for more temporal and even more detailed studies of the periodic table.
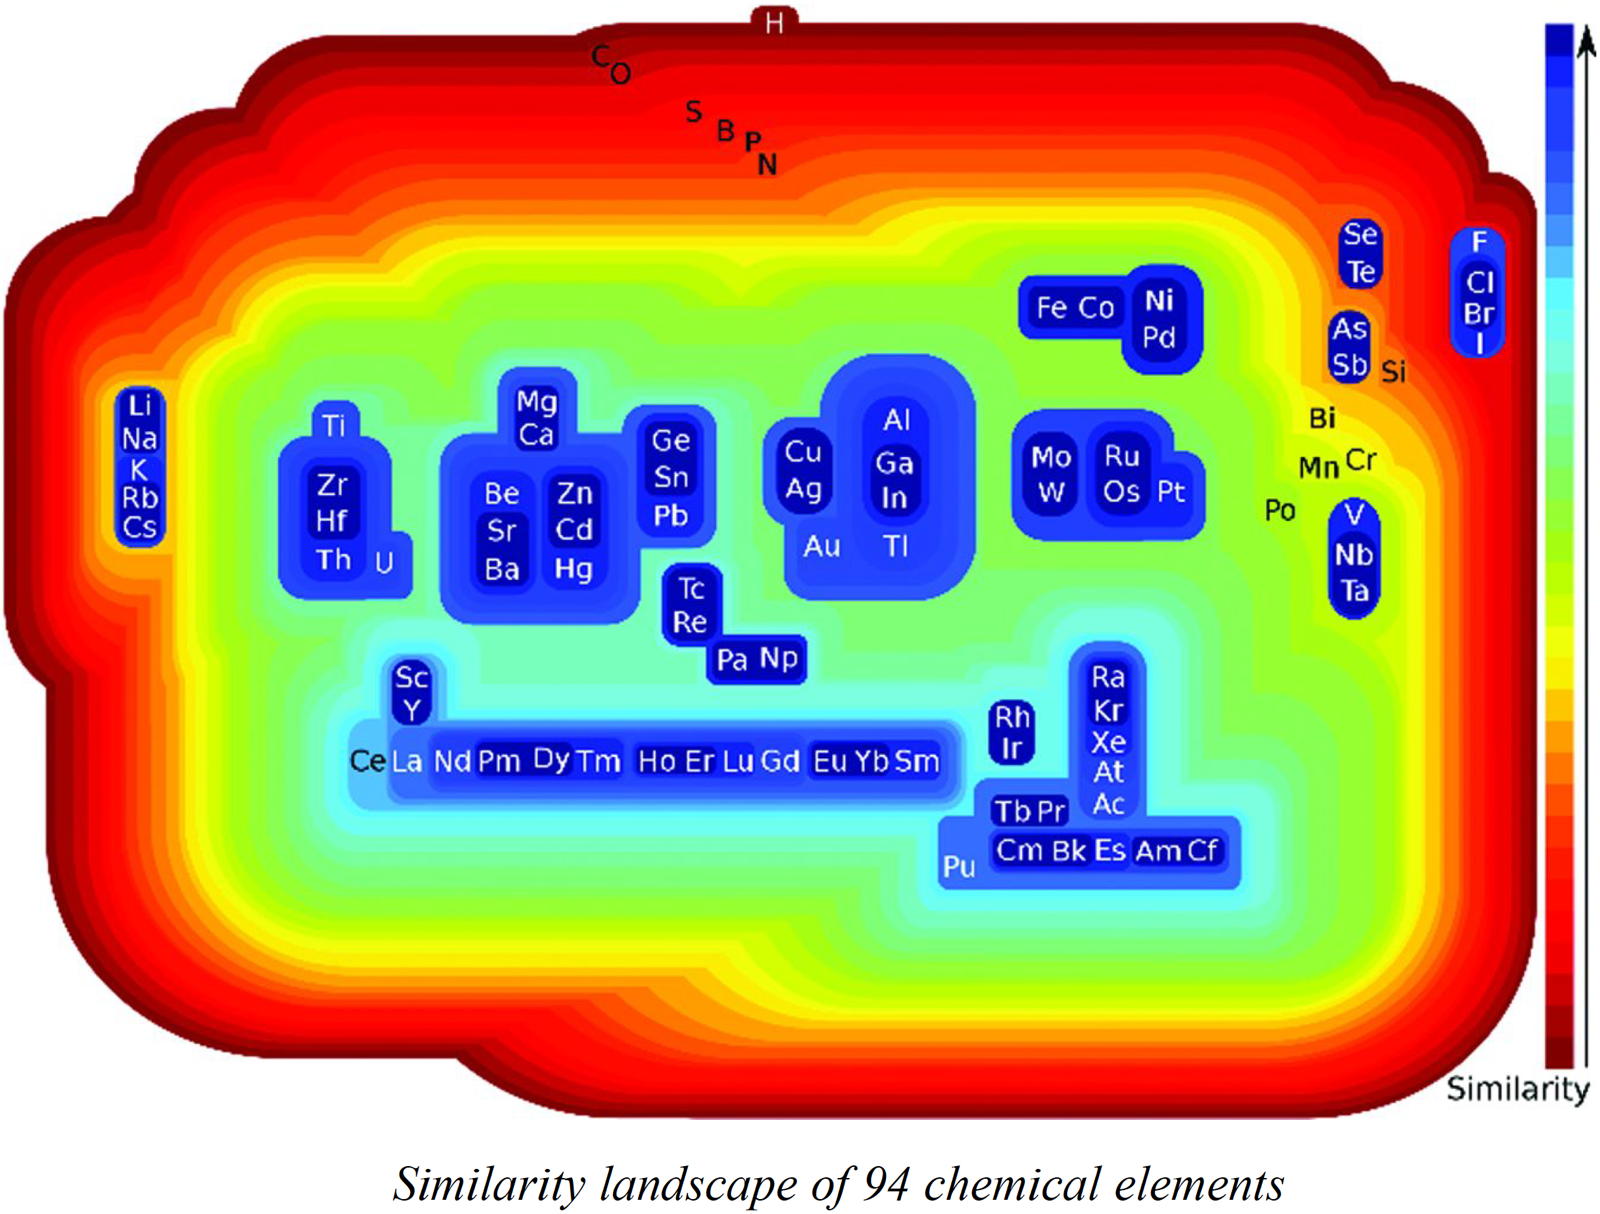
Thanks to René for the tip!
2013
RSC Visual Elements Periodic Table: Alchemy
From the RSC Website: "Alchemists are often described as the first chemists. They developed an extraordinary language (rather than the chemical symbols we use today) to describe all manner of things, from chemical reactions to philosophical tenets. Click on ‘What is Alchemy?’ to learn about the three aims of the alchemists. Click on each of the alchemical symbols for more information and to see alternative symbols."
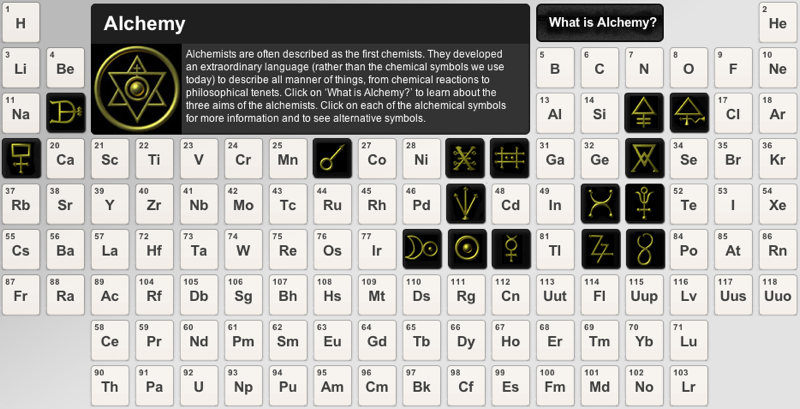
2014
Schaeffer's IUPAC Periodic Table Quantum Mechanics Consistent
IUPAC Periodic Table Quantum Mechanics Consistent, Bernard Schaeffer, Journal of Modern Physics, Vol. 5, No. 3, February 24, 2014
DOI: 10.4236/jmp.2014.53020
Abstract: Most periodic tables of the chemical elements are between 96% and 100% in accord with quantum mechanics. Three elements only do not fit correctly into the official tables, in disagreement with the spherical harmonics and the Pauli exclusion principle. Helium, belonging to the s-block, should be placed beside hydrogen in the s-block instead of the p-block. Lutetium and lawrencium belonging to the d-block of the transition metals should not be in the f-block of the lanthanides or the actinoids. With these slight modifications, the IUPAC table becomes quantum mechanics consistent.

2012
Schematic Periodic Table of Double-Charged Cations
N. S. Imyanitov / The Periodic Law. Formulations, Equations, Graphic Representations, Russian Journal of Inorganic Chemistry, Vol. 56 (14), 2183 - 2200, 2011 (In English), DOI: 10.1134/S0036023611140038
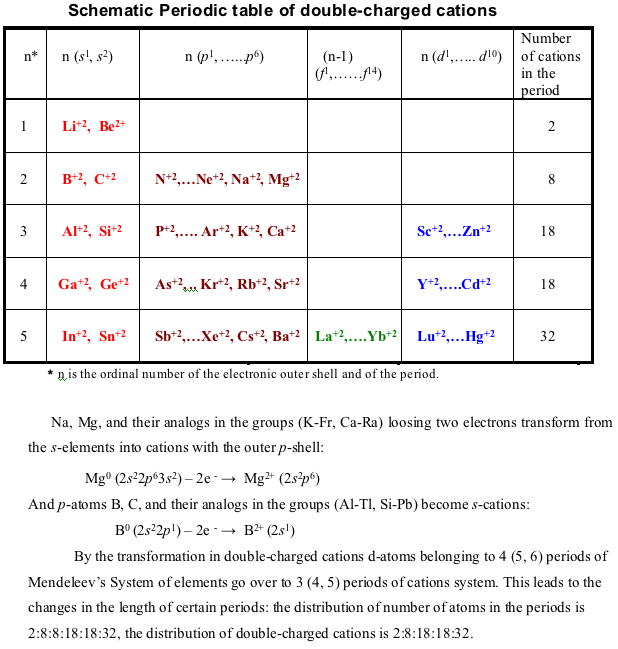
2010
Schwarz & Rich's Periodic Table
W. H. Eugen Schwarz & Ronald L. Rich, Theoretical Basis and Correct Explanation of the Periodic System: Review and Update, J. Chem. Educ. 2010, 87, 4, 435-443. DOI: https://doi.org/10.1021/ed800124m
Periodic table, representing some aspects of the periodic system of chemical elements (mainly to support the discussions in [the attached] article, perhaps not for the classroom):
- Element symbol and element number Z = 0 – 118
- Period number n
- Group number G, related to the number of valence electrons
- Typical electronic valence configuration of the bound atoms ("neighbour configurations" such as s1p3 instead of s2p2 may be more important for some atoms in the group)
- Characteristic valence orbitals of highest angular momentum
- Chemical group name
- (Elements that do not belong to the group are put in parentheses.)
- The dashed lines indicate alternative or controversial group assignments, they are not meant to represent the authors' views.
Note that the richness of chemistry sometimes prevents clear-cut classifications and assignments.
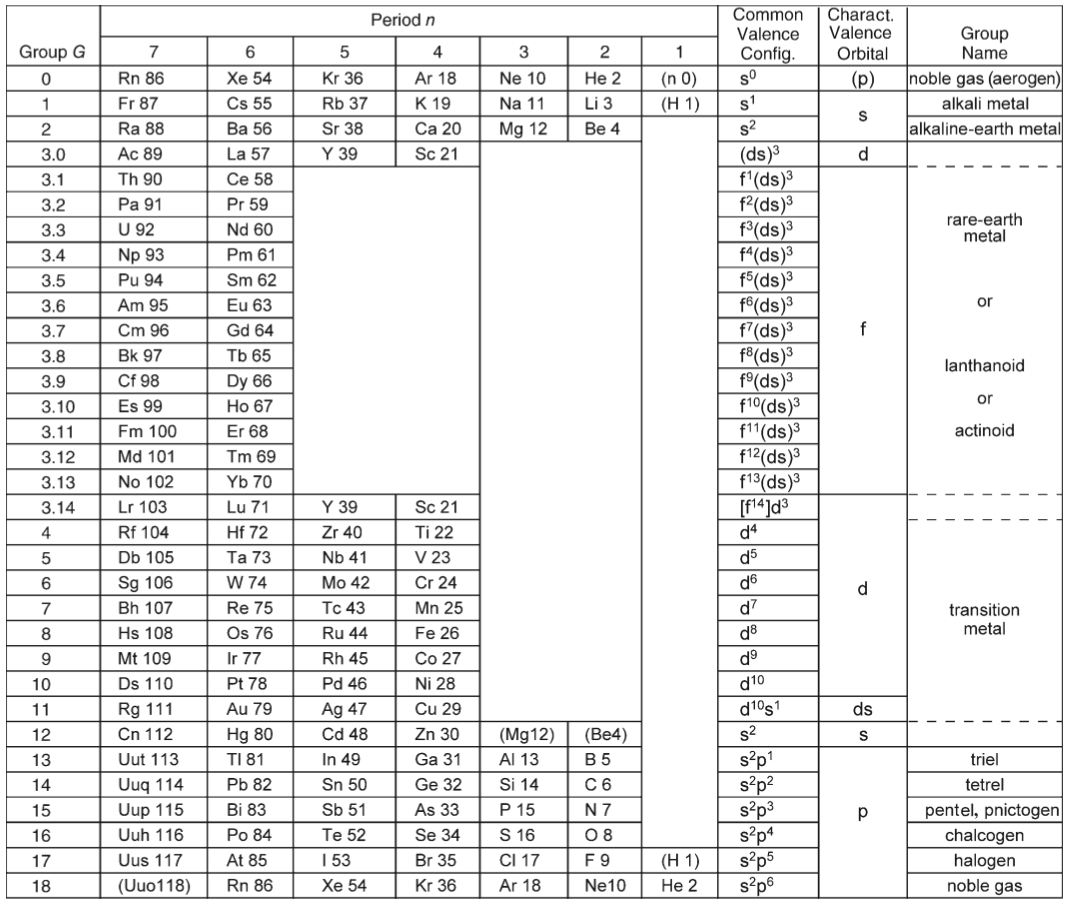
2013
Scientific American Interactive Periodic Table
From Scientific American, The Elements Revealed: An Interactive Periodic Table.
Many elements have links with articles on individual elements which first appeared in Nature Chemistry and were not previously available on-line:
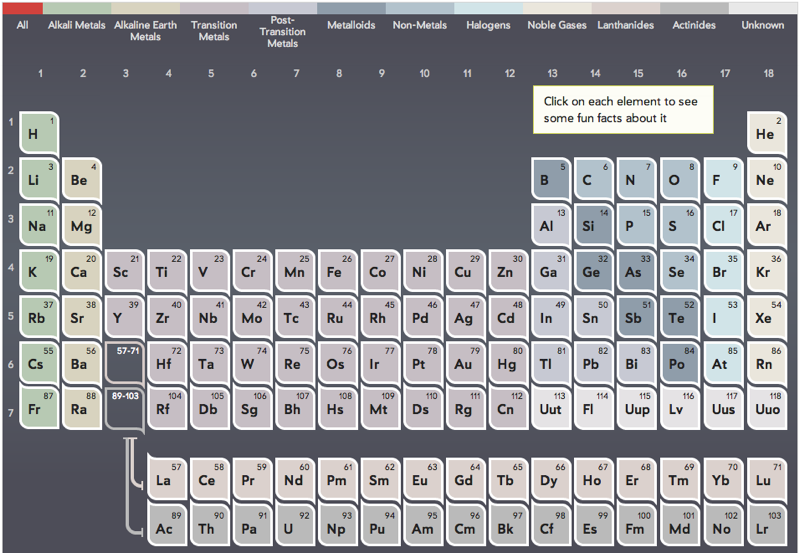
Thanks to Eric Scerri for the tip!
See the website EricScerri.com and Eric's Twitter Feed.
1983
Seawater Periodic Table
A periodic table of references to analytical chemistry papers associated with the elements. If you want to know how much gallium in seawater, this would be a good place to start:
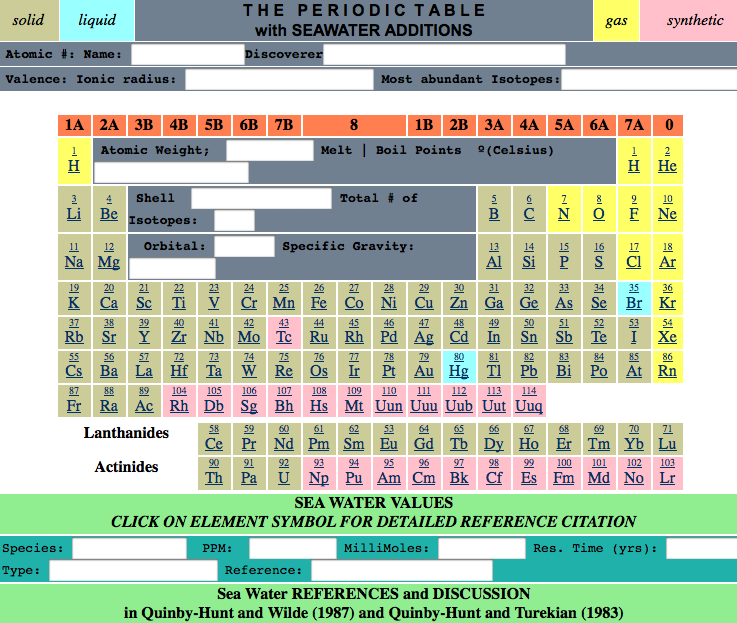
1969
Seel-Klechkovskii Version of Madelung's Rule for Orbital Filling
Seel F., Bild der Wissenschaft, 6, 44 (1969), a monthly popular scientific journal.
- Klechkovskii VM, Dokl. Akad. Nauk. SSSR, 135. 855 (1980). [In Russian]
- Klechkovskii VM, Zh. Eksperim. i. Teoret. Fiz., 41. 465 (1961). [In Russian]
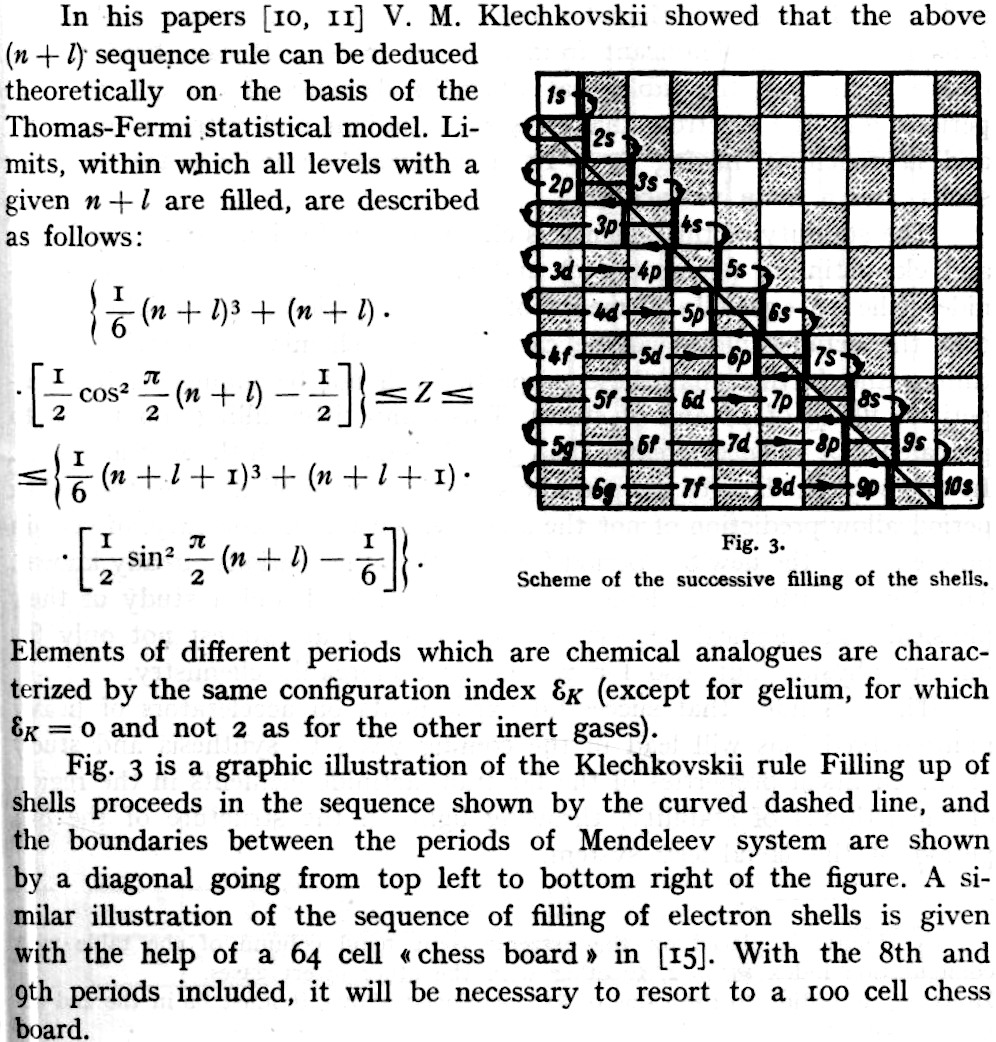
Thanks to René for the tip!
2023
Semicircular Hybrid Chart of the Nuclides
Nawa Nagayasu has produced a new version of the Segrè Chart of the Nuclides.
Nawa writes:
"The chart has the number of neutrons on the [curved] horizontal axis and the number of protons (atomic number) on the vertical axis. I used the IAEA colour coding [scheme]. JAEA's half-life ranks are indicated by simple numbers, not rounded frames.
"In order to fit the whole chart into a semicircle, the axis representing the number of neutrons was made a spiral-like curve. For clarity, the number of neutrons is shown in the middle of each curve."
Yuri Oganessian has commented:
"Nawa Nagayasu is an original and talented designer. After all, it is not easy to work with 118 elements, but now also with isotopes, of which there are more than 3000. The fan design looks attractive and this is very important. This will make people, especially school age, guess the numbers that are written there. So they will gradually delve into the content of the Table, a truly brilliant creation."
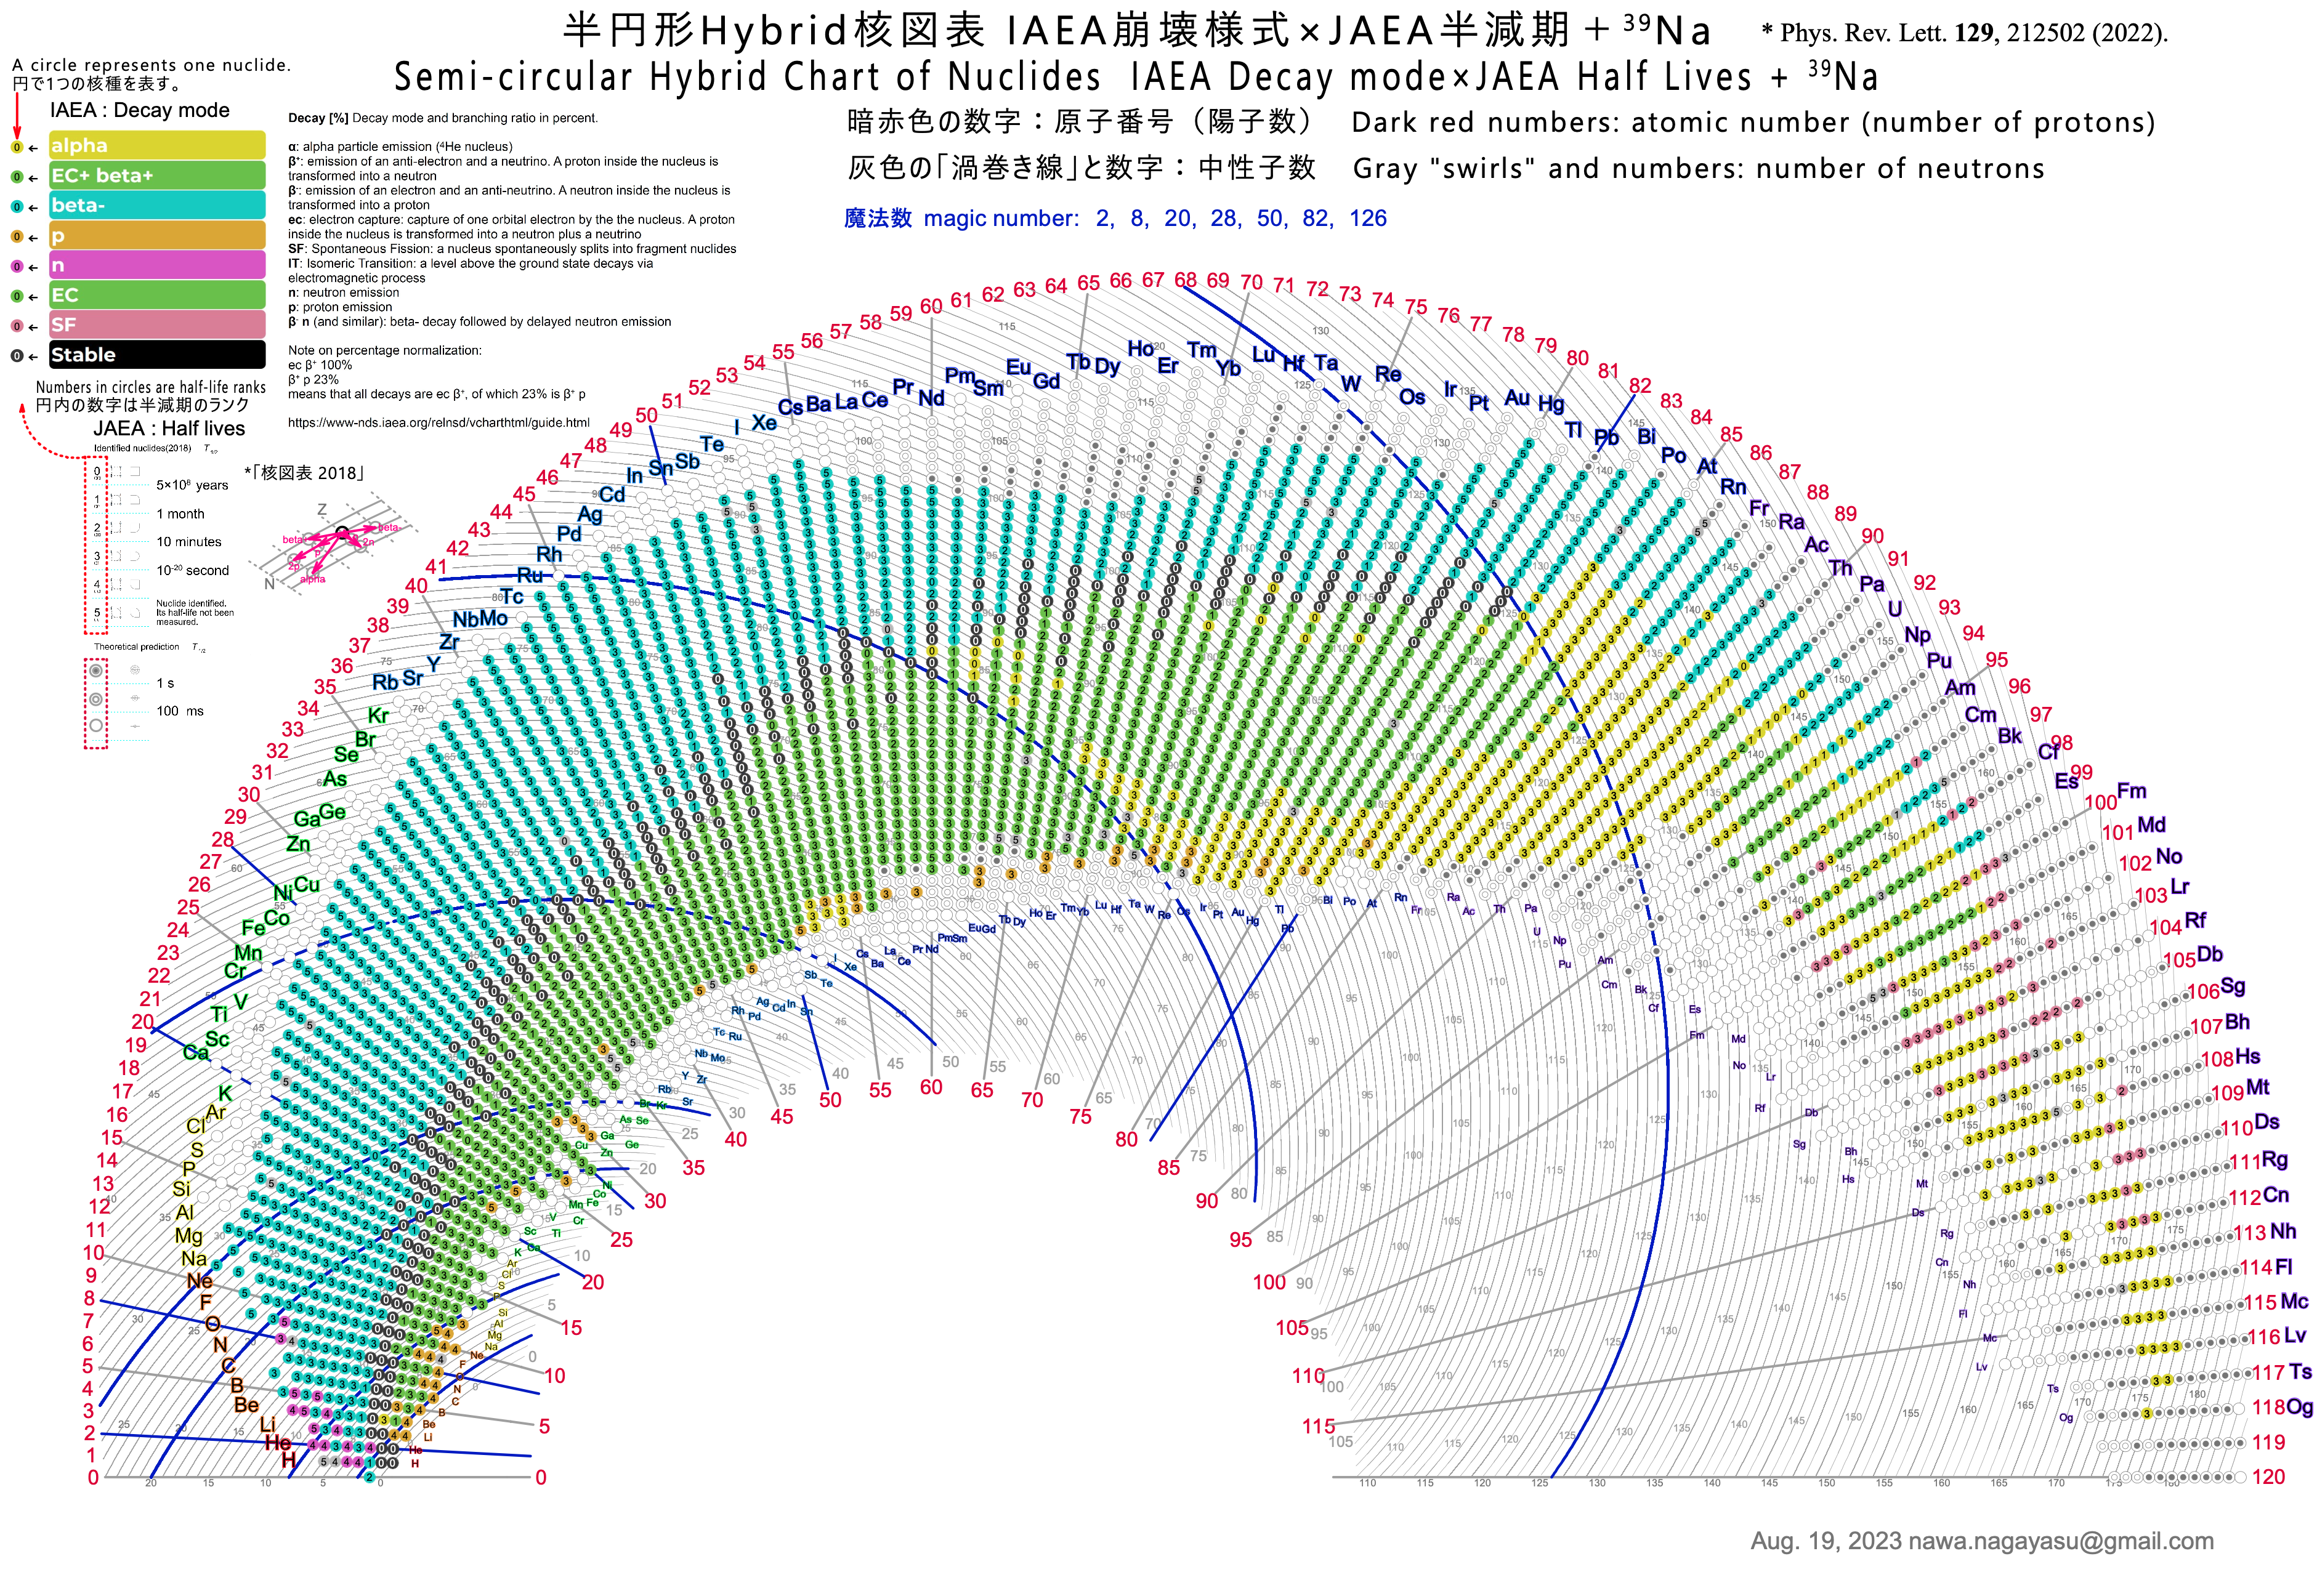
1960
Sistema Periodico Degli Elementi
An Italian Periodic Table in Science Museum, Turin (Estimated date 1960).
Note how the noble gases (as Group 0) are shown down the left hand side of the table:

Thanks to Eric Scerri for the tip!
See the website EricScerri.com and Eric's Twitter Feed
2005
Smart Elements
Smart Elements, at smart-elements.com, is a company selling physical samples of chemical elements for research, education & collection.
- High purity Elements for Science, Laboratory and Education
- High-End element samples for collectors, museums, lectures and exhibitions
- Free picture service for educational purposes
- Professional advisory service
- Purchase of Elements
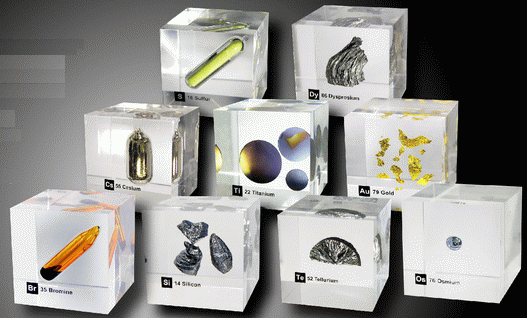
Smart Elements sell numerous examples of all the naturally occuring elements. For example they sell 26 copper, Cu, products including samples in acrylic blocks, vials and bottles:
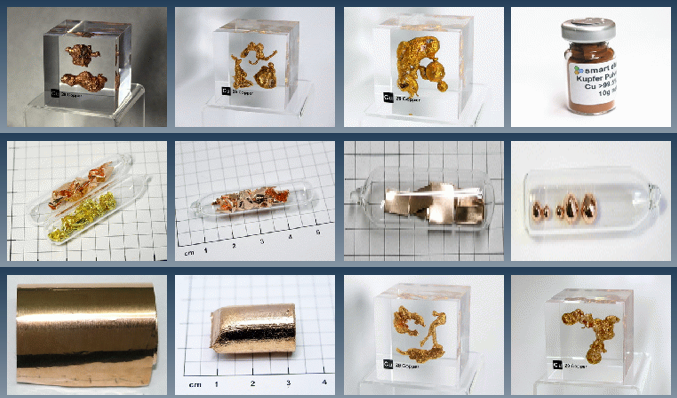
2000
Sneath's Dendtogram
Sneath, P., Numerical Classification of the Chemical Elements and Its Relation to the Periodic System. Foundations of Chemistry 2, 237–263 (2000).
Abstract: "A numerical classification was performed on 69 elements with 54 chemical and physicochemical properties... Only 15 properties were scorable for the noble gases, but despite the paucity of properties reflecting chemical reactivity, analysis of the 69 elements on these properties still showed the major features seen from the full set."
Sneath writes:
"The UPGMA tree shows three major clusters at the 70% similarity level:
1. Hydrogen, noble gases, reactive nonmetals and halogens.
2. A large cluster of less reactive metals and metalloids, with a few nonmetals.
3. A cluster of highly reactive metals.These major clusters are almost consistent with the blocks based on electron shells. The first cluster belongs to the p-block plus hydrogen. The second belongs to the d-block together with a few p-block elements. The third consists of the s-block plus aluminum from the p-block.
Cluster 1: There are three subclusters. 1a. This contains hydrogen and the noble gases."
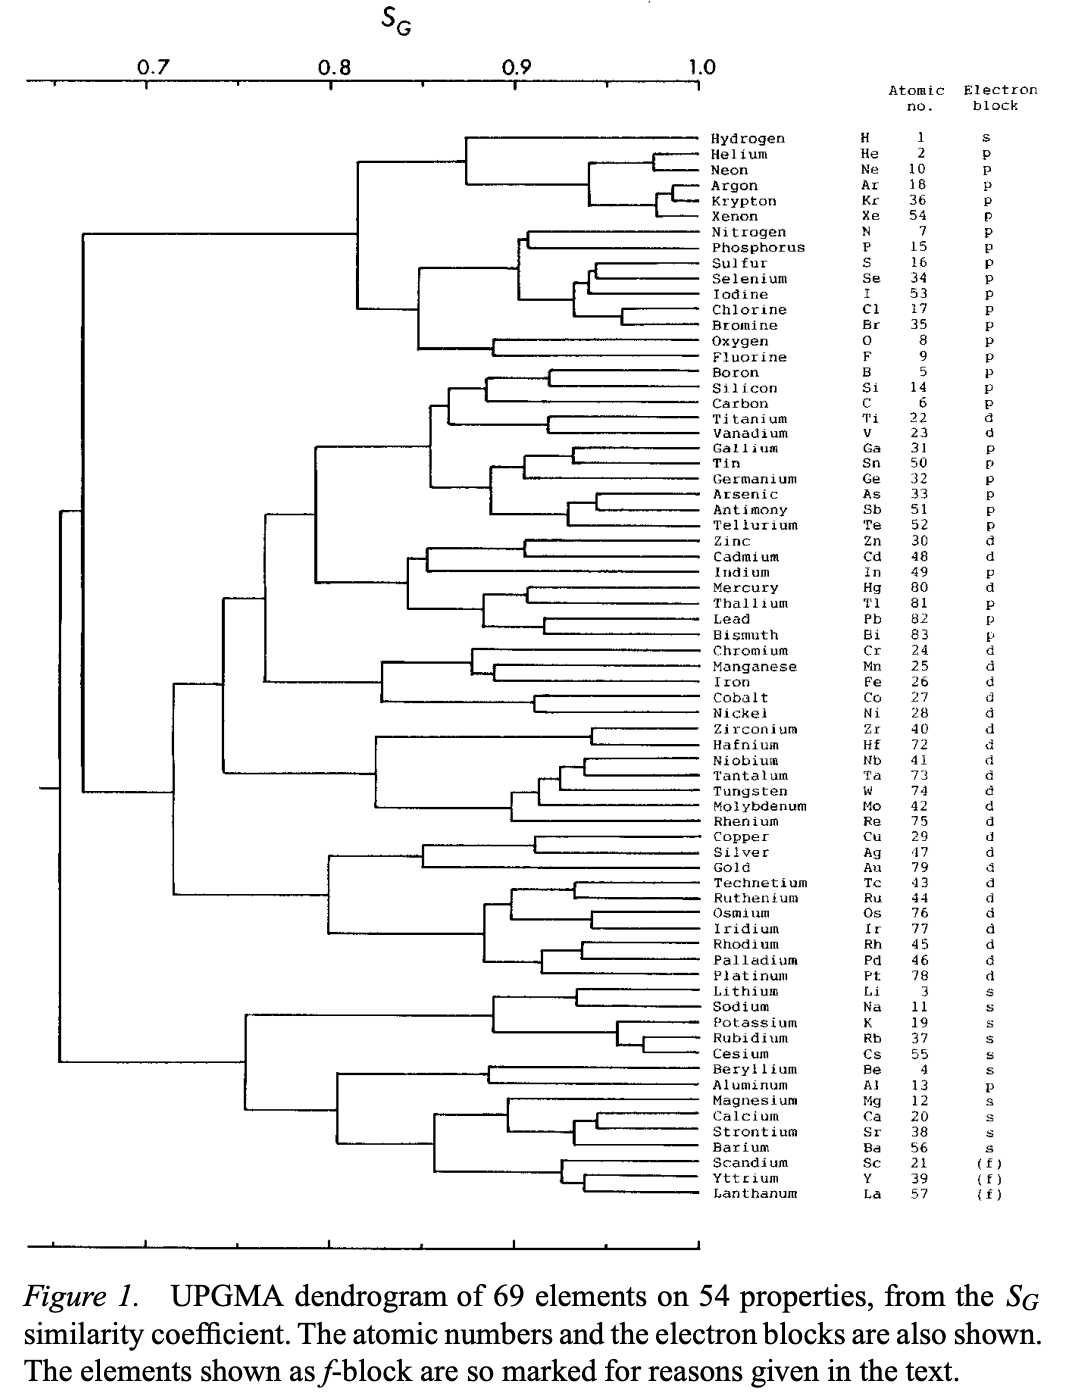
Thanks to René for the tip!
2013
Spider Chart of The Periodic Table of Chemical Elements
A Spider Chart linking together various ideas about the Periodic Table of the Chemical Elements by Roy Alexander (of Alexander Arrangement fame).
Click here to embiggen the image:
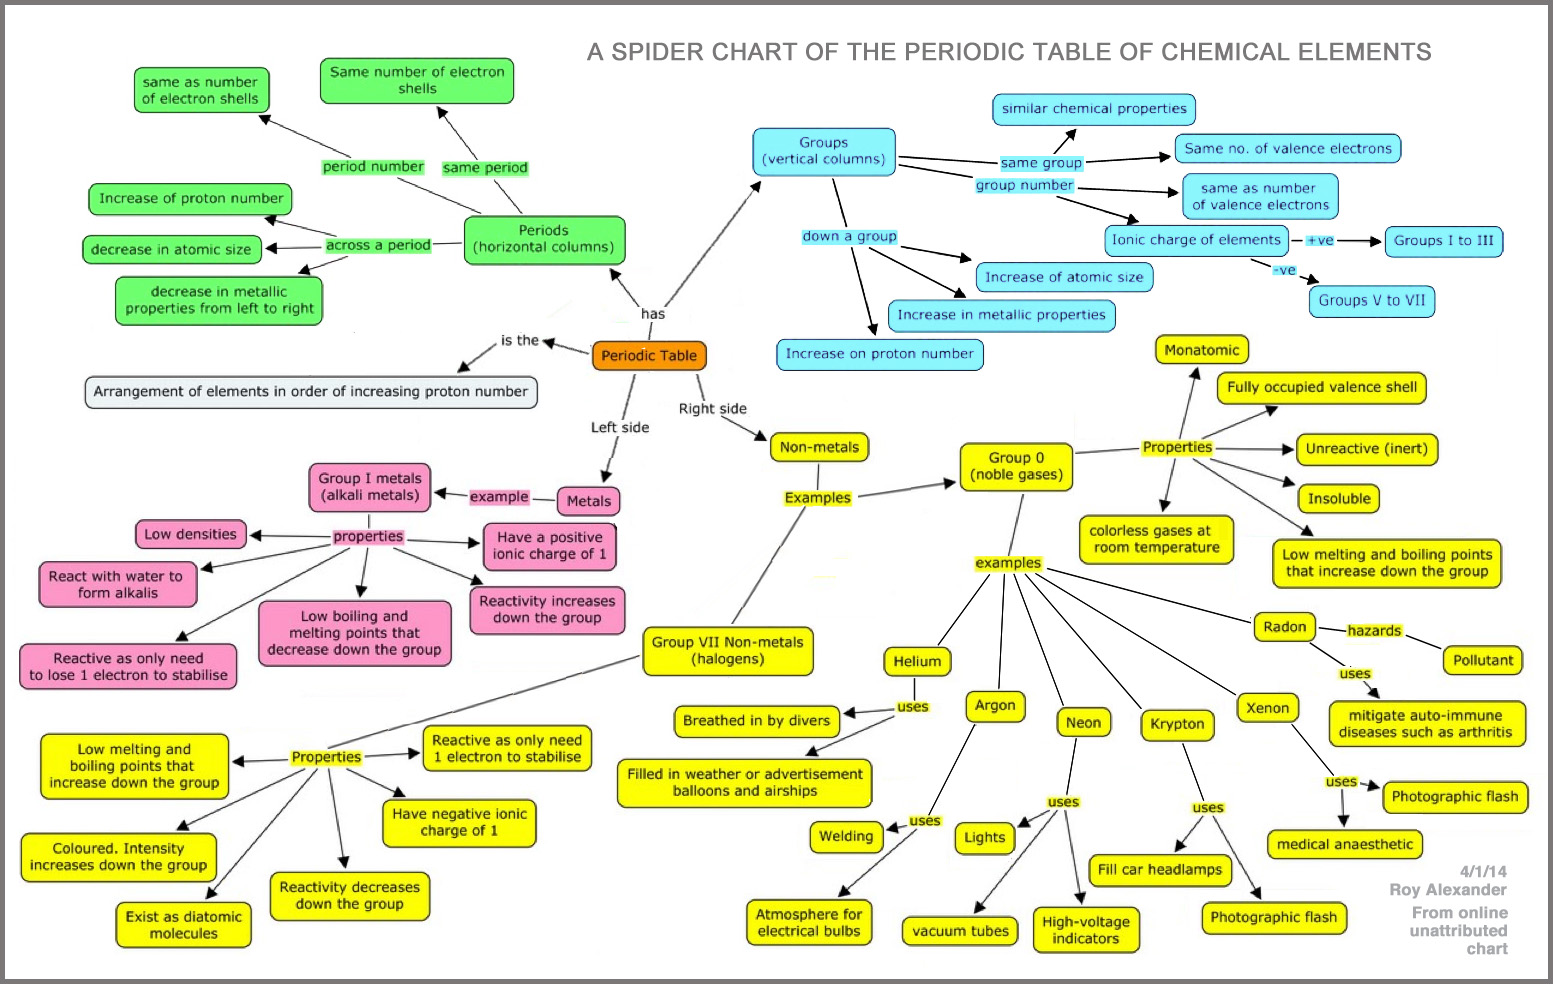
2003
Stable Isotopes, Periodic Table of
From Boeyens, JCA 2003, J. Radioanal. Nucl. Chem., 257, 33 a periodic table of the 264 stable isotopes arranged as an 11 x 24 matrix.
Click the image to enlarge:
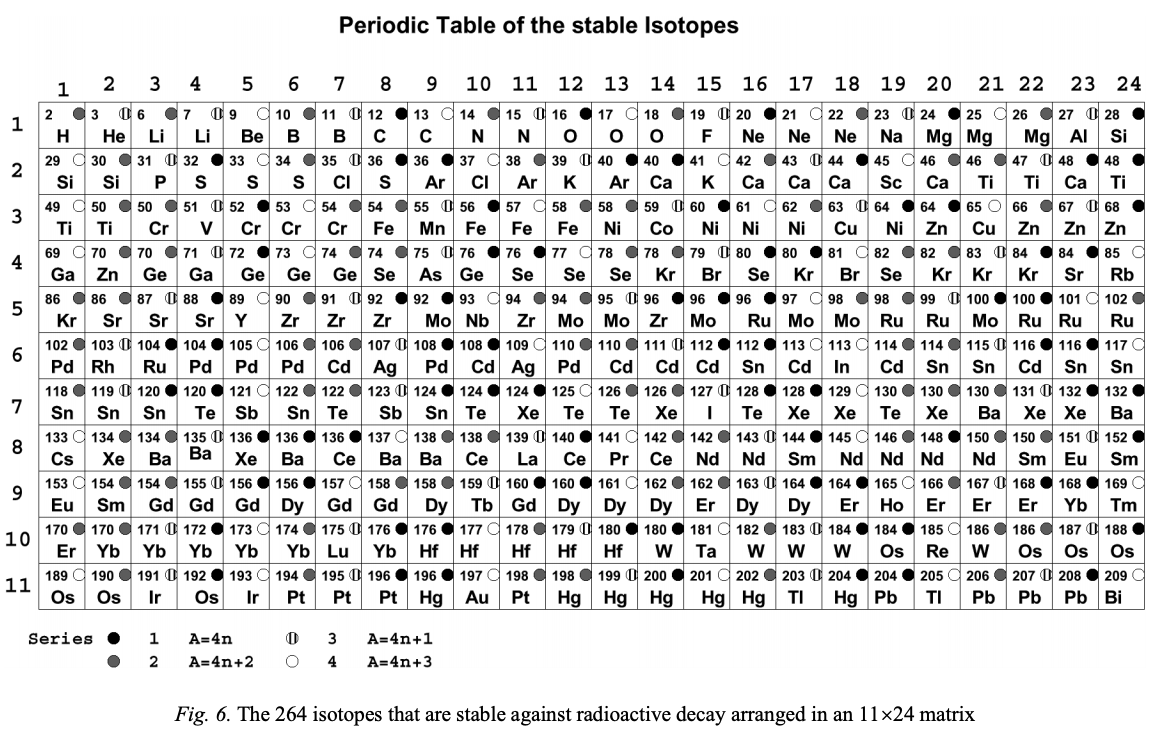
Thanks to René for the tip!
2015
STEM Sheets Printable (& Customizable) Periodic Table of Elements
From STEM Sheets – where "STEM" stands for Science, Technology Engineering & Maths – a customizable and printable periodic table.
Printable Features
- Include names, symbols, atomic numbers, weights, periods, groups, electrons/shell
- Include Lutetium (Lu) and Lawrencium (Lr) in the d-block if desired
- Related elements are color coded
- Print in color or black and white
- Print in A4 or US Letter page sizes
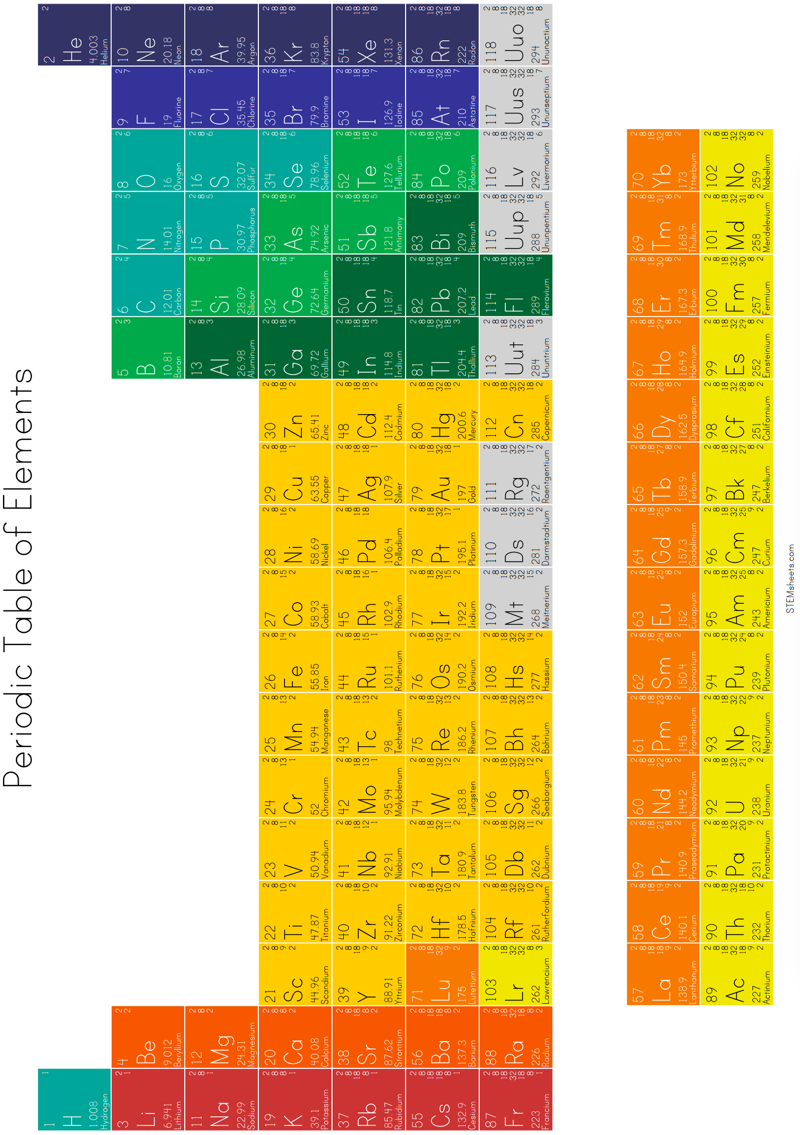
2005
Student's Periodic Table
Students are expected to know that in all equations hydrogen is molecular should [nearly always] be written as H2. Likewise, nitrogen is N2, oxygen O2, fluorine F2, chlorine Cl2, bromine Br2 and iodine I2. But somehow students are expected to know that molecular sulfur, S8, should be written as S and molecular phosphorus, P4, should be written as P.
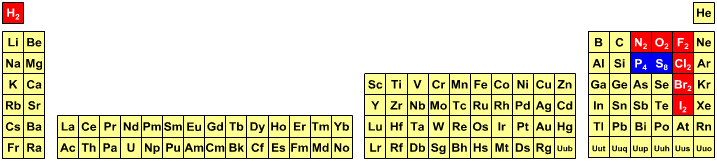
By Mark Leach
2011
Suggested Periodic Table Up To Z ≤ 172, Based on Dirac–Fock Calculations
A suggested periodic table up to Z ≤ 172, based on Dirac-Fock calculations on atoms and ions
Pekka Pyykkö
Phys. Chem. Chem. Phys., 2011,13, 161-168
DOI: 10.1039/C0CP01575J
Extended Average Level (EAL) Dirac–Fock calculations on atoms and ions agree with earlier work in that a rough shell-filling order for the elements.
[This new] Periodic Table develops further that of Fricke, Greiner and Waber [Theor. Chim. Acta 1971, 21, 235] by formally assigning the elements 121–164 to (nlj) slots on the basis of the electron configurations of their ions. Simple estimates are made for likely maximum oxidation states, i, of these elements M in their MXi compounds:
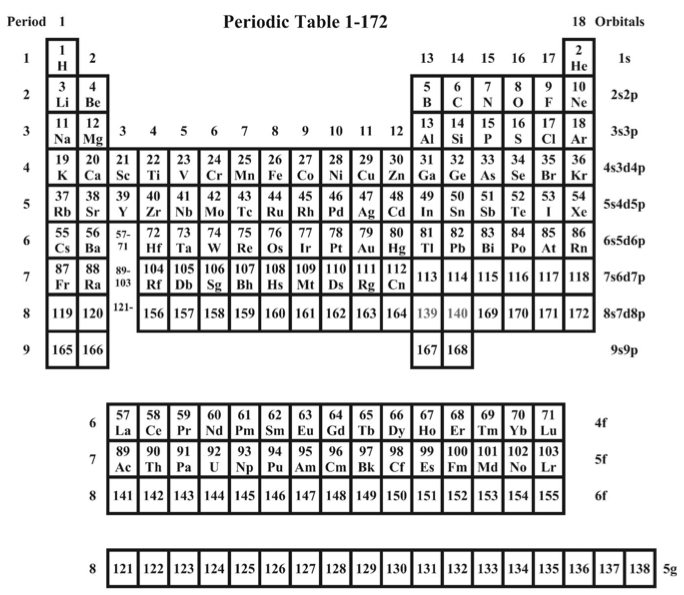
2006
Superconducting Elements
A periodic table showing which elements become superconducting at low temperature.
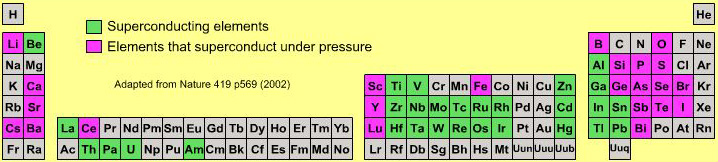
By Mark Leach
2018
Superconductivity of Hydrides Periodic Table
Scientists from Moscow Institute of Physics and Technology and Skoltech have demonstrated the high-temperature superconductivity of actinium hydrides and discovered a general principle for calculating the superconductivity of hydrides based on the periodic table alone. The results of their study were published in The Journal of Physical Chemistry Letters.
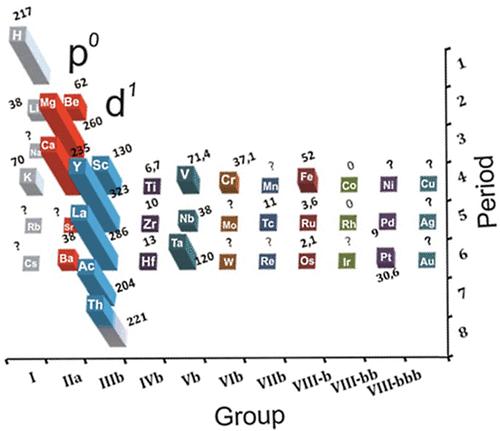
Thanks to Eric Scerri for the tip! See the website EricScerri.com and Eric's Twitter Feed.
2015
Sweetners: a Periodic Table
A guide to sweeteners By Patterson Clark and Lazaro Gamio, Published: March 2, 2015
Too much sugar can be detrimental to health, rotting teeth, building fat, damaging blood vessels and stressing out the system that regulates blood sugar. Some people turn to artificial sweeteners, but those are under increasing suspicion of creating metabolic problems, such as diabetes and obesity.
Natural alternative sweeteners exist, but even they have pitfalls if consumed in excess.
This sweetners periodic table below, click to enbiggen, charts the wide variety of sweeteners available in the United States, either in bulk amounts or as additives in food.
Not listed are super-sweet-tasting, zero-calorie proteins from several African fruits (monellin, brazzein and thaumatin), which have not been approved for use by the FDA. Also not included: banned or poisonous sweeteners, such as lead acetate, which ancient Romans made by cooking sour wine in lead pots.

Thanks to Marcus Lynch for the tip!
2017
Technology, Periodic Table of
Go to the website and hover over the element to see how it is used in modern technology:

2019
Term Symbol of the Chemical Elements
From Wikipedia (edited):
In quantum mechanics, the term symbol is an abbreviated description of the (total) angular momentum quantum numbers in a multi-electron atom. Each energy level of an atom with a given electron configuration is described by not only the electron configuration but also its own term symbol, as the energy level also depends on the total angular momentum including spin. The usual atomic term symbols assume LS coupling (also known as Russell-Saunders coupling or spin-orbit coupling). The ground state term symbol is predicted by Hund's rules.
Neutral atoms of the chemical elements have the same term symbol for each column in the s-block and p-block elements, but may differ in d-block and f-block elements, if the ground state electron configuration changes within a column.
For (far more) information refer to the Wikipedia Term Symbol page.
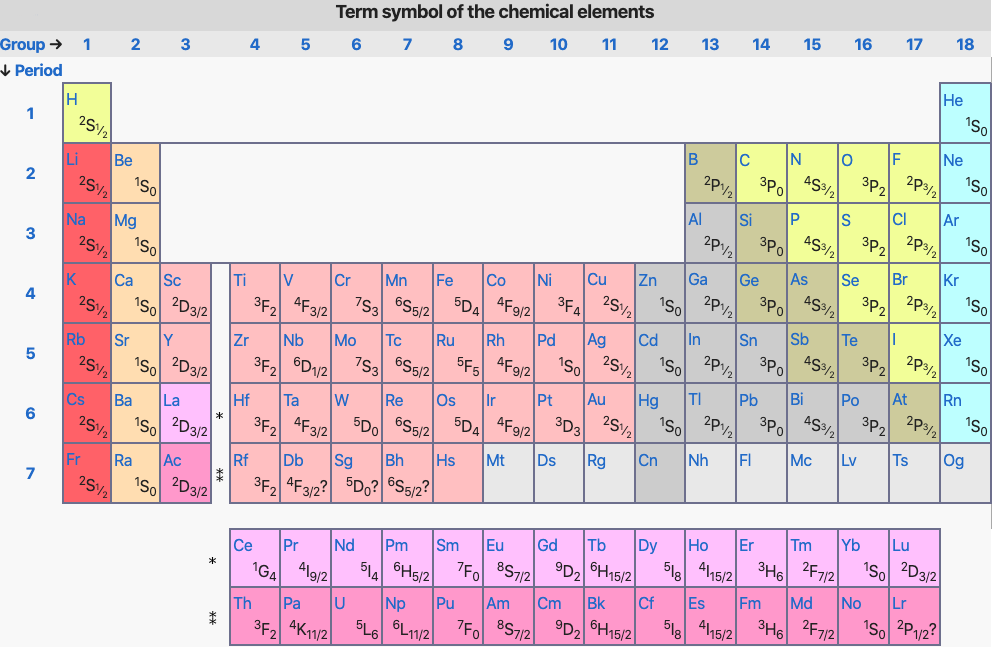
And from T.F. Yen, Chemistry for engineers, Imperial College Press, London, p. 53 (2008)
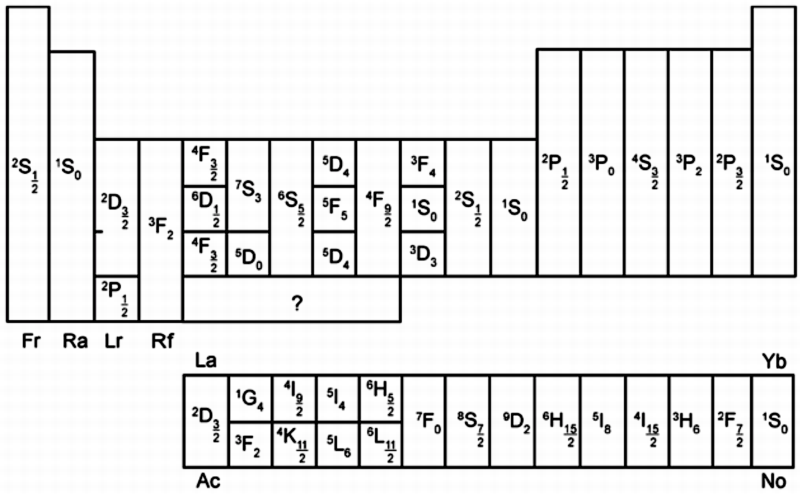
2018
Timelines, of The Periodic Table
By Steven Murov, a chronology of the events that have resulted in our present periodic table of the elements and a celebration of the 150th anniversary of the Mendeleev (birthday, 02/08/1834) periodic table (1869).
Recursively, the Murov website has many links to this [Chemogenesis] website.
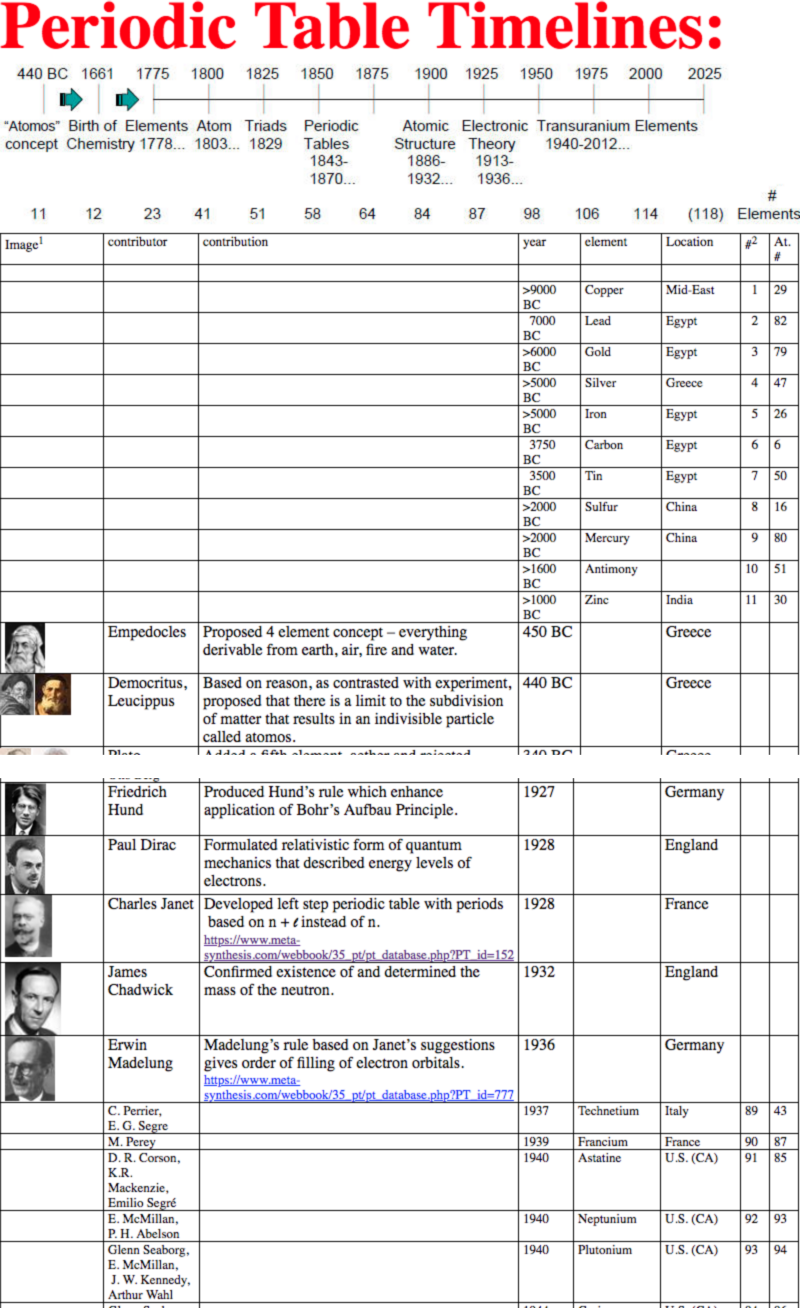
Thanks to Eric Scerri for the tip!
See the website EricScerri.com and Eric's Twitter Feed
2019
Toma's Periodic Tables
Henrique E. Toma writes:
"I will be delighted if I could have a chance to contribute for the fantastic moment expressed by 2019 IYPT.
"I am senior Professor of Chemistry at the University of São Paulo, and great Periodic Table enthusiast since the beginning of my career about 50 years ago. This interest actually came from my supervisor and mentor, Professor Henry Taube (Nobel Prize, 1983), who taught me the beauty of the elements."
"As an inorganic chemist, I have been collecting the elements and minerals for a long time, and I built up the Periodic Table with the real elements shown below. It is one of the attractions of the campus, and has been reported in many publications1. It was visited by colleagues from IUPAC, including the President. I wouldn't be surprised if it inspired IUPAC the similar Table exposed in Paris, this year. The difference is that our table is that it also places the typical minerals together with the elements, and I believe that this is very important aspect for teaching and discussing the history behind them:
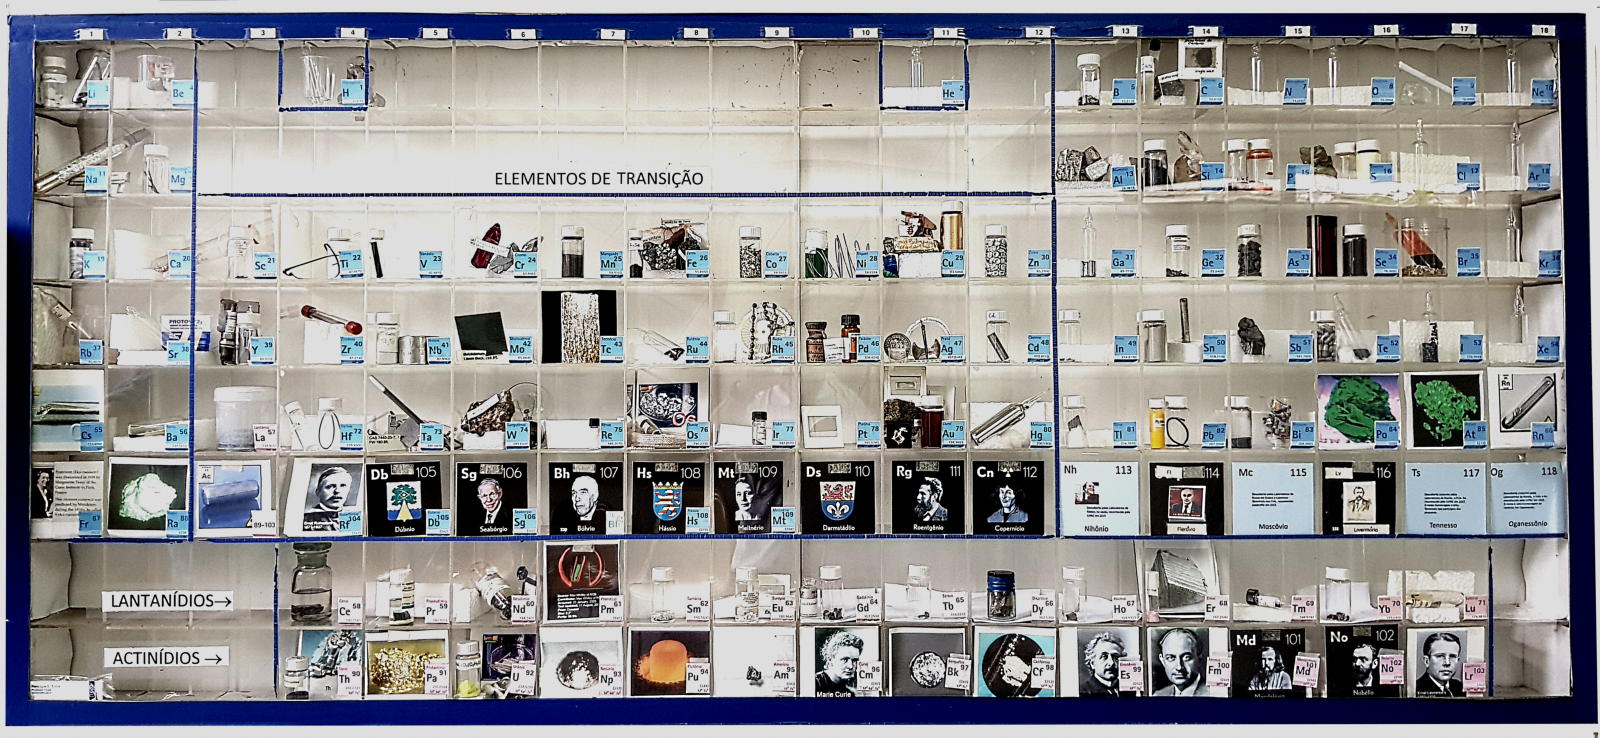
"Next, is my personal version of the IUPAC Periodic Table, shown in Figure 2, with the isotopes distributed in a column right to the element symbol. This Table is very practical, and particularly useful when you are dealing with mass spectrometry or isotopes. It is in my book of Elements2.
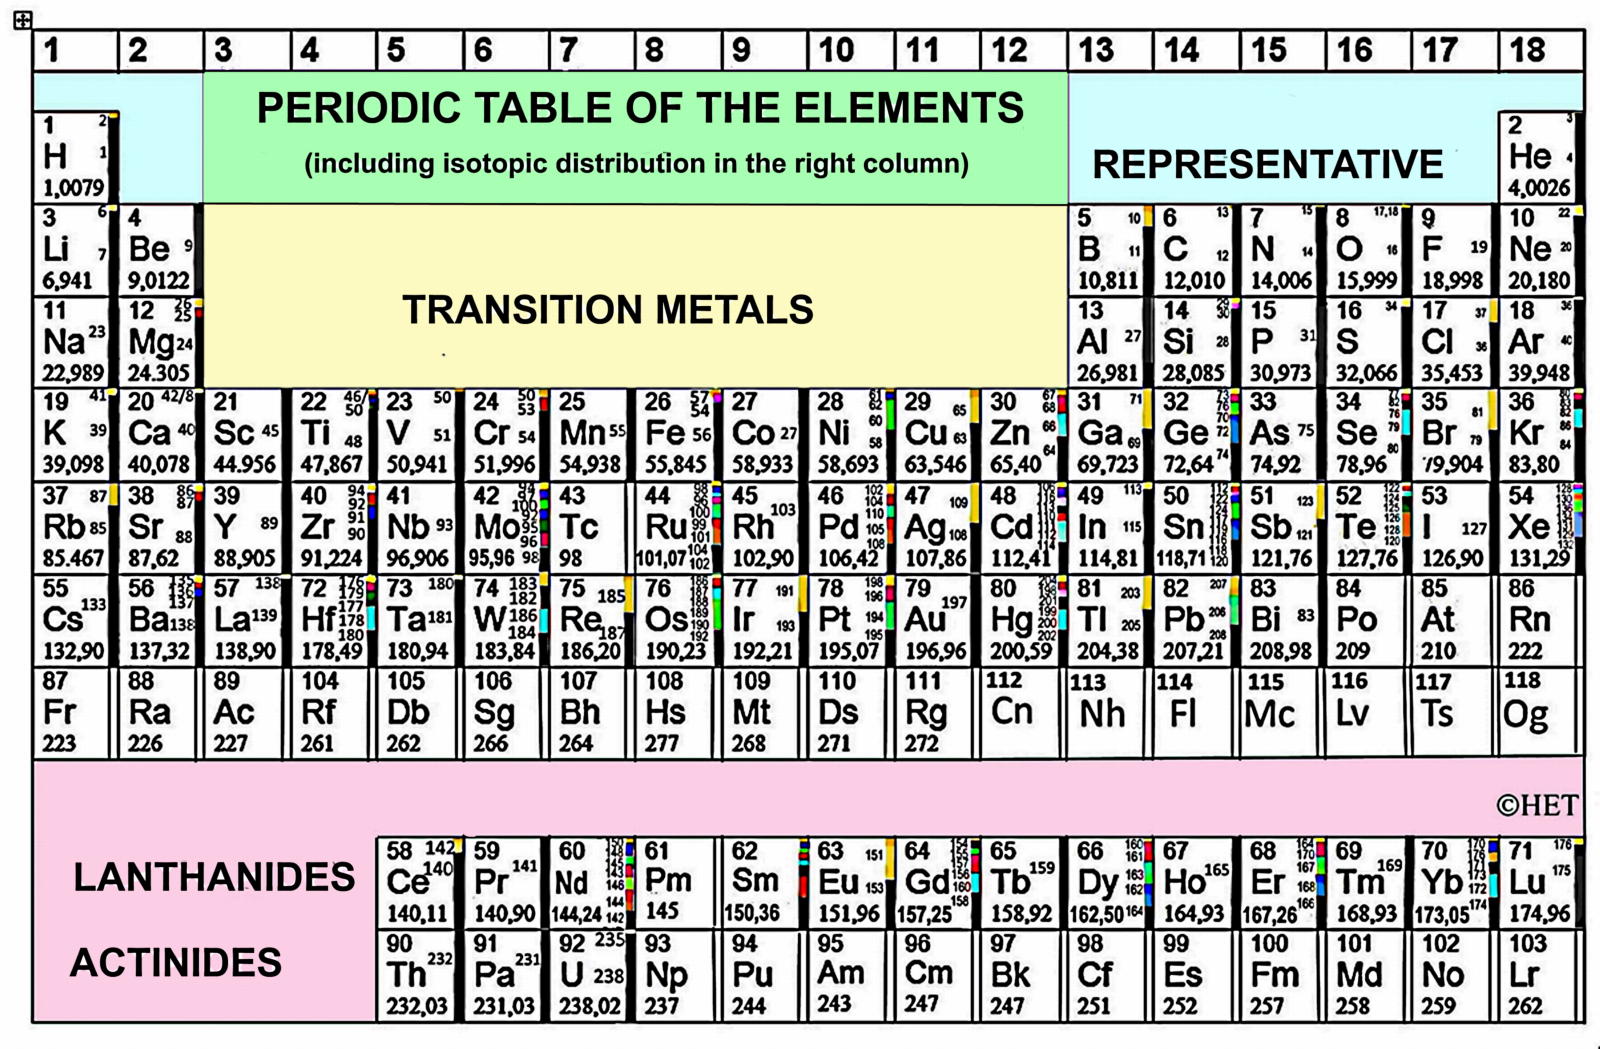
"Another is the Periodic Table of the Elements for Life, with the essential elements and abundance expressed by colors, including those used in medicine. This Table will be changing with the progress of Bioinorganic Chemistry, and is in my book of Bioinorganic Chemistry3.
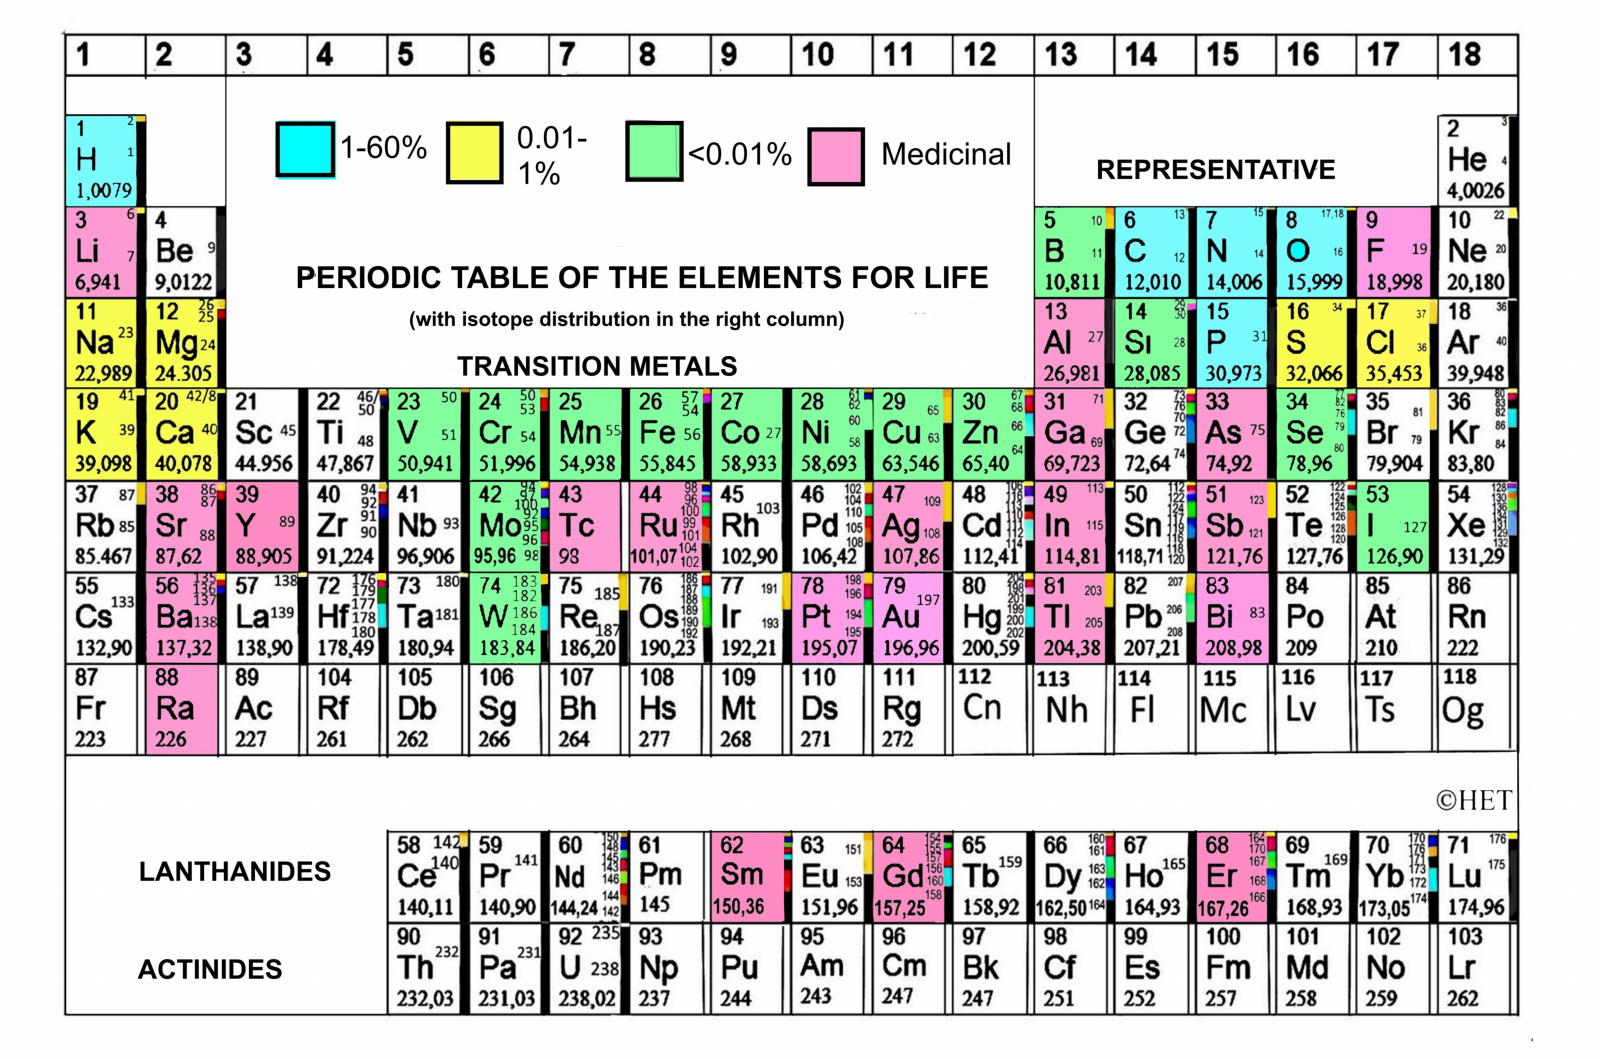
"Finally, I have adapted the periodic table of elemental sustainability, using the colors to call attention for this issue. In this form, it is can be more easily understood by the public. Elemental Sustainability is a very important issue, as discussed in Green Chemistry Journal4.
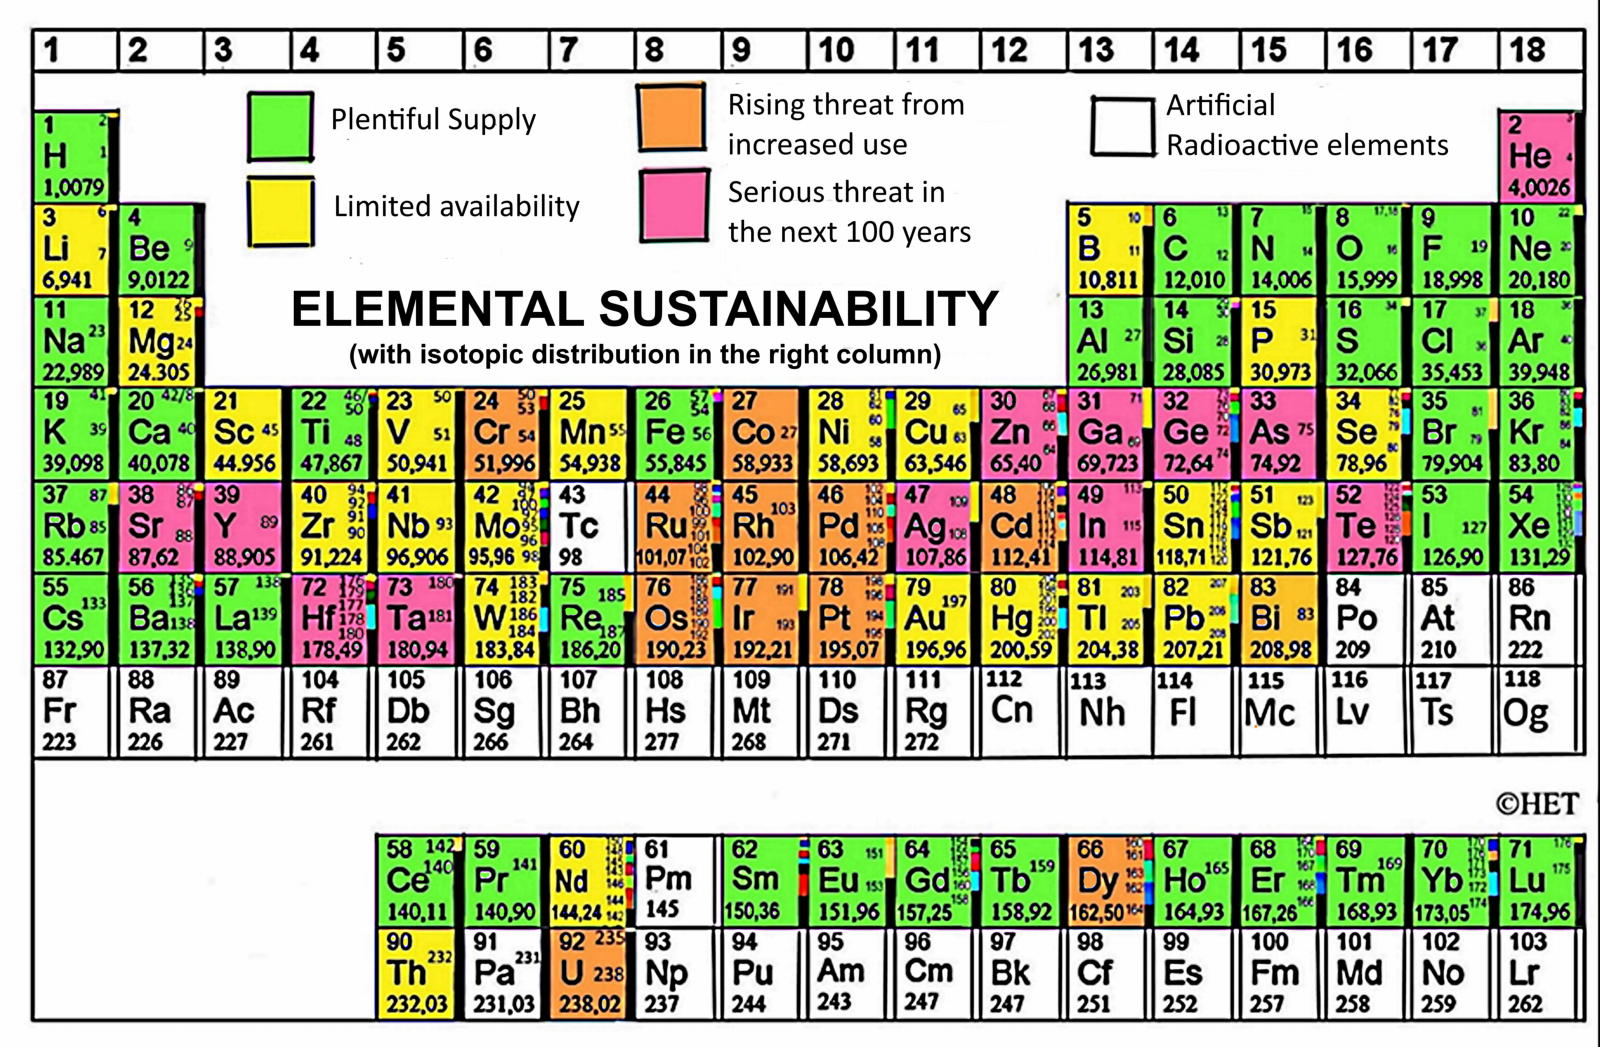
References:
- Toma, H. E. IYPT 2019 International Year of the Periodic Table of the Chemical Elements. Quimica Nova 42, 468–472 (2019).
- Toma, H. Estrutura atômica, ligações e estereoquímica. (Edgard Blucher, 2018).
- Toma, H. Química bioinorganica e ambiental. (Edgard Blucher, 2015).
- Toma, H. Green Processing of Strategic Elements Based on Magnetic Nanohydrometallurgy. Green Chem. 29, 948–959 (2015).
2022
Tutti Frutti Periodic Table
René Vernon who writes:
"As a potentially powerful teaching and learning instrument: a Tutti Frutti periodic table. I feel younger folk [will] be delighted by it. The overlay of electron configurations and blocks was designed by a colleague of mine."
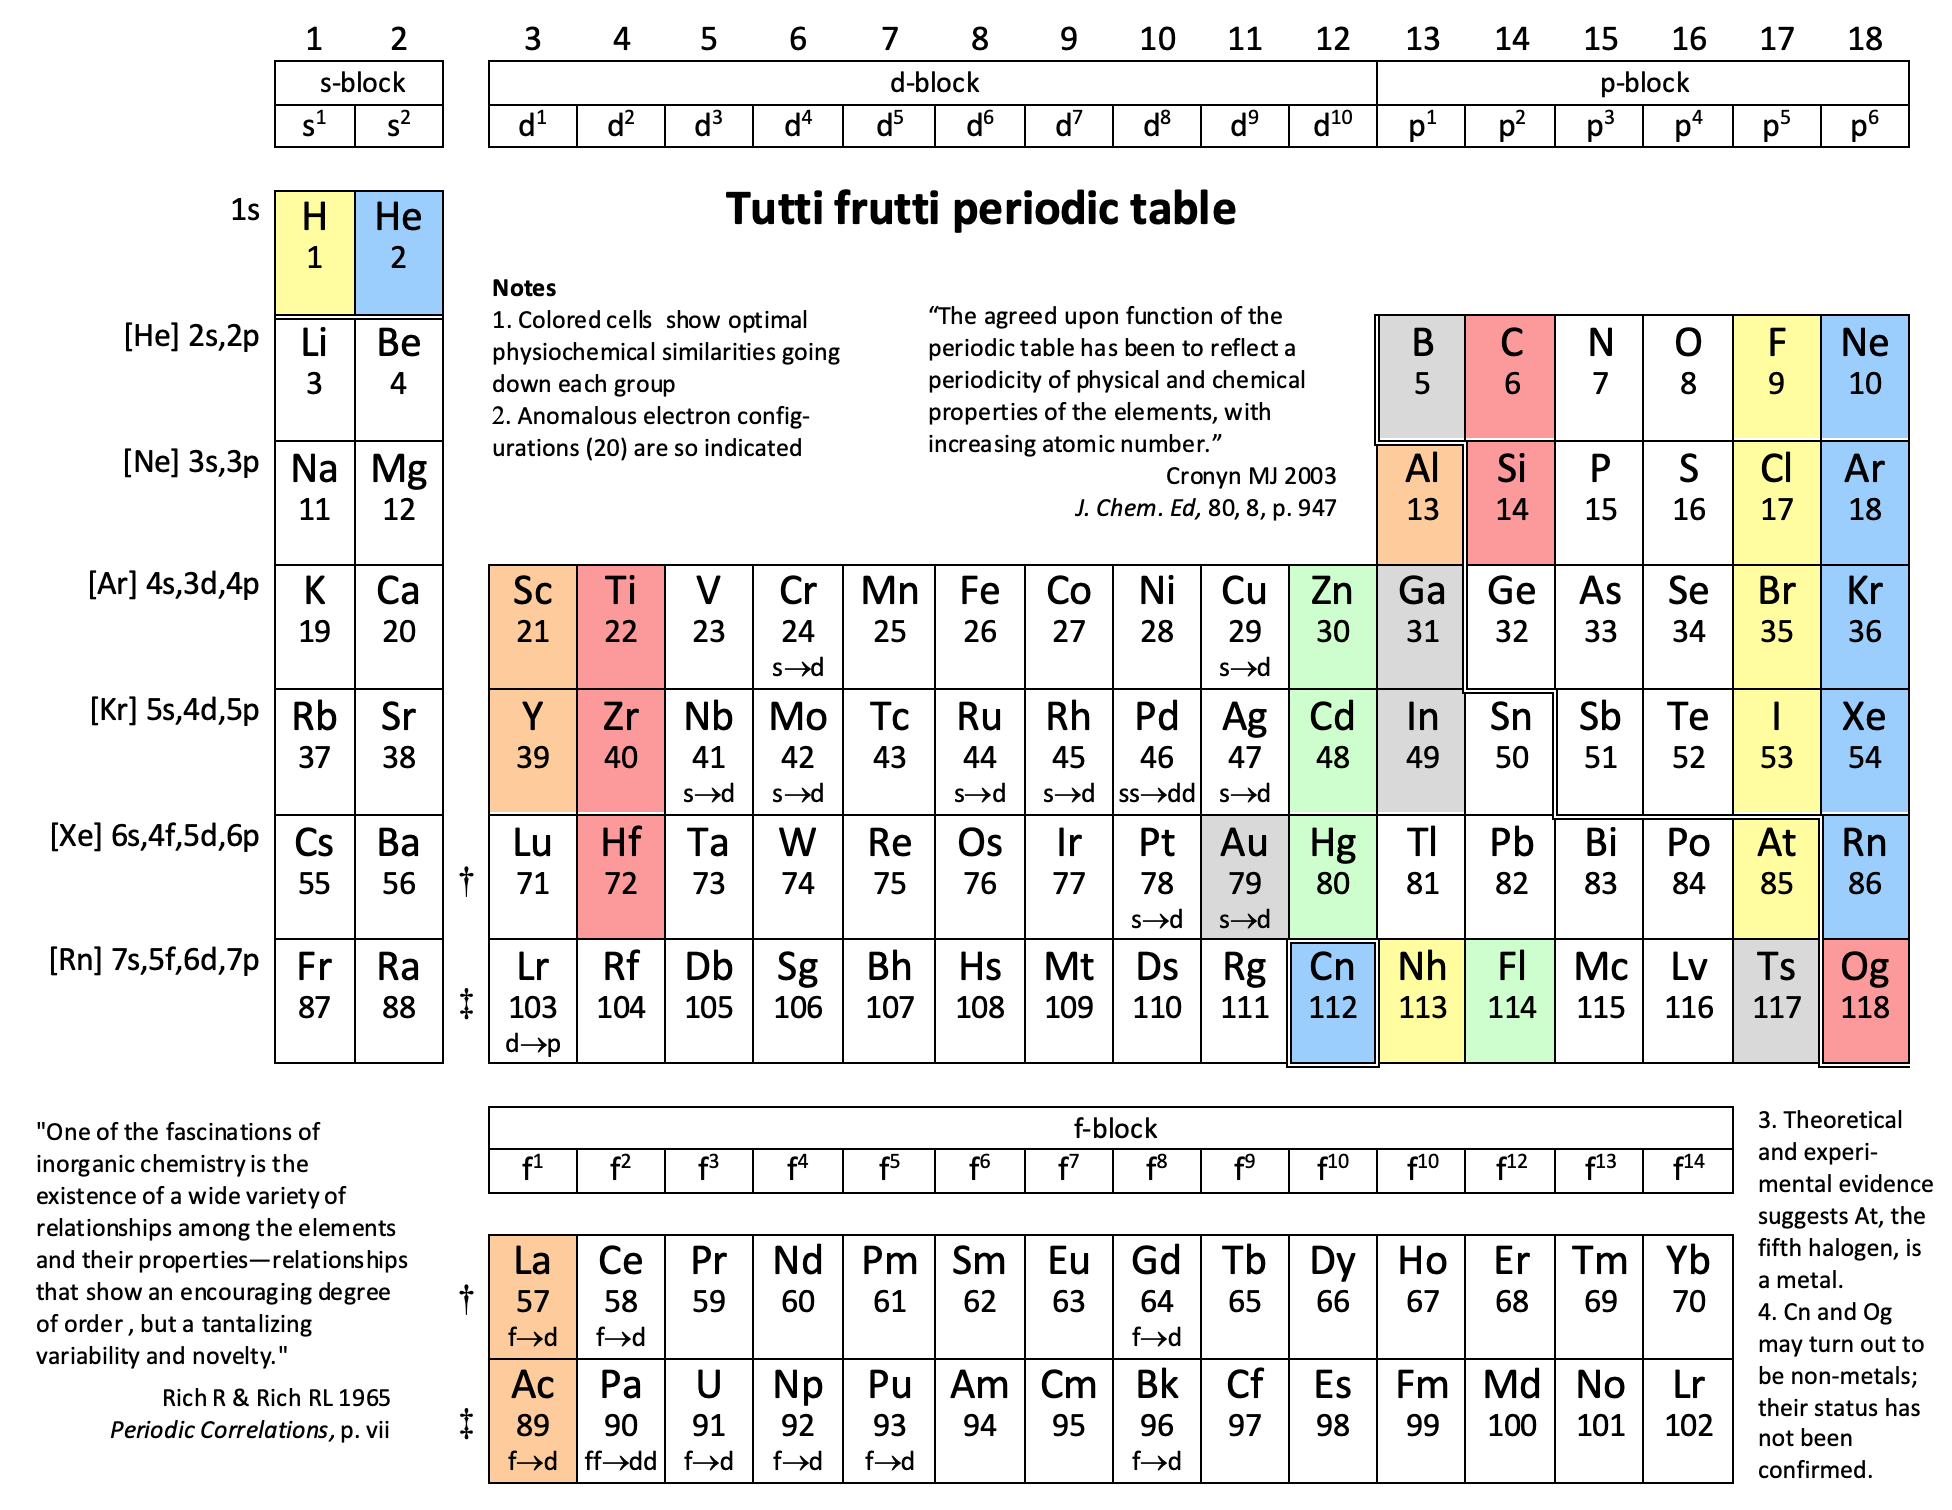
2019
Ultimate Periodic Table by Goodfellow
While the 'ultimate' periodic table by Goodfellow may not appear to be very ultimate, it does actually a possess a very rare property: Goodfellow is a materials company that supplies most of the chemical elements for industrial and research use.
By clicking on the element palladium, various facts about, and properties of, Pd are shown. Additionally, Goodfellow can supply:
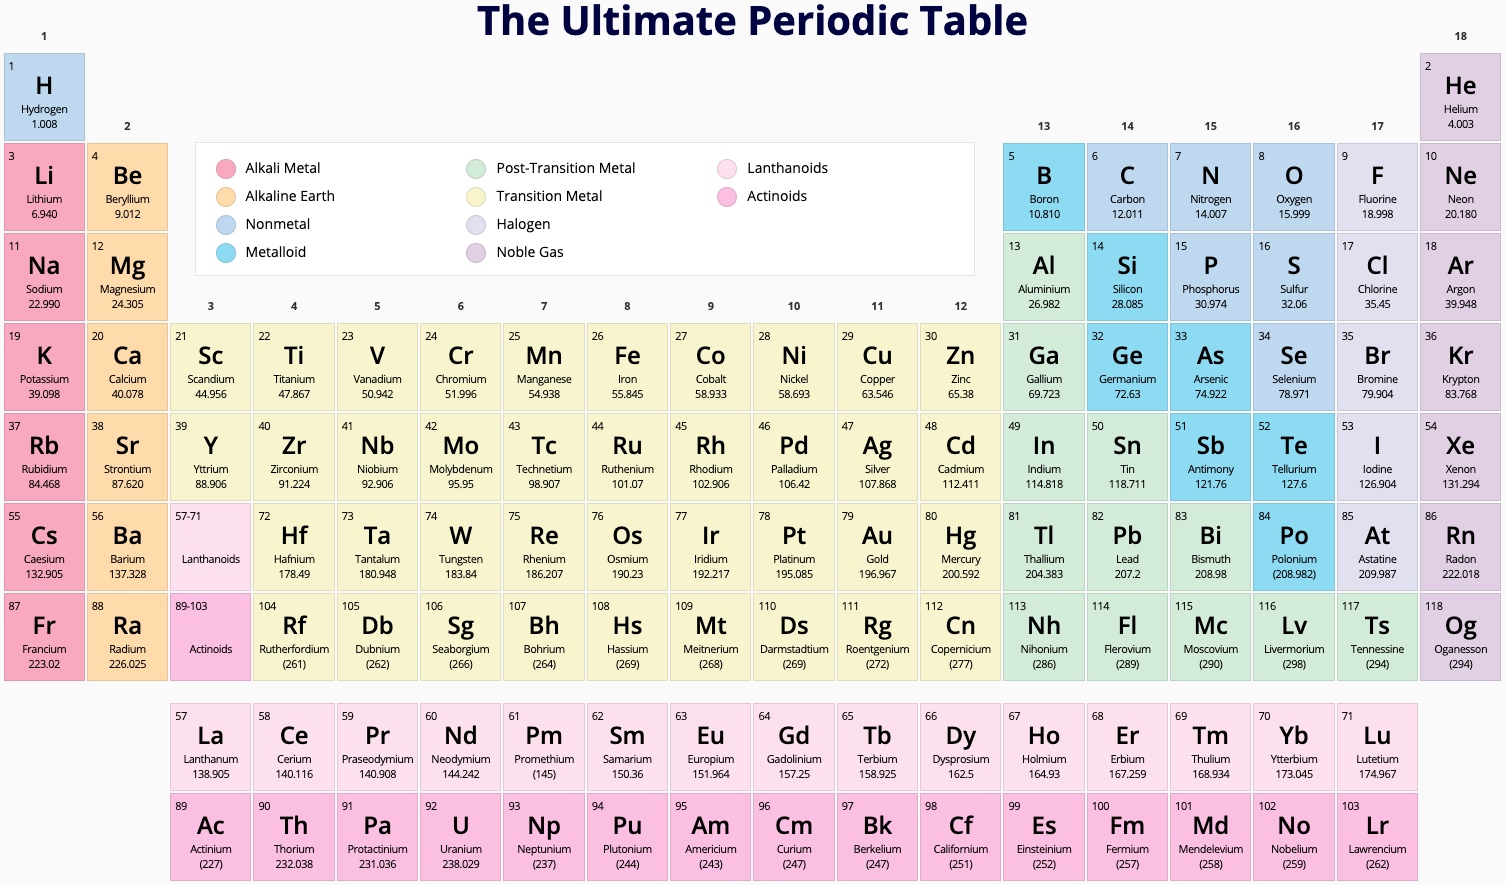
2010
Upper Limit in Mendeleev's Periodic Table - Element No.155
This book (PDF), by Albert Khazan, represents a result of many-year theoretical research, which manifested hyperbolic law in Mendeleev's Periodic Table.
According to [Khazan's] law, an upper limit (heaviest element) exists in Mendeleev's Table, whose atomic mass is 411.66 and No.155. It is shown that the heaviest element No.155 can be a reference point in nuclear reactions. Due to symmetry of the hyperbolic law, the necessity of the Table of Anti-Elements, consisting of anti-substance, has been predicted. This manifests that the found hyperbolic law is universal, and the Periodic Table is common for elements and anti-elements.
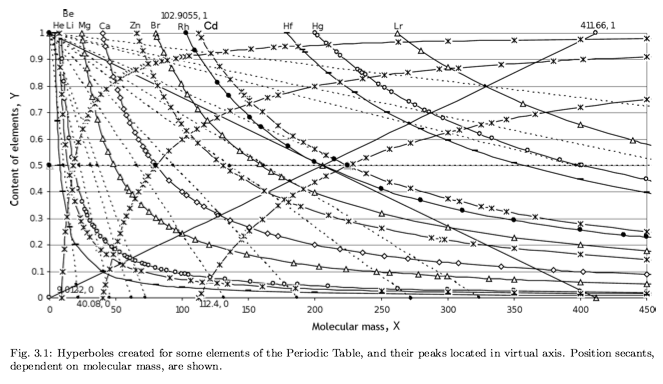
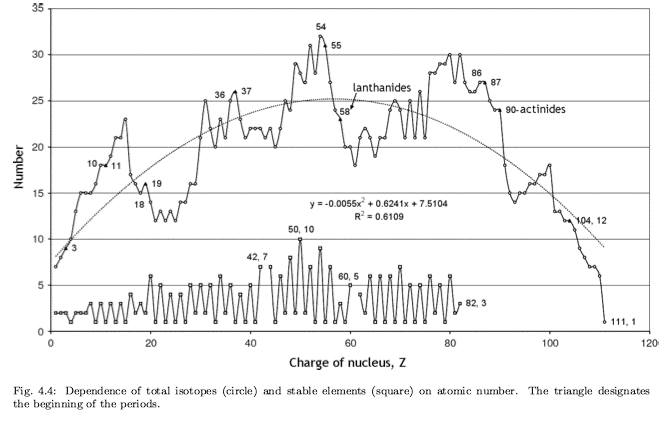

2014
URENCO Periodic Table
A periodic table by URENCO showing which non-radioactive (stable) elements are suitable for isotopic enrichment using gas centrifuge technology:

1987
Variation of Orbital Radii with Atomic Number
From Jour. Fac. Sci., Hokkaido Univ., Ser. IV. vol. 22, no. 2, Aug., 1987, pp. 357-385, The Connection Between the Properties of Elements and Compounds; Mineralogical-Crystallochemical Classification of Elements by Alexander A. Godovikov & Yu Hariya.
The analyses of the variations of the orbital atomic radii values (rorb) with the increase of the atomic number (Z) allow establishment of the following recurring regularities of their change:
Click image below to enlarge:
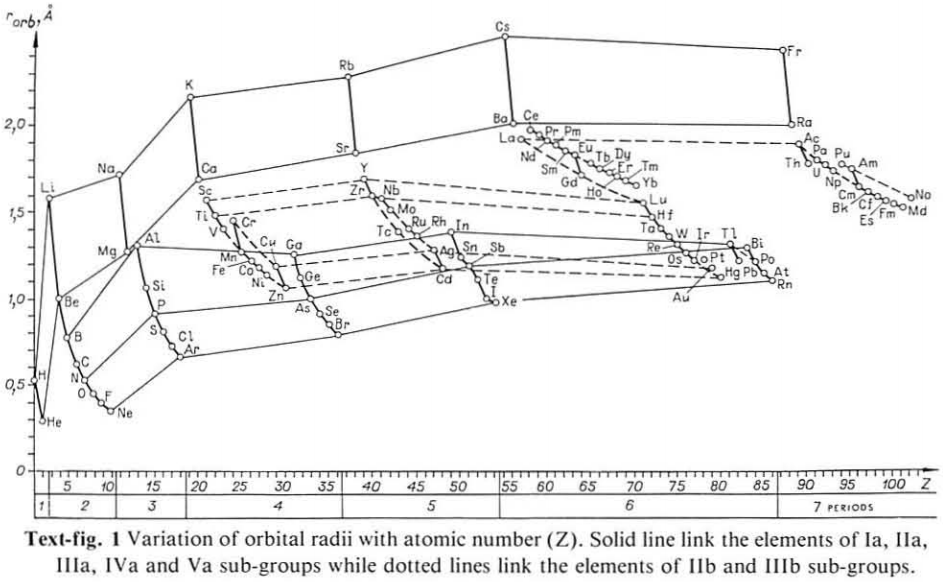
Thanks to René for the tip!
2021
Vernon's ABC Periodic Table
The Annotated Blocks & Categories (ABC) Periodic Table by René Vernon.
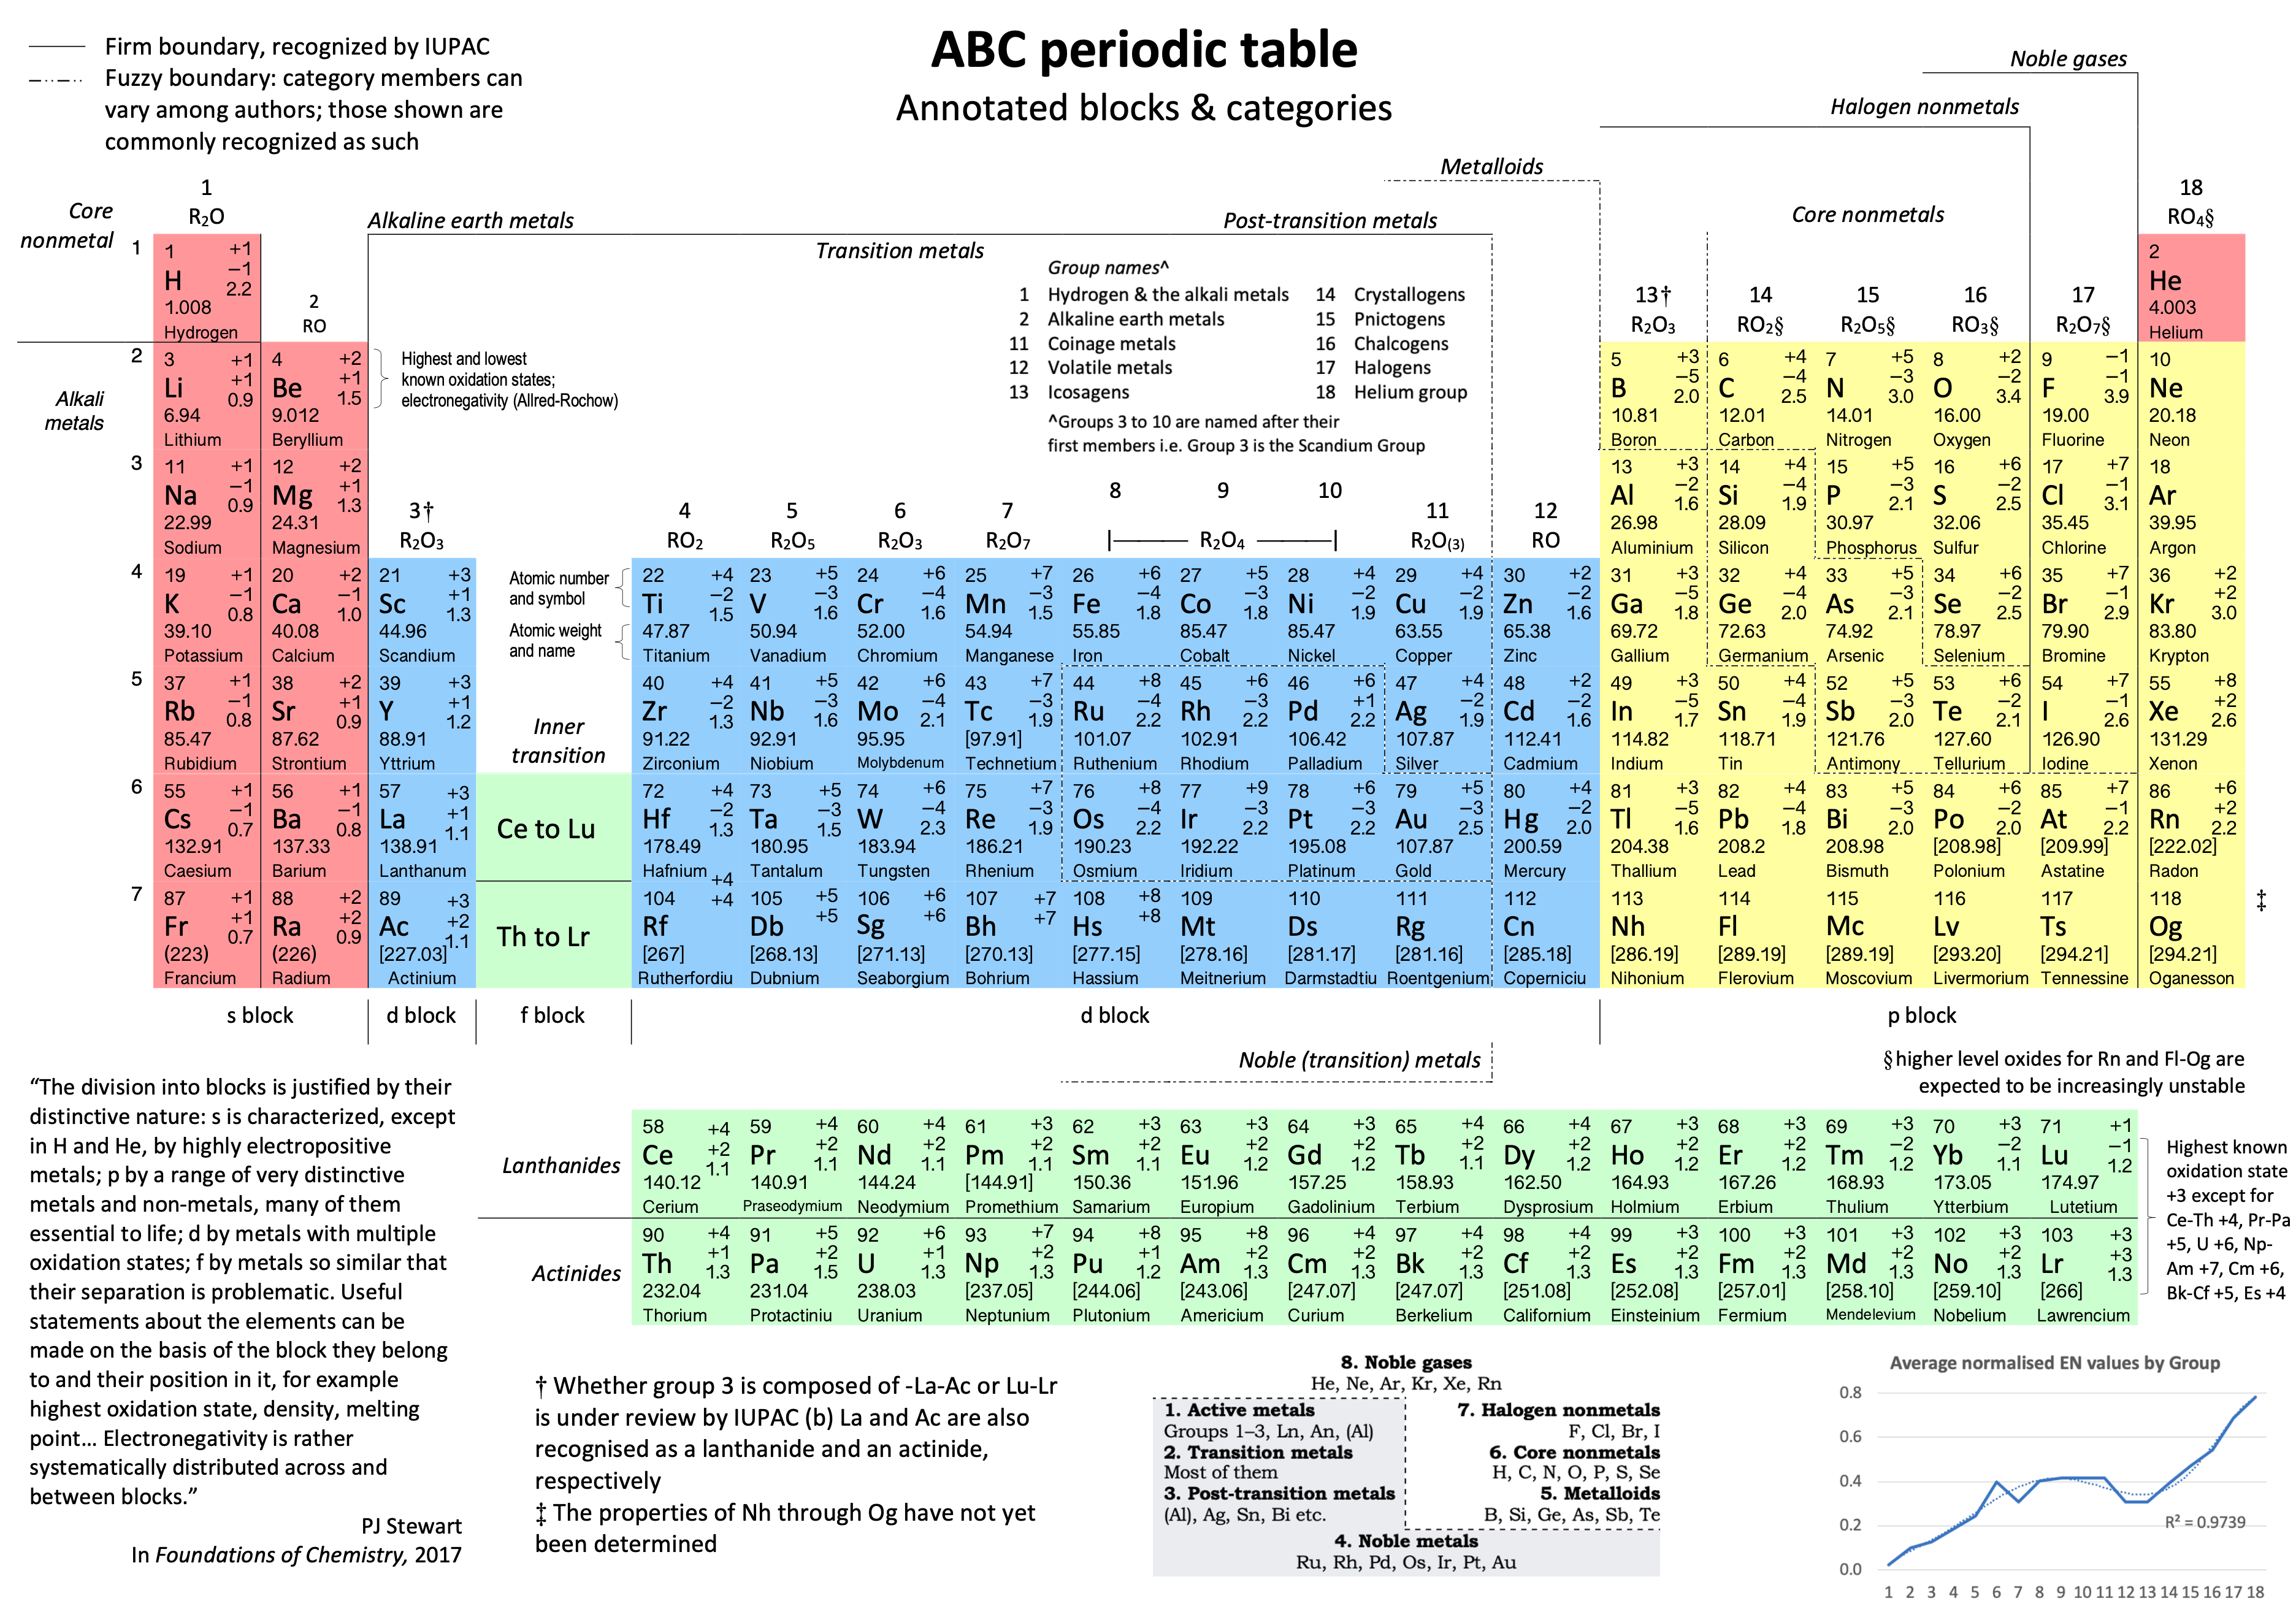
2020
Vernon's Constellation of Electronegativity
René Vernon has created a "Constellation of Electronegativity" by plotting Electronegativity against Elemental Orbital Radii (rorb)
Observations on the EN plot:
- The results are similar to the orbital radii x EA plot, although not quite as clear, including being more crowded
- Very good correspondence with natural categories
- Largely linear trends seen along groups 1-2, 17 and 15-18 (Ne-Rn)
- First row anomaly seen for He (or maybe not since it lines up with the rest of group 2)
- For group 13, the whole group is anomalous
- For group 14 , the whole group is anomalous no doubt due to the scandide contraction impacting Ge and the double whammy of the lanthanide and 5d contraction impacting Pb
- F and O are the most corrosive of the corrosive nonmetals
- The rest of the corrosive nonmetals (Cl, Br and I) are nicely aligned with F
- The intermediate nonmetals (IM) occupy a trapezium
- Iodine almost falls into the IM trapezium
- The metalloids occupy a diamond, along with Hg; Po is just inside; At a little outside
- Rn is metallic enough to show cationic behaviour and falls into the metalloid diamond
- Pd is located among the nonmetals
- The proximity of H to Pd is again (coincidentally?) curious given the latter's capacity to adsorb the former
- The post-transition metals occupy a narrow strip overlapping the base of the refractory metal parallelogram
- Curiously, Zn, Cd, and Hg (a bit stand-off-ish) are collocated with Be, and relatively distant from the PTM and the TM proper
- The ostensibly noble metals occupy an oval; curiously, W is found here; Ag is anomalous given its greater reactivity; Cu, as a coinage metal, is a little further away
- Au and Pt are nearest to the halogen line
- The ferromagnetic metals (Fe-Co-Ni) are colocated
- The refractory metals, Nb, Ta, Mo, W and Re are in a parallelogram, along with Cr and V; Tc is included here too
- Indium is the central element of the periodic table in terms of mean orbital radius and EN; Tc is next as per the EA chart
- The reversal of He compared to the rest of the NG reflects #24
- All of the Ln and An fall into an oval of basicity, bar Lr
- The reversal of the positions of Fr and Cs is consistent with Cs being the most electronegative metal
- A similar, weaker pattern is seen with Ba and Ra.
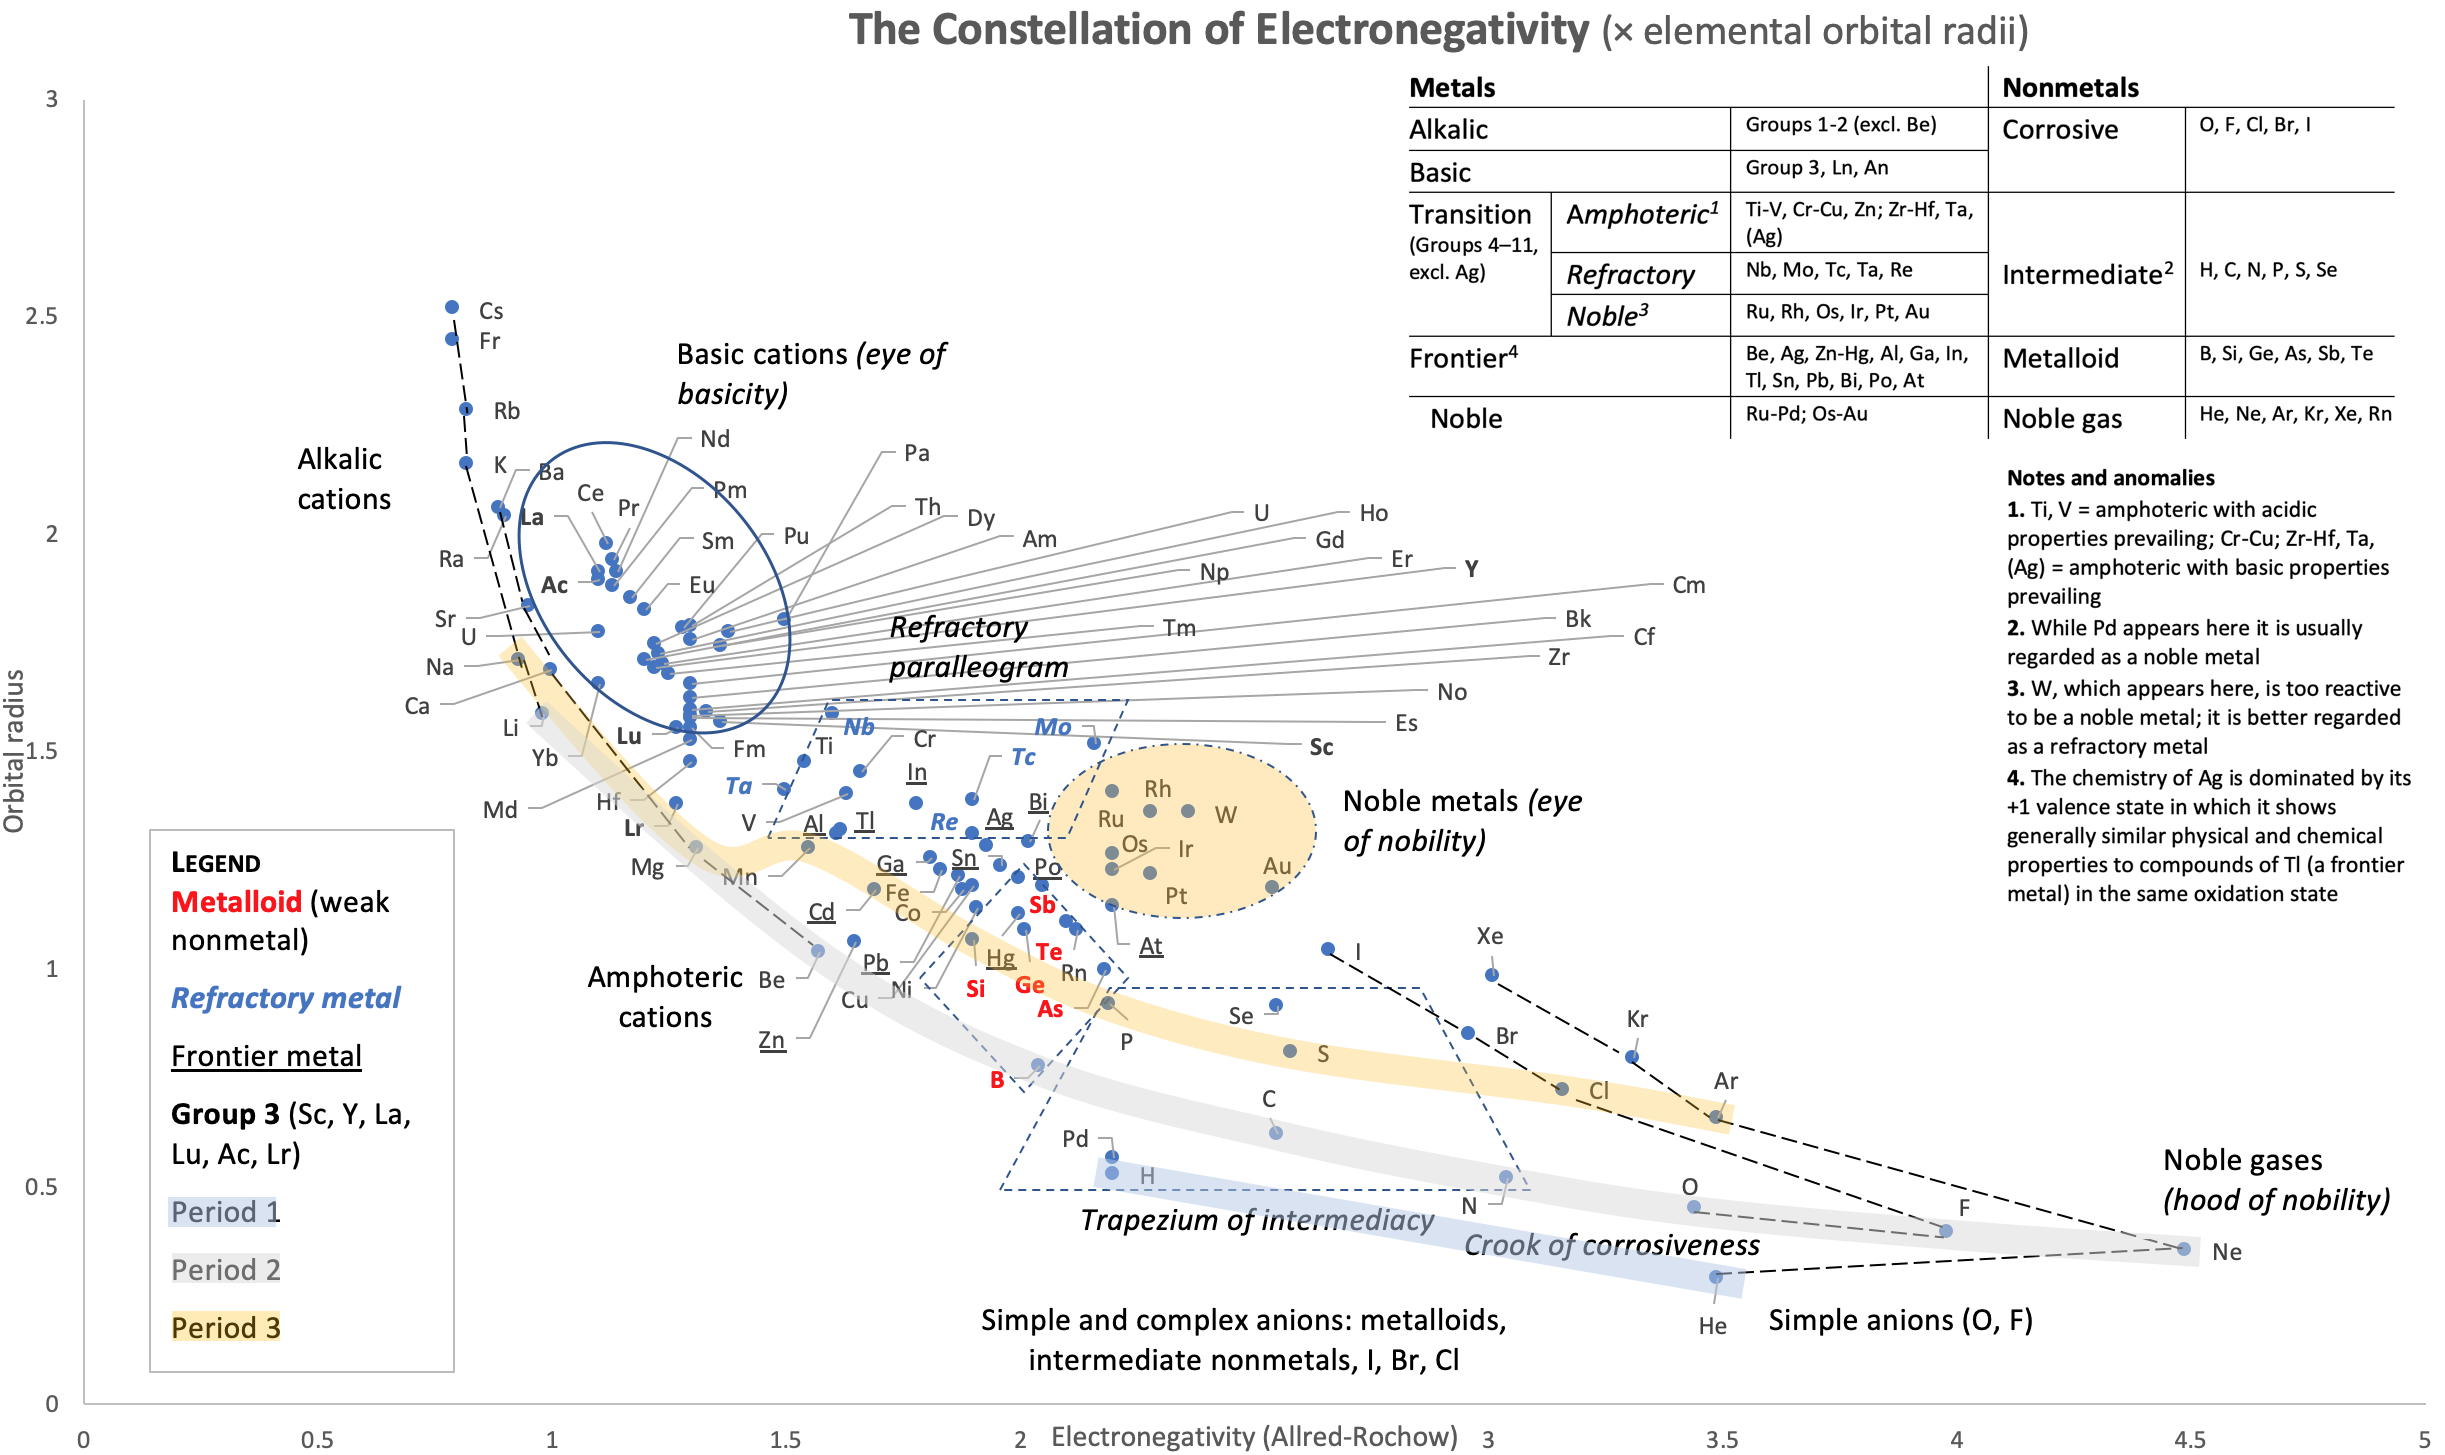
2021
Vernon's Eight-Fold Way Periodic Table
René Vernon suggests that the chemical elements can be grouped into eight classes: four metallic (Active, Transition, Post-Transition and Noble) and four non-metallic (Halogen, Biogen, Metalloid and Noble gas):
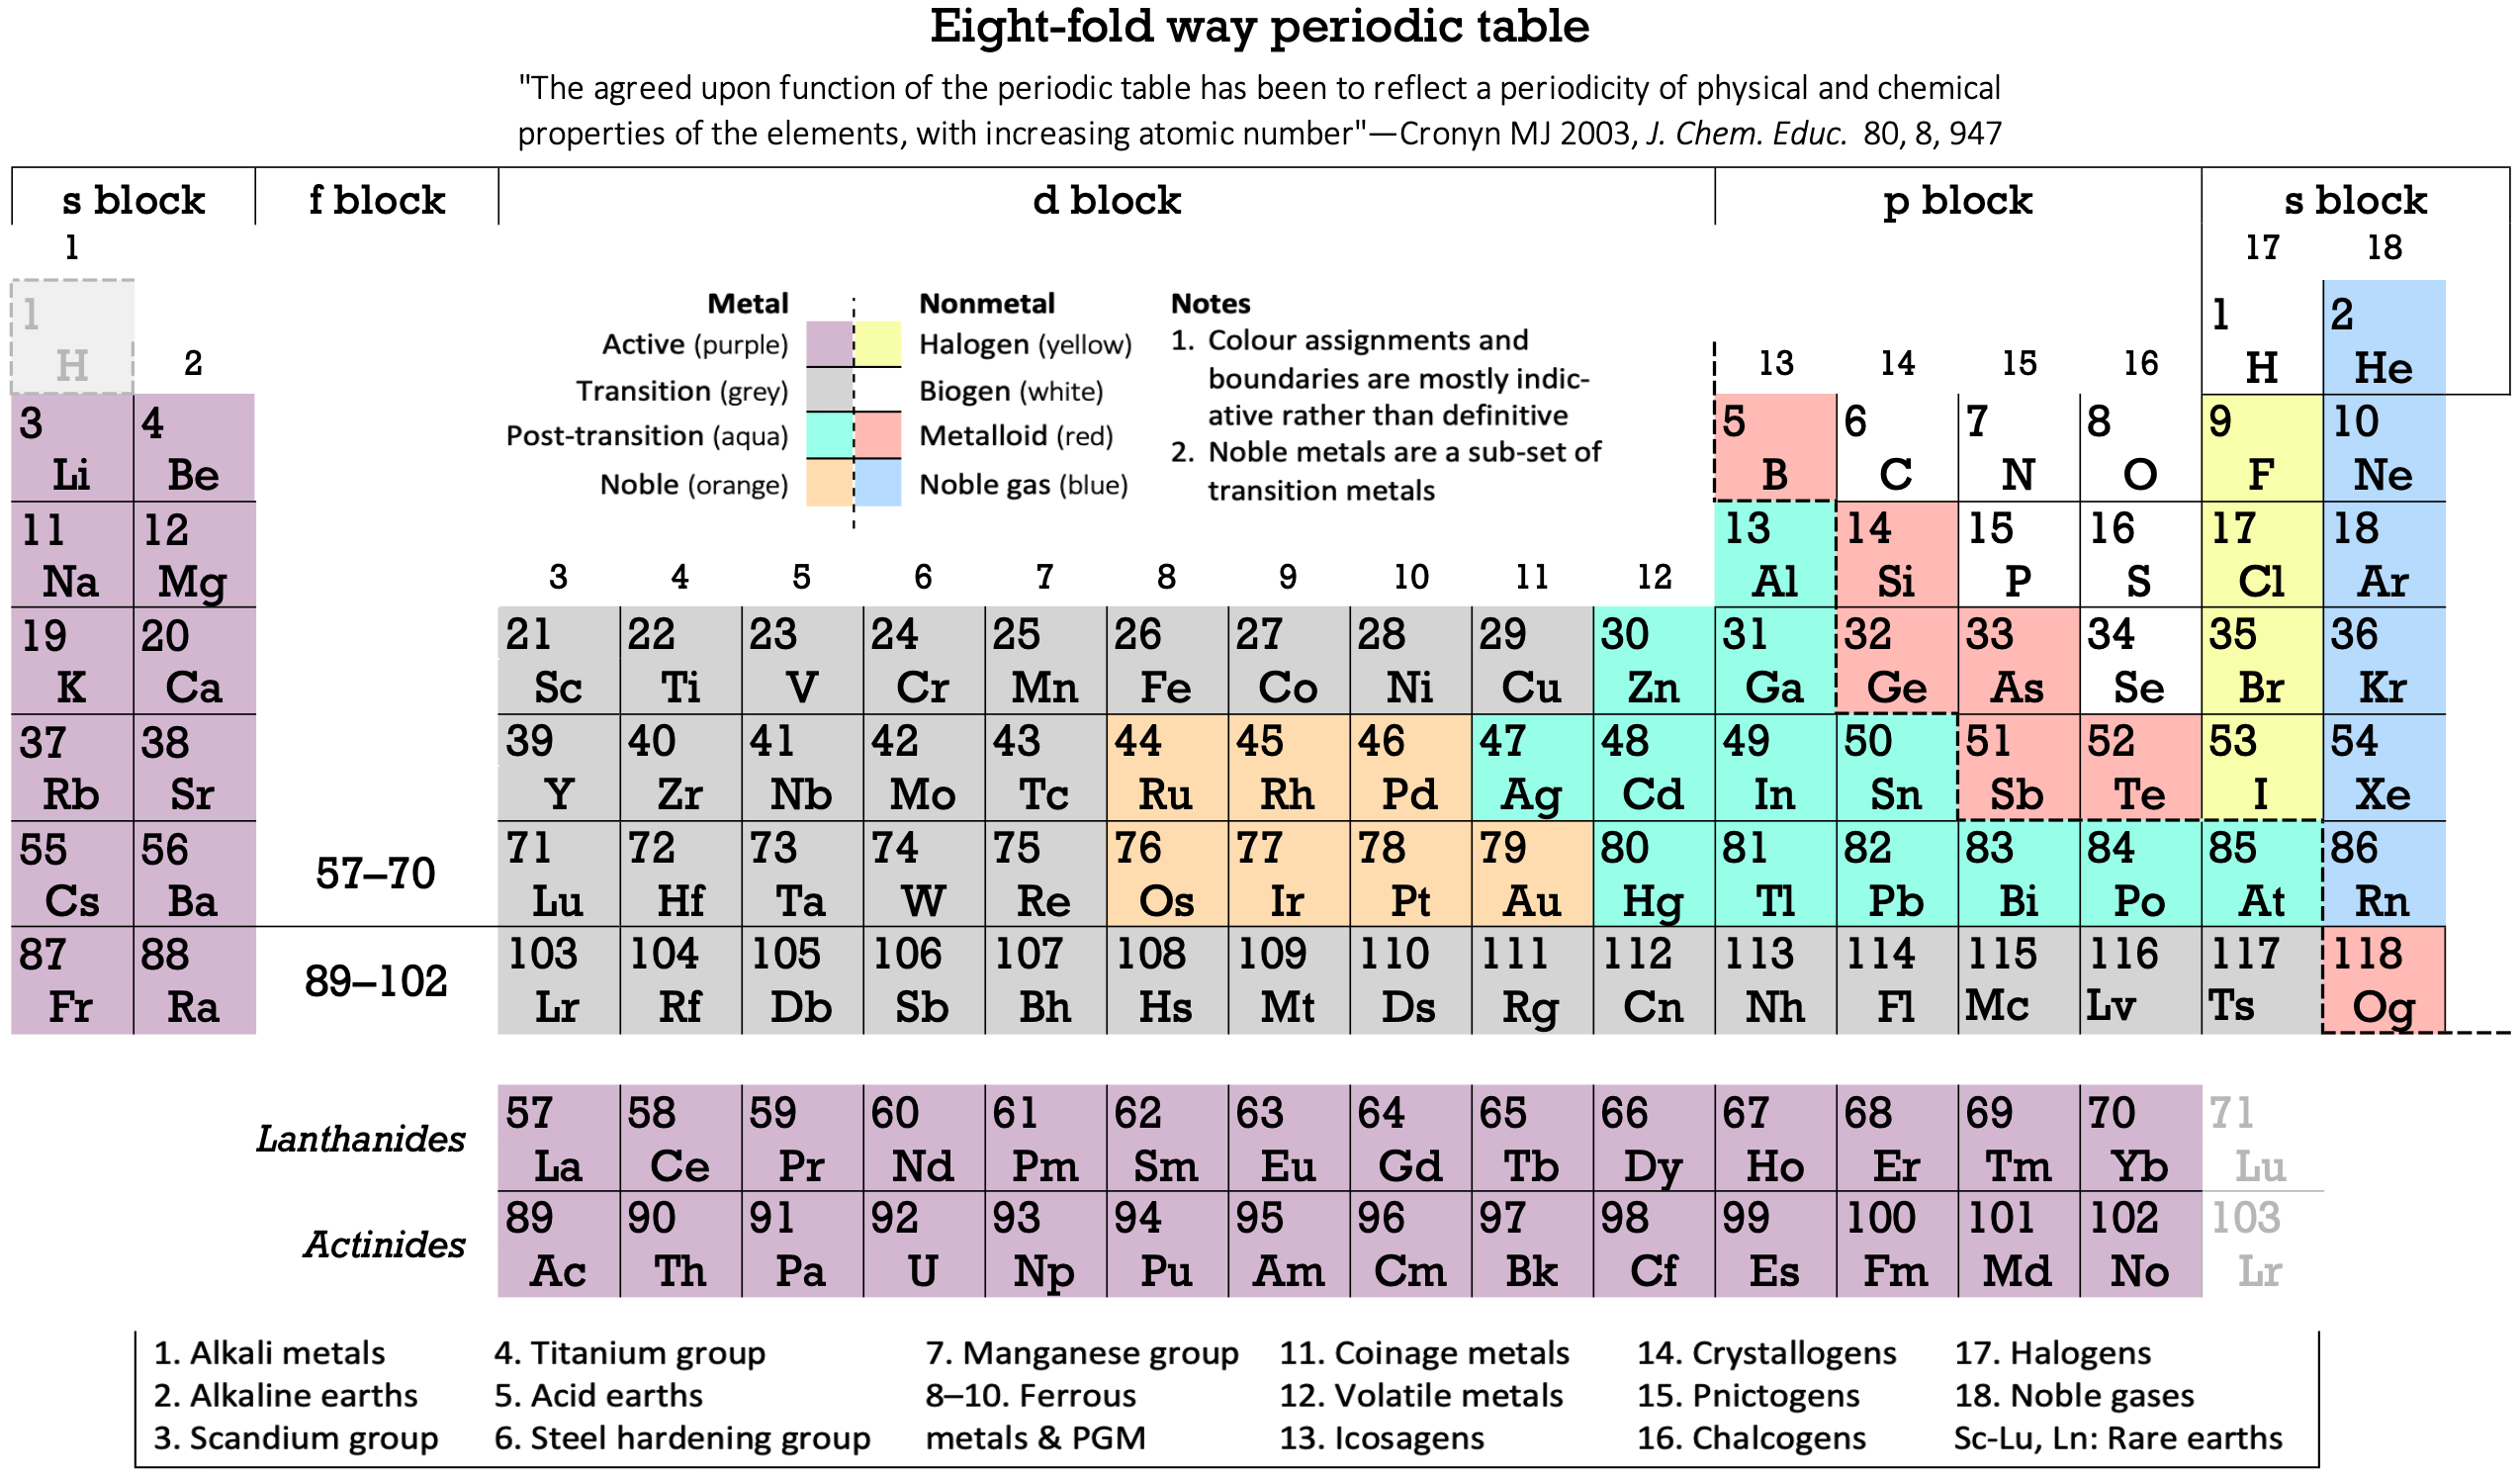
2019
Vernon's Oxidation Number Periodic Table
René Vernon's periodic table showing oxidation number trends.
René writes:
- This table is based on two tables by Fernelius (1986), one of which is a portrait version of Bohr's 1922 table, and the second of which is a conventional table highlighting oxidation number trends in groups 4 to 10, and most of the p-block. Ref. Fernelius WC , 'Some reflections on the periodic table and its use', Journal of Chemical Education, vol. 63, no. 3, pp. 263–266 (1986).
- In my table, the transition metals are in groups 4 to 11. As per Mark's Leach's email: "...It's the 'incomplete d-subshell' that gives rise to properties such as: variable oxidation state, catalytic behaviour, d-orbital splitting and [thus] coloured ions/compounds."
- I've included oxidation number details for some elements. I've tried a different way of showing the composition of a bifurcated group 3, which is more in keeping with Bohr's table.
- The horizontal bar of the "T" is for Sc → Ti; the downward bar is for Y → Lu-Lr.
- Thus, Group 3 as Sc-Y-Lu-Lr could be called group 3T.
- La-Ac and Lu-Lr are duplicated in a greyed-out style to make it clearer where the lanthanides and actinides fit into the main body of the table.
- The inner transition metals are clearly delineated. Analogously to the transition metals they're all capable of forming ions with incomplete f sub-shells.
- The early actinides resemble the transition metals.

2020
Vernon's Periodic Table showing the Idealized Solid-State Electron Configurations of the Elements
René Vernon writes:
"I've attached a periodic table showing the solid-state electron configurations of the elements. Among other things, it provides a first order explanation as to why elements such as Ln (etc.) like the +3 oxidation state.
"The table includes two versions of the f-block, the first starting with La-Ac; the second with Ce-Th. The table with the first f-block version has 24 anomalies [with respect to Madelung's rule]; the table with the second f-block version has 10 anomalies.
"In the case of the Sc-Y-La-Ac form, I wonder if such a solid-state table is more relevant these days than a table based on gas phase configurations, which has about 20 anomalous configurations.
"Partly we use gas phase configurations since, as Eric Scerri mentioned to me elsewhere, configurations were first obtained (~100 years ago?) from spectroscopy, and this field primarily deals with gas phase atoms. That said, are gas phase configurations still so relevant these days – for this purpose – given the importance of solid-state physics?
"I've never been able to find a periodic table of solid-state electron configurations. Perhaps that has something to do with it? Then again, surely I'm not the first person to have drawn one of these?"
Click image below to enlarge:
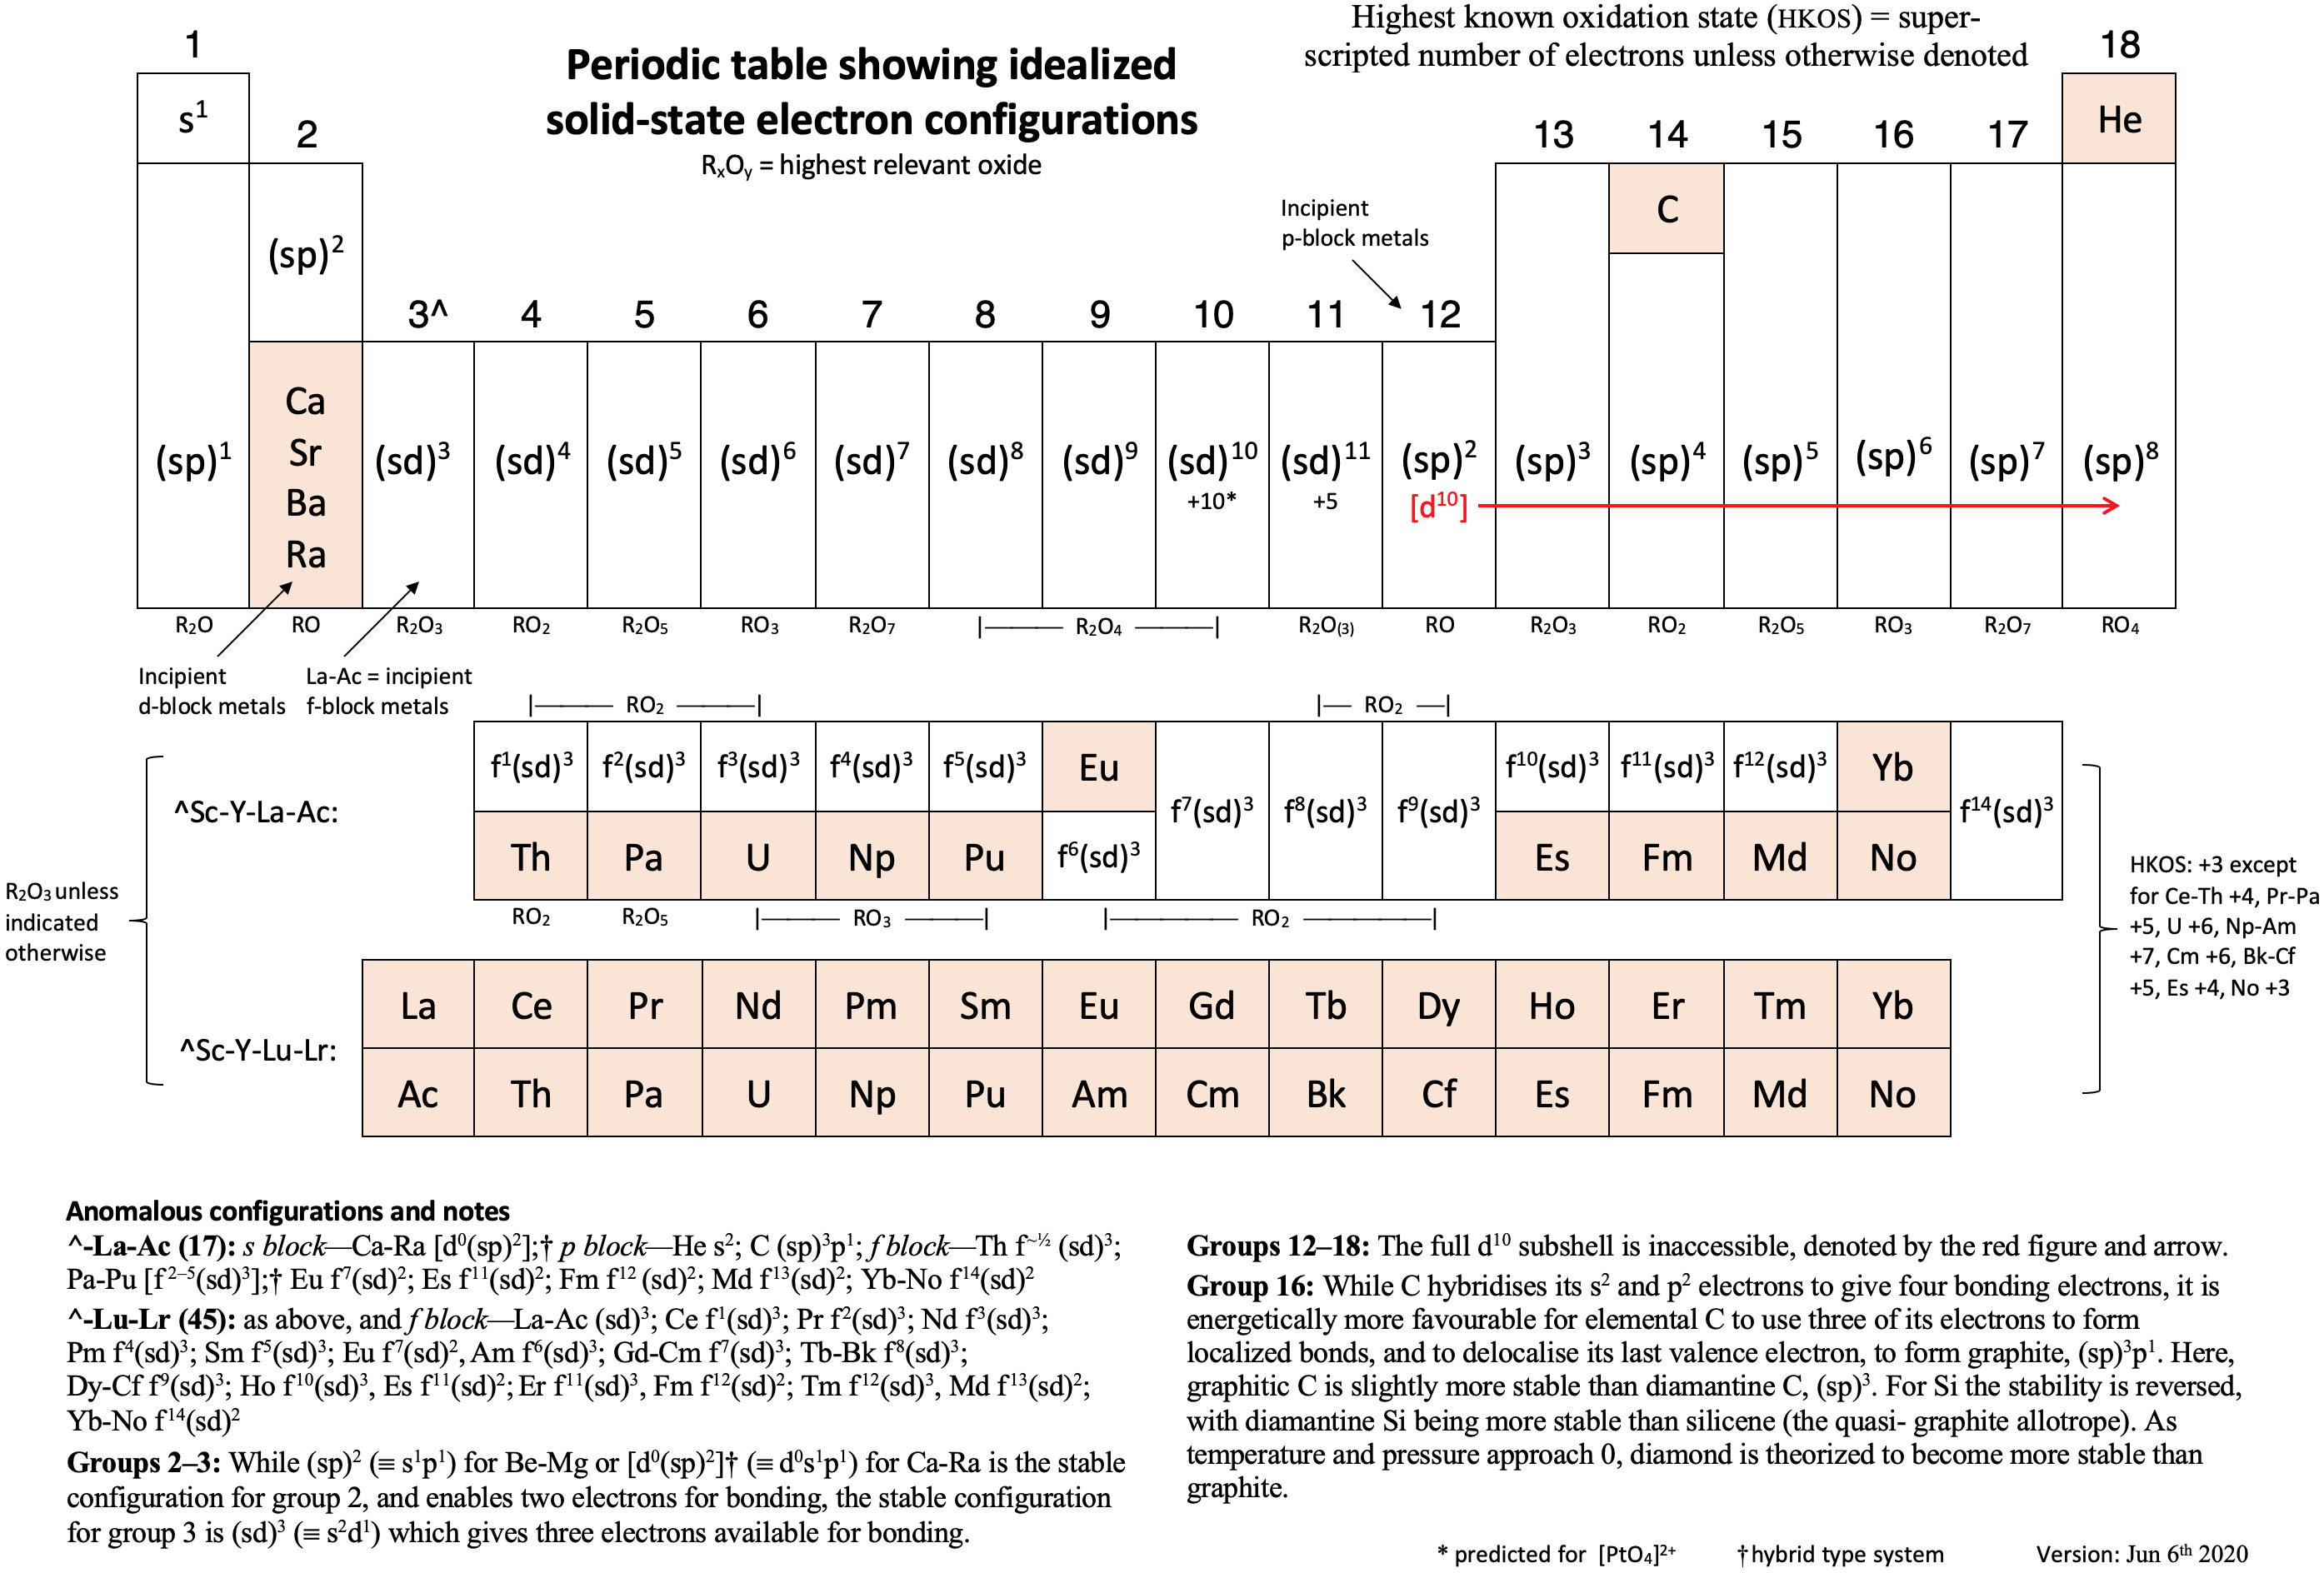
2008 Periodic Table of Videos
The chemistry department at the University of Nottingham has produced a series of YouTube video information clips about the chemical elements:
2004
Visual Elements Periodic Table
Visual Elements Periodic Table
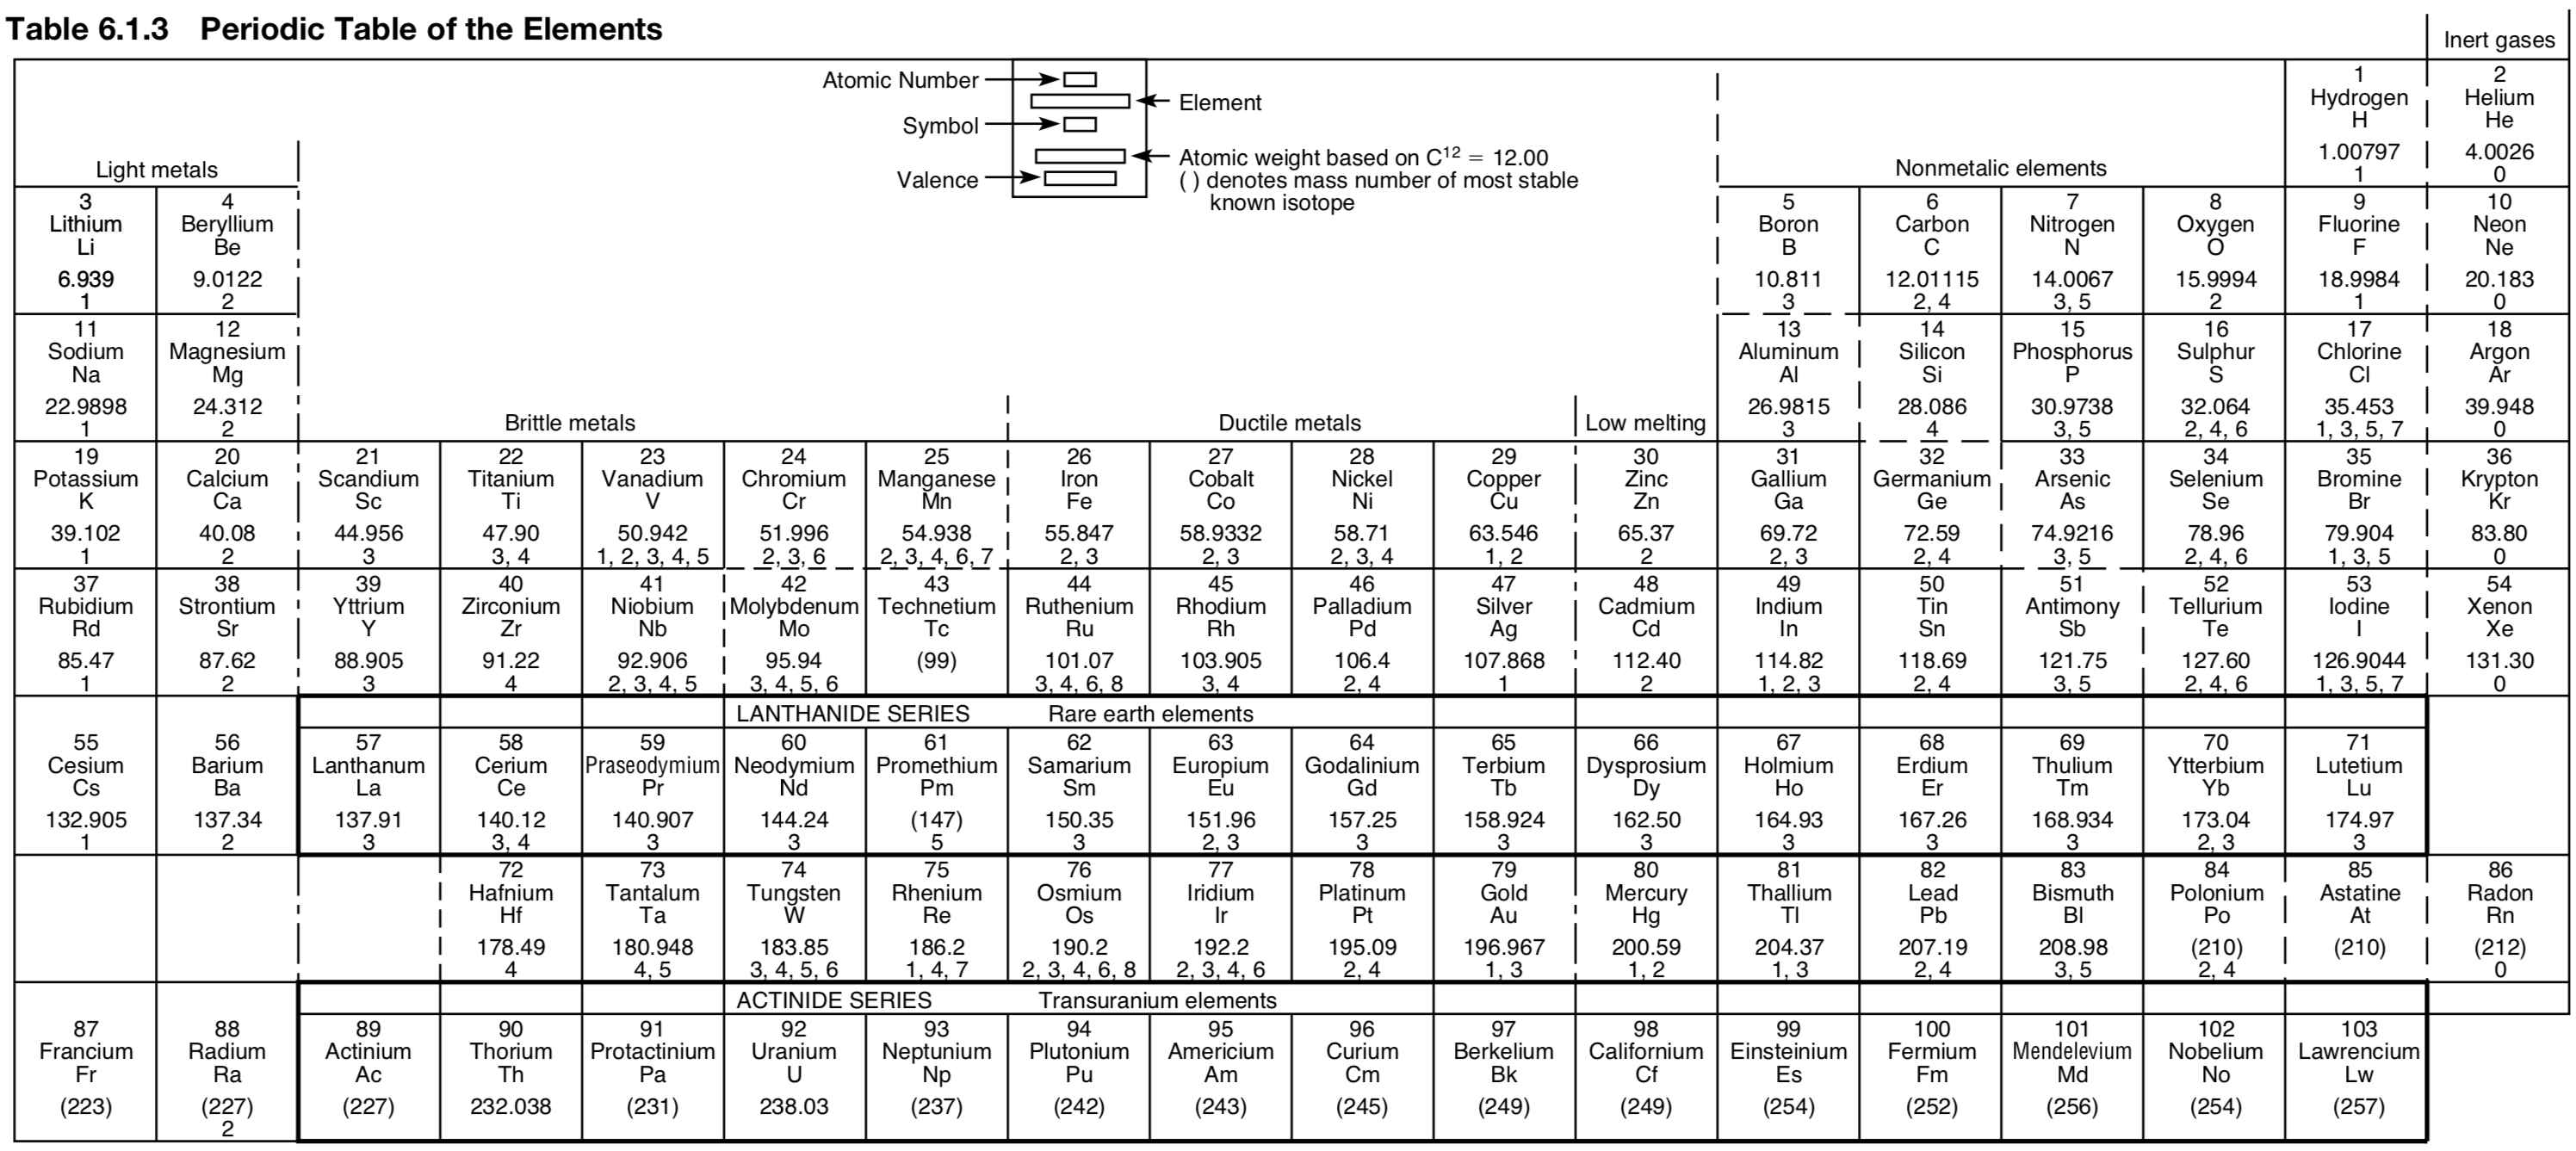
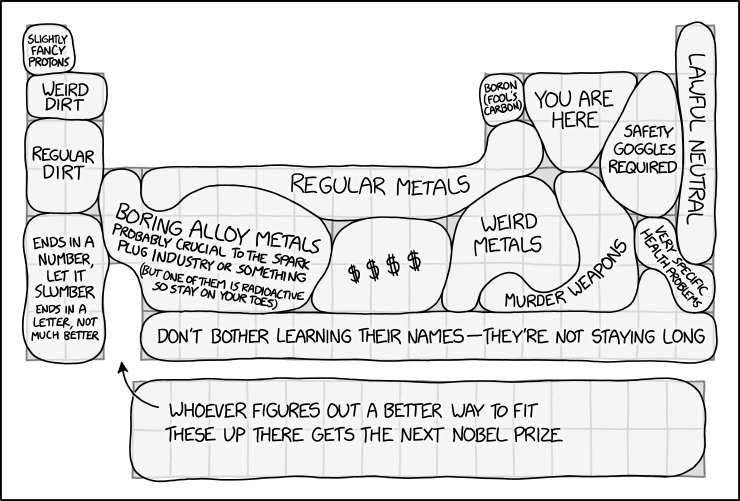
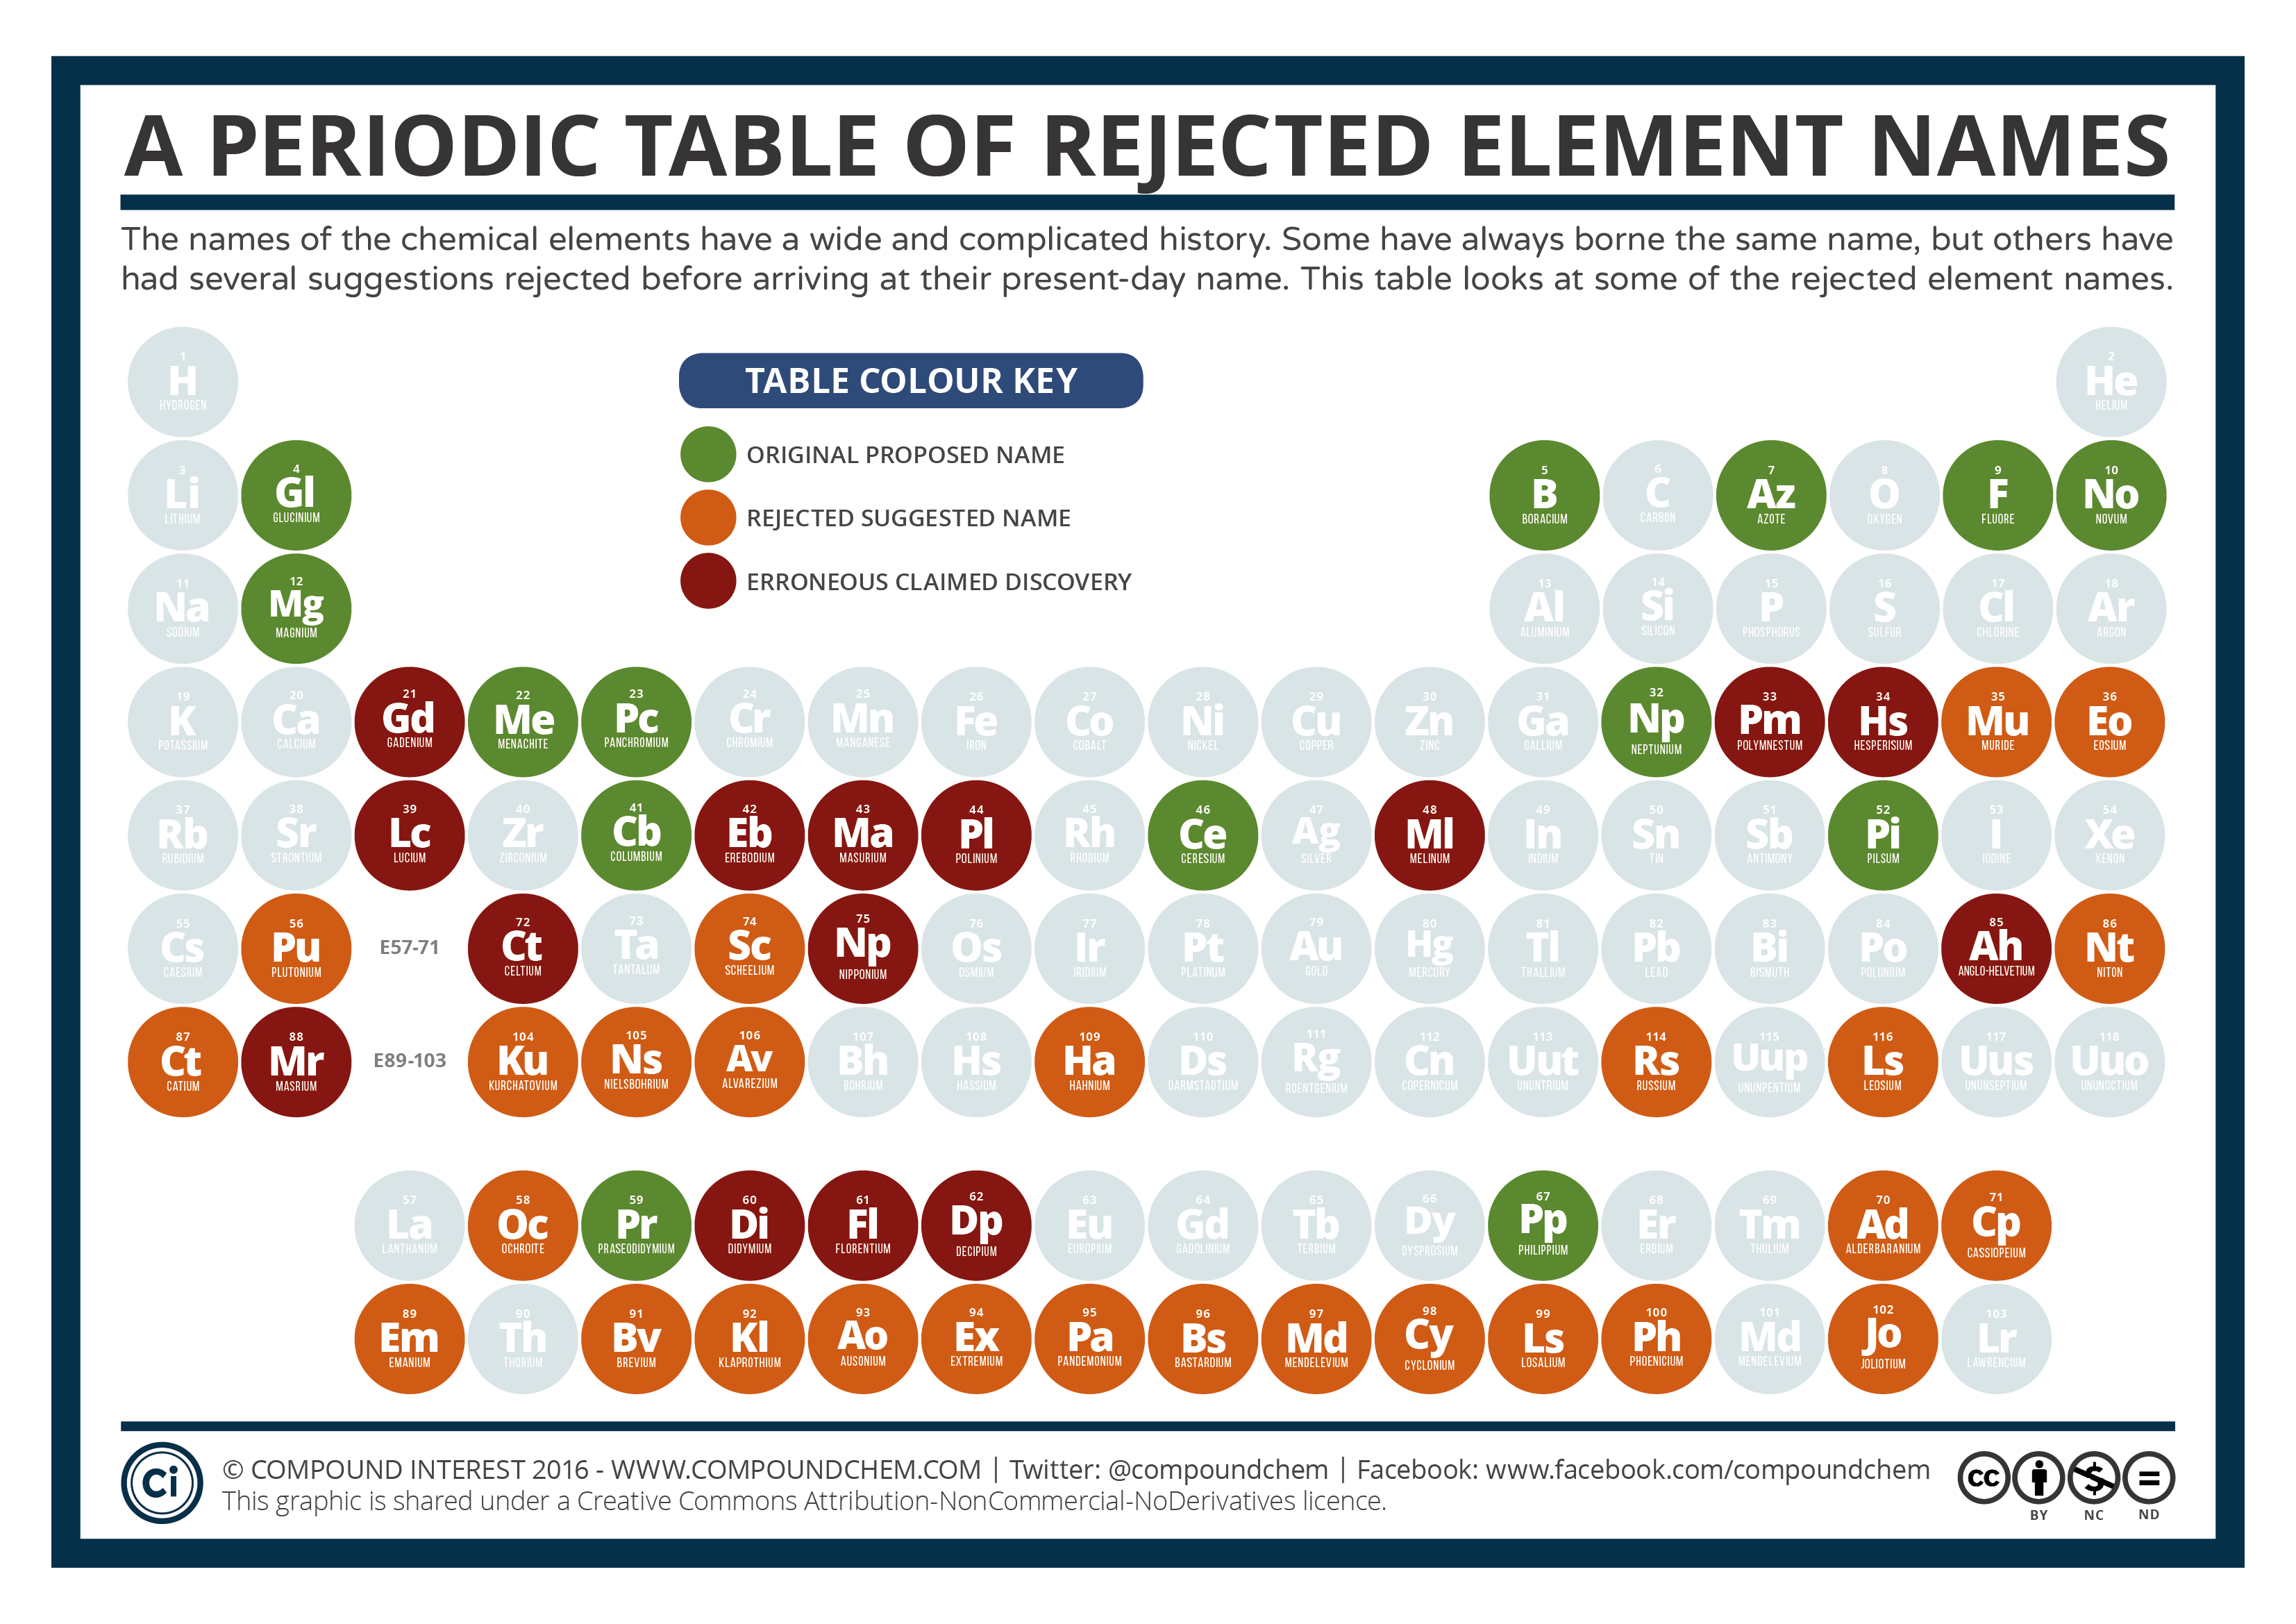
2018
Waterloo Periodic Table Project/Projet Tableau Périodique
To celebrate the International Year of Chemistry (IYC), Chem 13 News magazine together with the University of Waterloo's Department of Chemistry and the Faculty of Science encouraged chemistry educators and enthusiasts worldwide to adopt an element and artistically interpret that element.
The project created a periodic table as a mosaic of science and art. Students from all Canadian provinces and territories, 20 U.S. states and 14 countries researched, created and designed the elemental tiles. We created a poster, wall mural and a mobile app. The app includes the creative process behind each tile along with basic atomic properties of the element. The free app work to truly highlight the artistic expression of the Periodic Table Project. Thank you to all the teachers and students who participated in the collaborative Periodic Table Project.
Read more on the University of Waterloo website.
Click here image to enlarge the PT below.
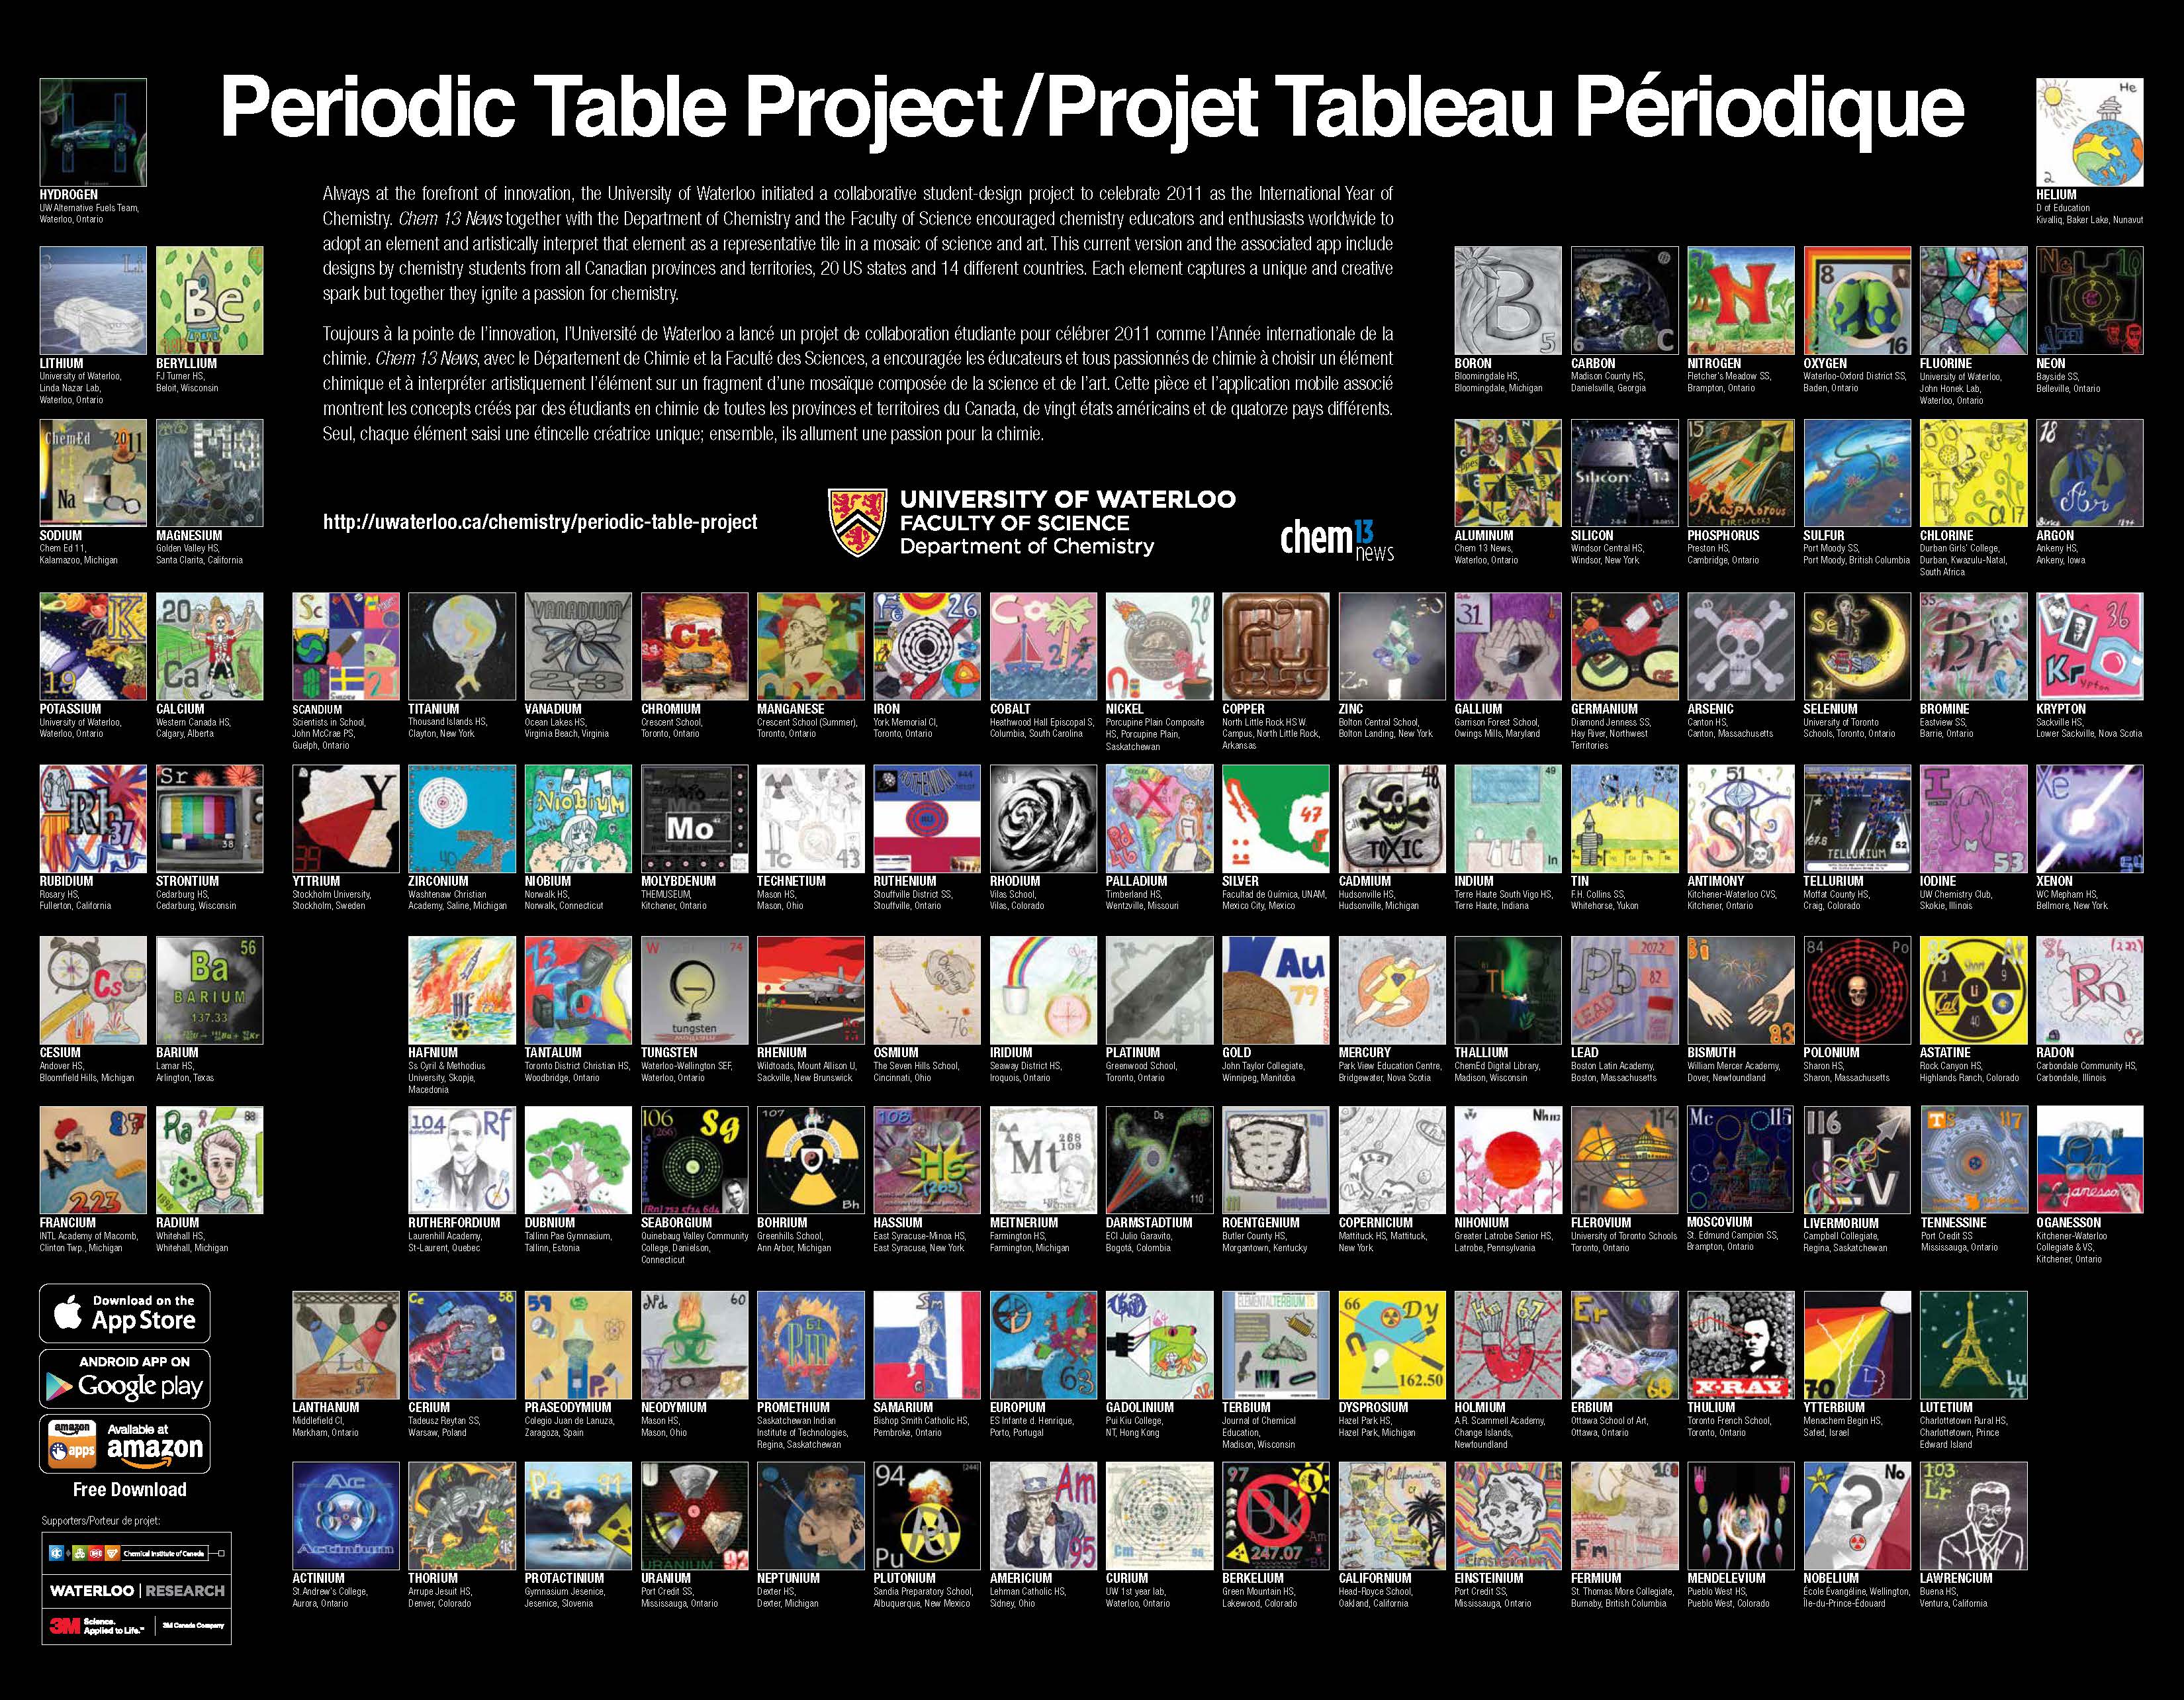
1993
WebElements: The Periodic Table on The Web
Mark Winter's WebElements was started in 1993 when it was one of the first websites on the internet.
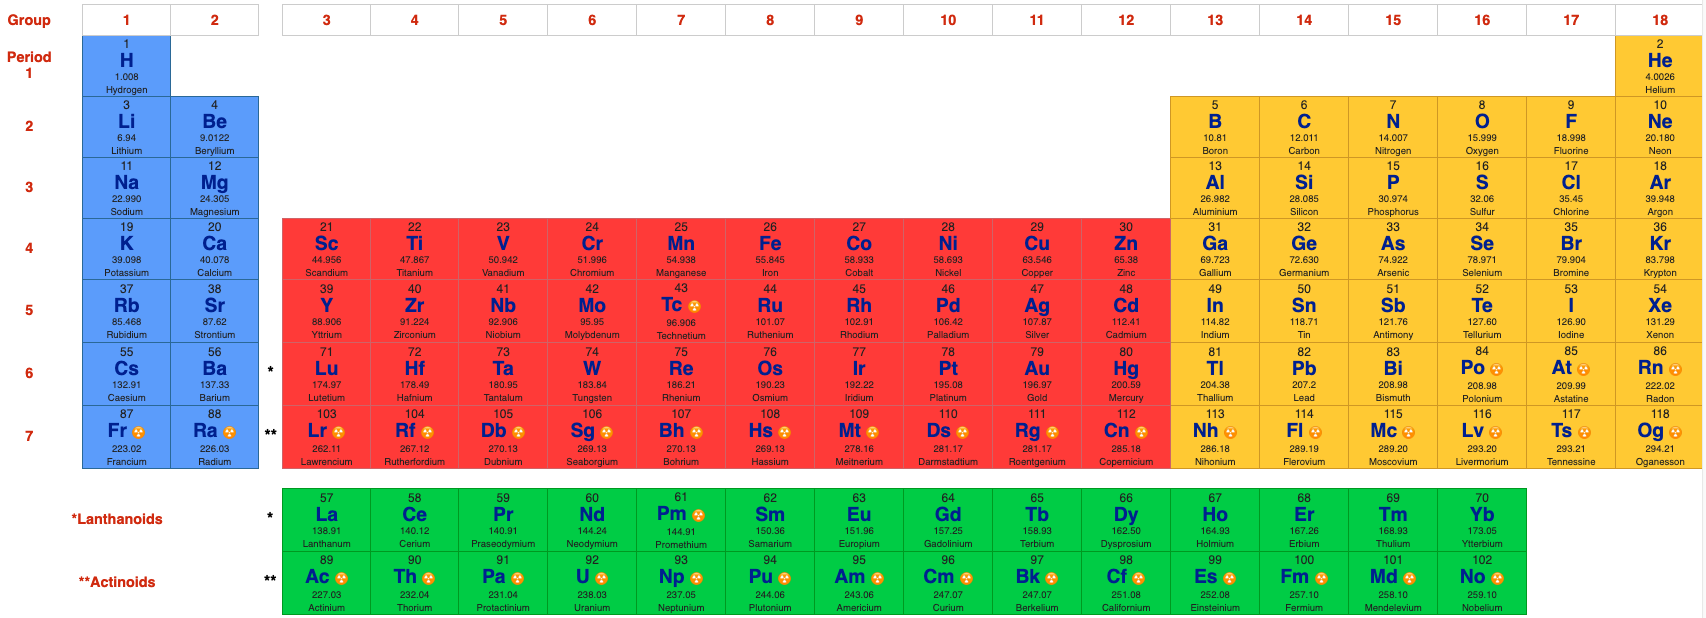
Mark Leach's Chemogenesis web book uses the WebElements periodic table as its master data source, and it does not attempt to duplicate it.
|
Abundance of
elements (Earth's crust) |
Electronegativities
|
Oxidation states
in compounds |
2016
Where Your Elements Came From Periodic Table
- The hydrogen in your body, present in every molecule of water, came from the Big Bang. There are no other appreciable sources of hydrogen in the universe.
- The carbon in your body was made by nuclear fusion in the interior of stars, as was the oxygen.
- Much of the iron in your body was made during supernovas of stars that occurred long ago and far away.
- The gold in your jewelry was likely made from neutron stars during collisions that may have been visible as short-duration gamma-ray bursts.
- Elements like phosphorus and copper are present in our bodies in only small amounts but are essential to the functioning of all known life.
The featured periodic table, from Astronomy Picture of The Day (APOD) is color coded to indicate humanity's best guess as to the nuclear origin of all known elements. The sites of nuclear creation of some elements, such as copper, are not really well known and are continuing topics of observational and computational research.

Thanks to Marcus Lynch for the tip!
2022
Which Element is the Best?
The That Chemist YouTube channel asks "Which Element is the Best? Elements 1-20 & Elements 21-40"
That Chemist is a synthetic organic chemist and his bias is in that direction although he gives a variety of examples:
1934
White's Periodic Table
The periodic table of White shows the normal state electronic configurations, from H.E. White. Introduction to Atomic Spectra. New York: McGraw-Hill, 1934,
p. 85, Table 5.4..
Helium is clearly associated with H, and placed above Be in accord with the s2 electron configuration of the free atom.
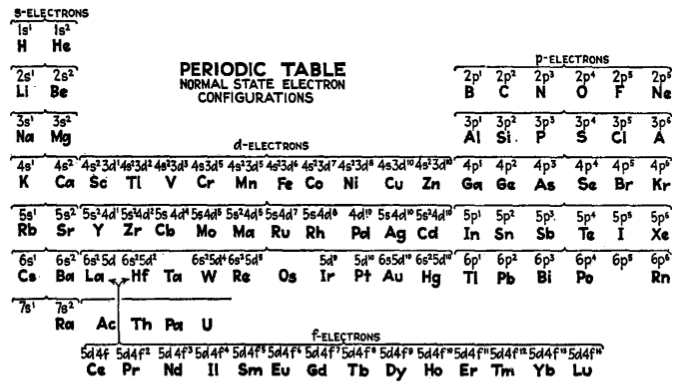
2001
Wikipedia Periodic Table
The Wikipedia Periodic Table pages are astonishing, giving hyper-linked data about:
- Formulations
- History
- Discovery
- Elements
- Isotopes
- Personalities
- Compounds
- etc.
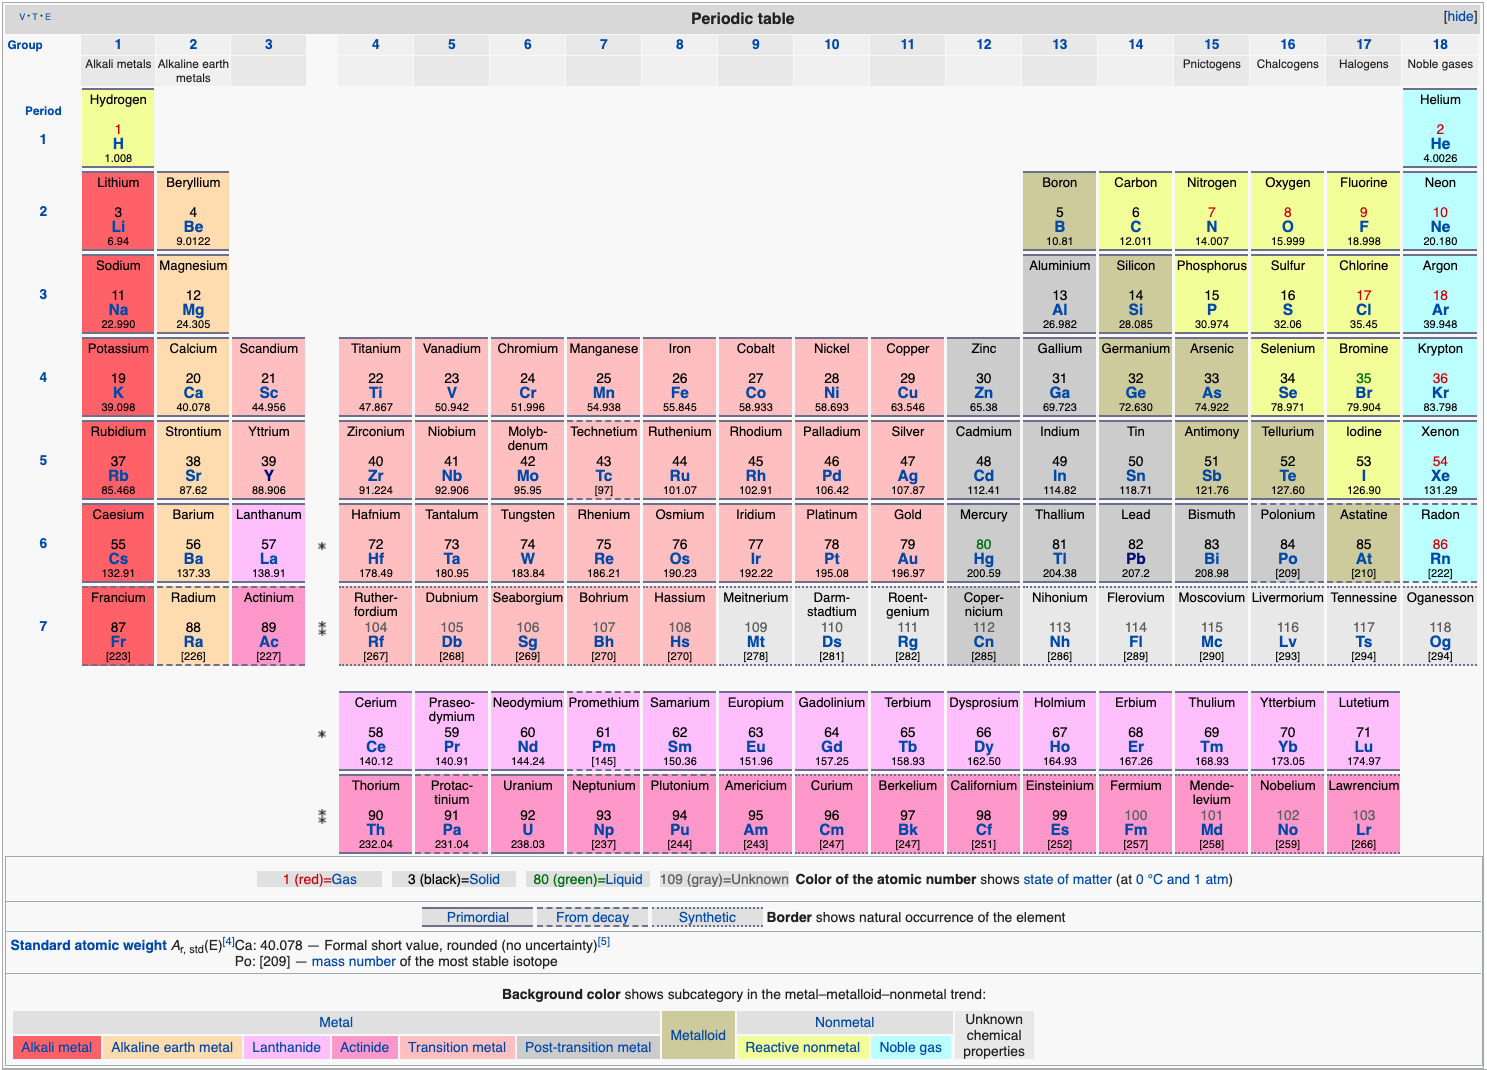
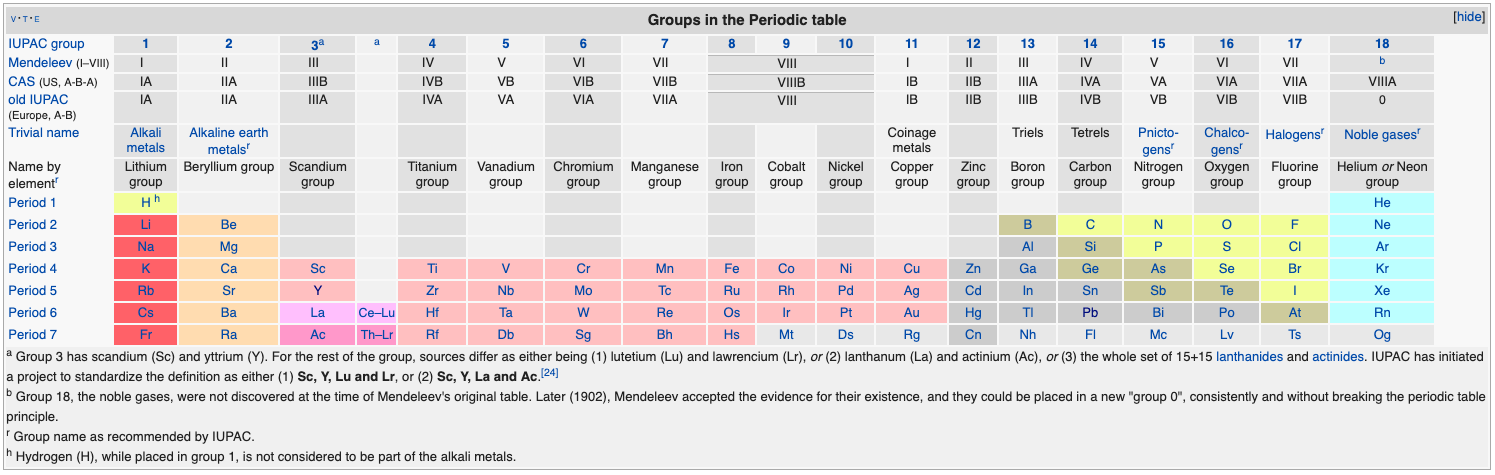
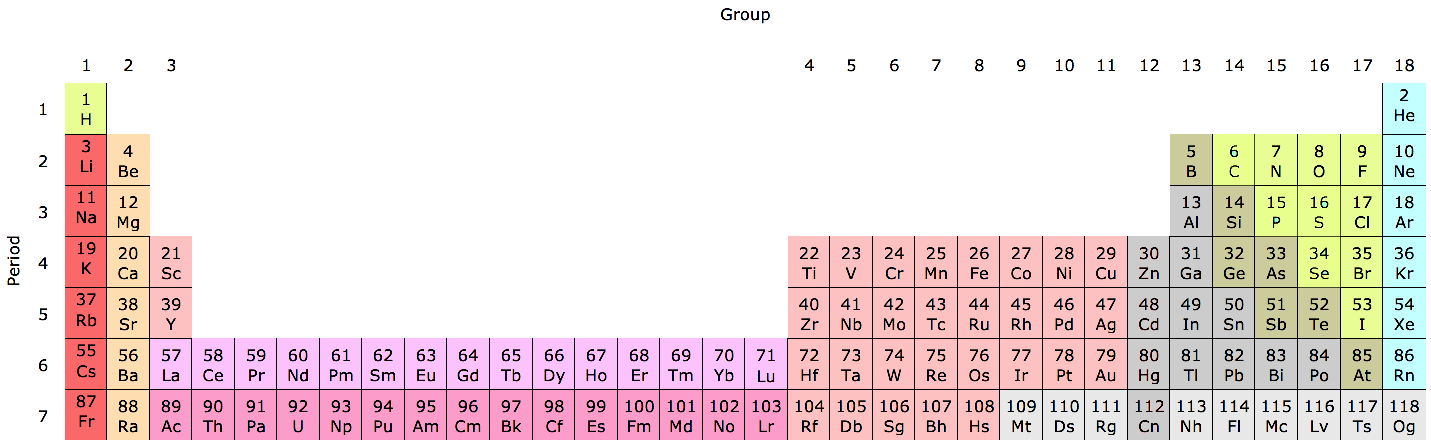
1813
Wollaston's Synoptic Scale of Chemical Equivalents
Philosophical Transactions: A Synoptic Scale of Chemical Equivalents by William Hyde Wollaston, M.D. Sec. R.S., or from here.
It is apparent that chemistry the years 1810 to 1850 was largely concerned with discovering the whole number stoichiometric ratios of atoms in chemical compounds.
Wollaston writes in the text above:
"It is impossible in several instances, where only two combinations of the same ingredients are known, to discover which of the compounds is to be regarded as consisting of a pair of single atoms, and since the decision of these questions is purely theoretical, and by no means necessary to the formation of a table adapted to most practical purposes, I have not been desirous of warping my numbers according to an atomic theory, but have endeavored to make practical convenience my sole guide, and have considered the doctrine of simple multiples, on which that of atoms is founded, merely as a valuable assistant in determining, by simple division, the amount of those quantities that are liable to such definite deviations from the original law of Richter."
"Mr. Dalton in his atomic views of chemical combination appears not to have taken much pains to ascertain the actual prevalence of that law of multiple proportions by which the atomic theory is best supported [however] it is in fact to Mr. Dalton that we are indebted for the first correct observation of such an instance of a simple multiple in the union of nitrous gas with oxygen."
"[I have] computed a series of supposed atoms, I [have] assumed oxygen as the decimal unit of my scale [ie. oxygen = 10], in order to facilitate the estimation of those numerous combinations which it forms with other bodies. Though the present table of Equivalents, I have taken care to make oxygen equally prominent on account of the important part it performs in determining the affinities of bodies by the different proportions in which it is united to them.."
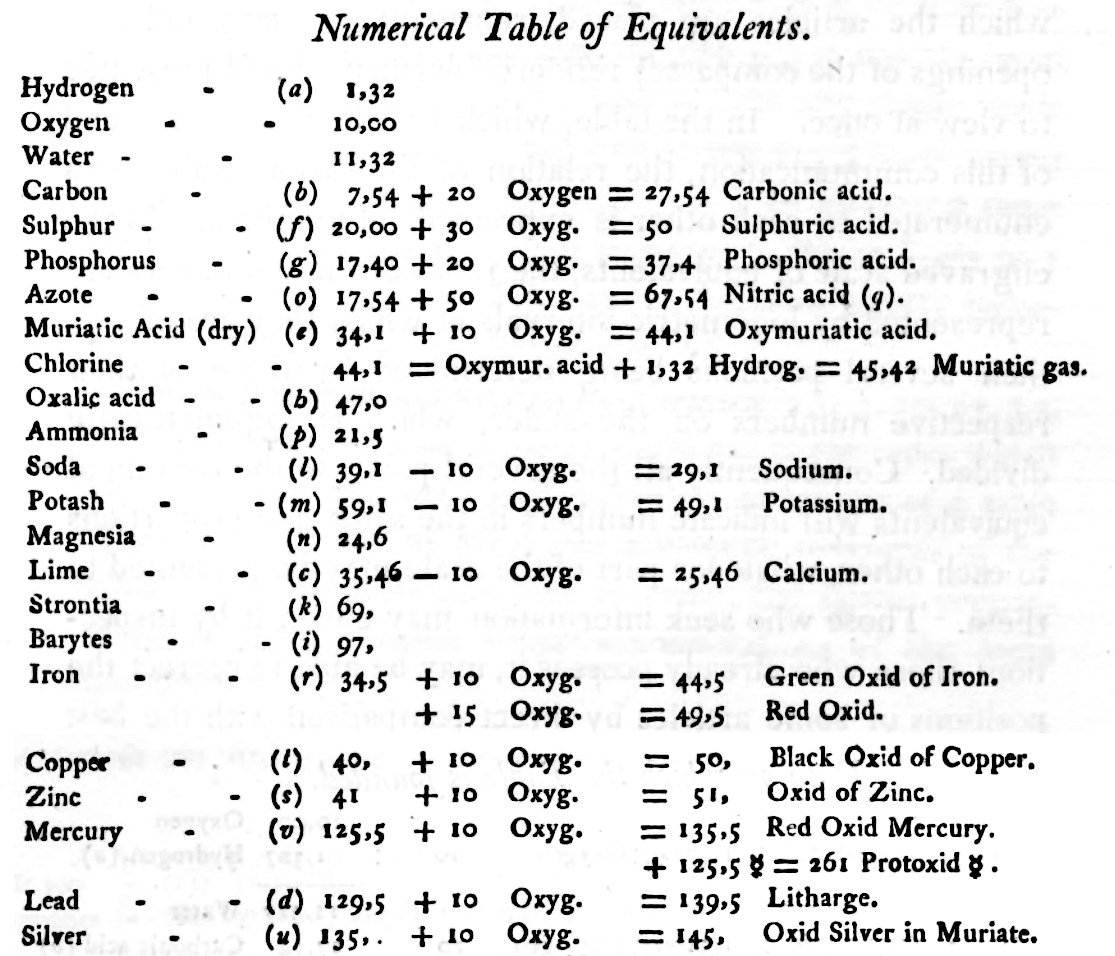
Mark Leach writes:
"When Wollaston's equivalent weights are converted from O = 10.00 to the modern value of O = 15.999, the atomic weight values can be seen to be astonishingly accurate.
"However, the language of the article is quite difficult as the meaning of many of the terms is unclear (to me, at least). For example, in modern usage adding 'ia' to a metal implies the oxide: 'magnesia' is magnesium oxide, MgO. I am not clear if this historical usage is consistent. 'Azote' is nitrogen and 'muriatic acid (dry)' is hydrogen chloride gas. I have only analyses/re-calculated the elements and a couple of common/obvious compounds:"
| Wollaston's data | Scaled to O = 15.999 | Modern Values | % error | |
| H (as H2) | 1.32 | 2.112 | 2.016 | 5% |
| O | 10.00 | 15.999 | 15.999 | ref. value |
| H2O | 11.32 | 18.111 | 18.015 | 1% |
| C | 7.74 | 12.383 | 12.011 | 3% |
| S | 20.00 | 31.998 | 32.060 | 0% |
| P | 17.40 | 27.838 | 30.974 | -11% |
| N (as N2) | 17.54 | 28.062 | 28.014 | 0% |
| Cl (as Cl2) | 44.10 | 70.556 | 70.900 | 0% |
| Fe | 34.50 | 55.197 | 55.845 | -1% |
| Cu | 40.00 | 63.996 | 63.546 | 1% |
| Zn | 41.00 | 65.596 | 65.380 | 0% |
| Hg | 125.50 | 200.787 | 200.590 | 0% |
| Pb | 129.50 | 207.187 | 207.980 | 0% |
| Ag | 135.00 | 215.987 | 107.870 | 50% |
- The elements hydrogen, nitrogen (azote) and chlorine have clearly been measured as the diatomic molecules, even if this was unknown to Wollaston in 1813.
- Phosphorus is out by 11%... [fair enough].
- Only silver is clearly wrong, but it is out by 50% so it looks like a simple stoichiometry error: Perhaps the oxide was assumed to be AgO was instead of the correct Ag2O.
Interestingly, Wollaston's analysis is far better than Daubeny's 1831 data seen in Oxford.
Read more in an entry concerning chemical slide rules.
Thanks to Nawa for the tip!
2020
Workshop on Teaching 3d-4s Orbitals Presented by Dr. Eric Scerri
Dr. Eric Scerri, UCLA Department of Chemistry & Biochemistry, discusses many of the issues concerning the periodic table: the aufbau principle, Madelung's rule, the electronic and anomalous electronic structures of the transition elements, the Sc2+ ion, the Janet Left Step, Group 3: Sc, Y, Lu, Lr vs. Sc, Y, La, Ac, atomic spectroscopy, etc.
Many of the topics that concern those of us interested in the periodic table are discussed.
Thanks to Eric Scerri – who appears – for the tip!
See the website EricScerri.com and Eric's Twitter Feed.
2010
World's Smallest Periodic Table
The World's Smallest Periodic Table:
1996
X-ray Absorption Edges
The periodic table links to tabulations of an elements characteristic x-ray absorption edge energies, and of the anomalous scattering coefficients f' and f" as a function of incident x-ray energy: