Periodic Table |
 |
 |
 |
 |
 |
 |
| Nucleosynthesis | QNs to PTs |
The Segrè Chart
The Segrè chart is a schema for viewing atoms & isotopes. Regions of stability and radioactive decay sequences can be mapped onto the schema.
Introduction
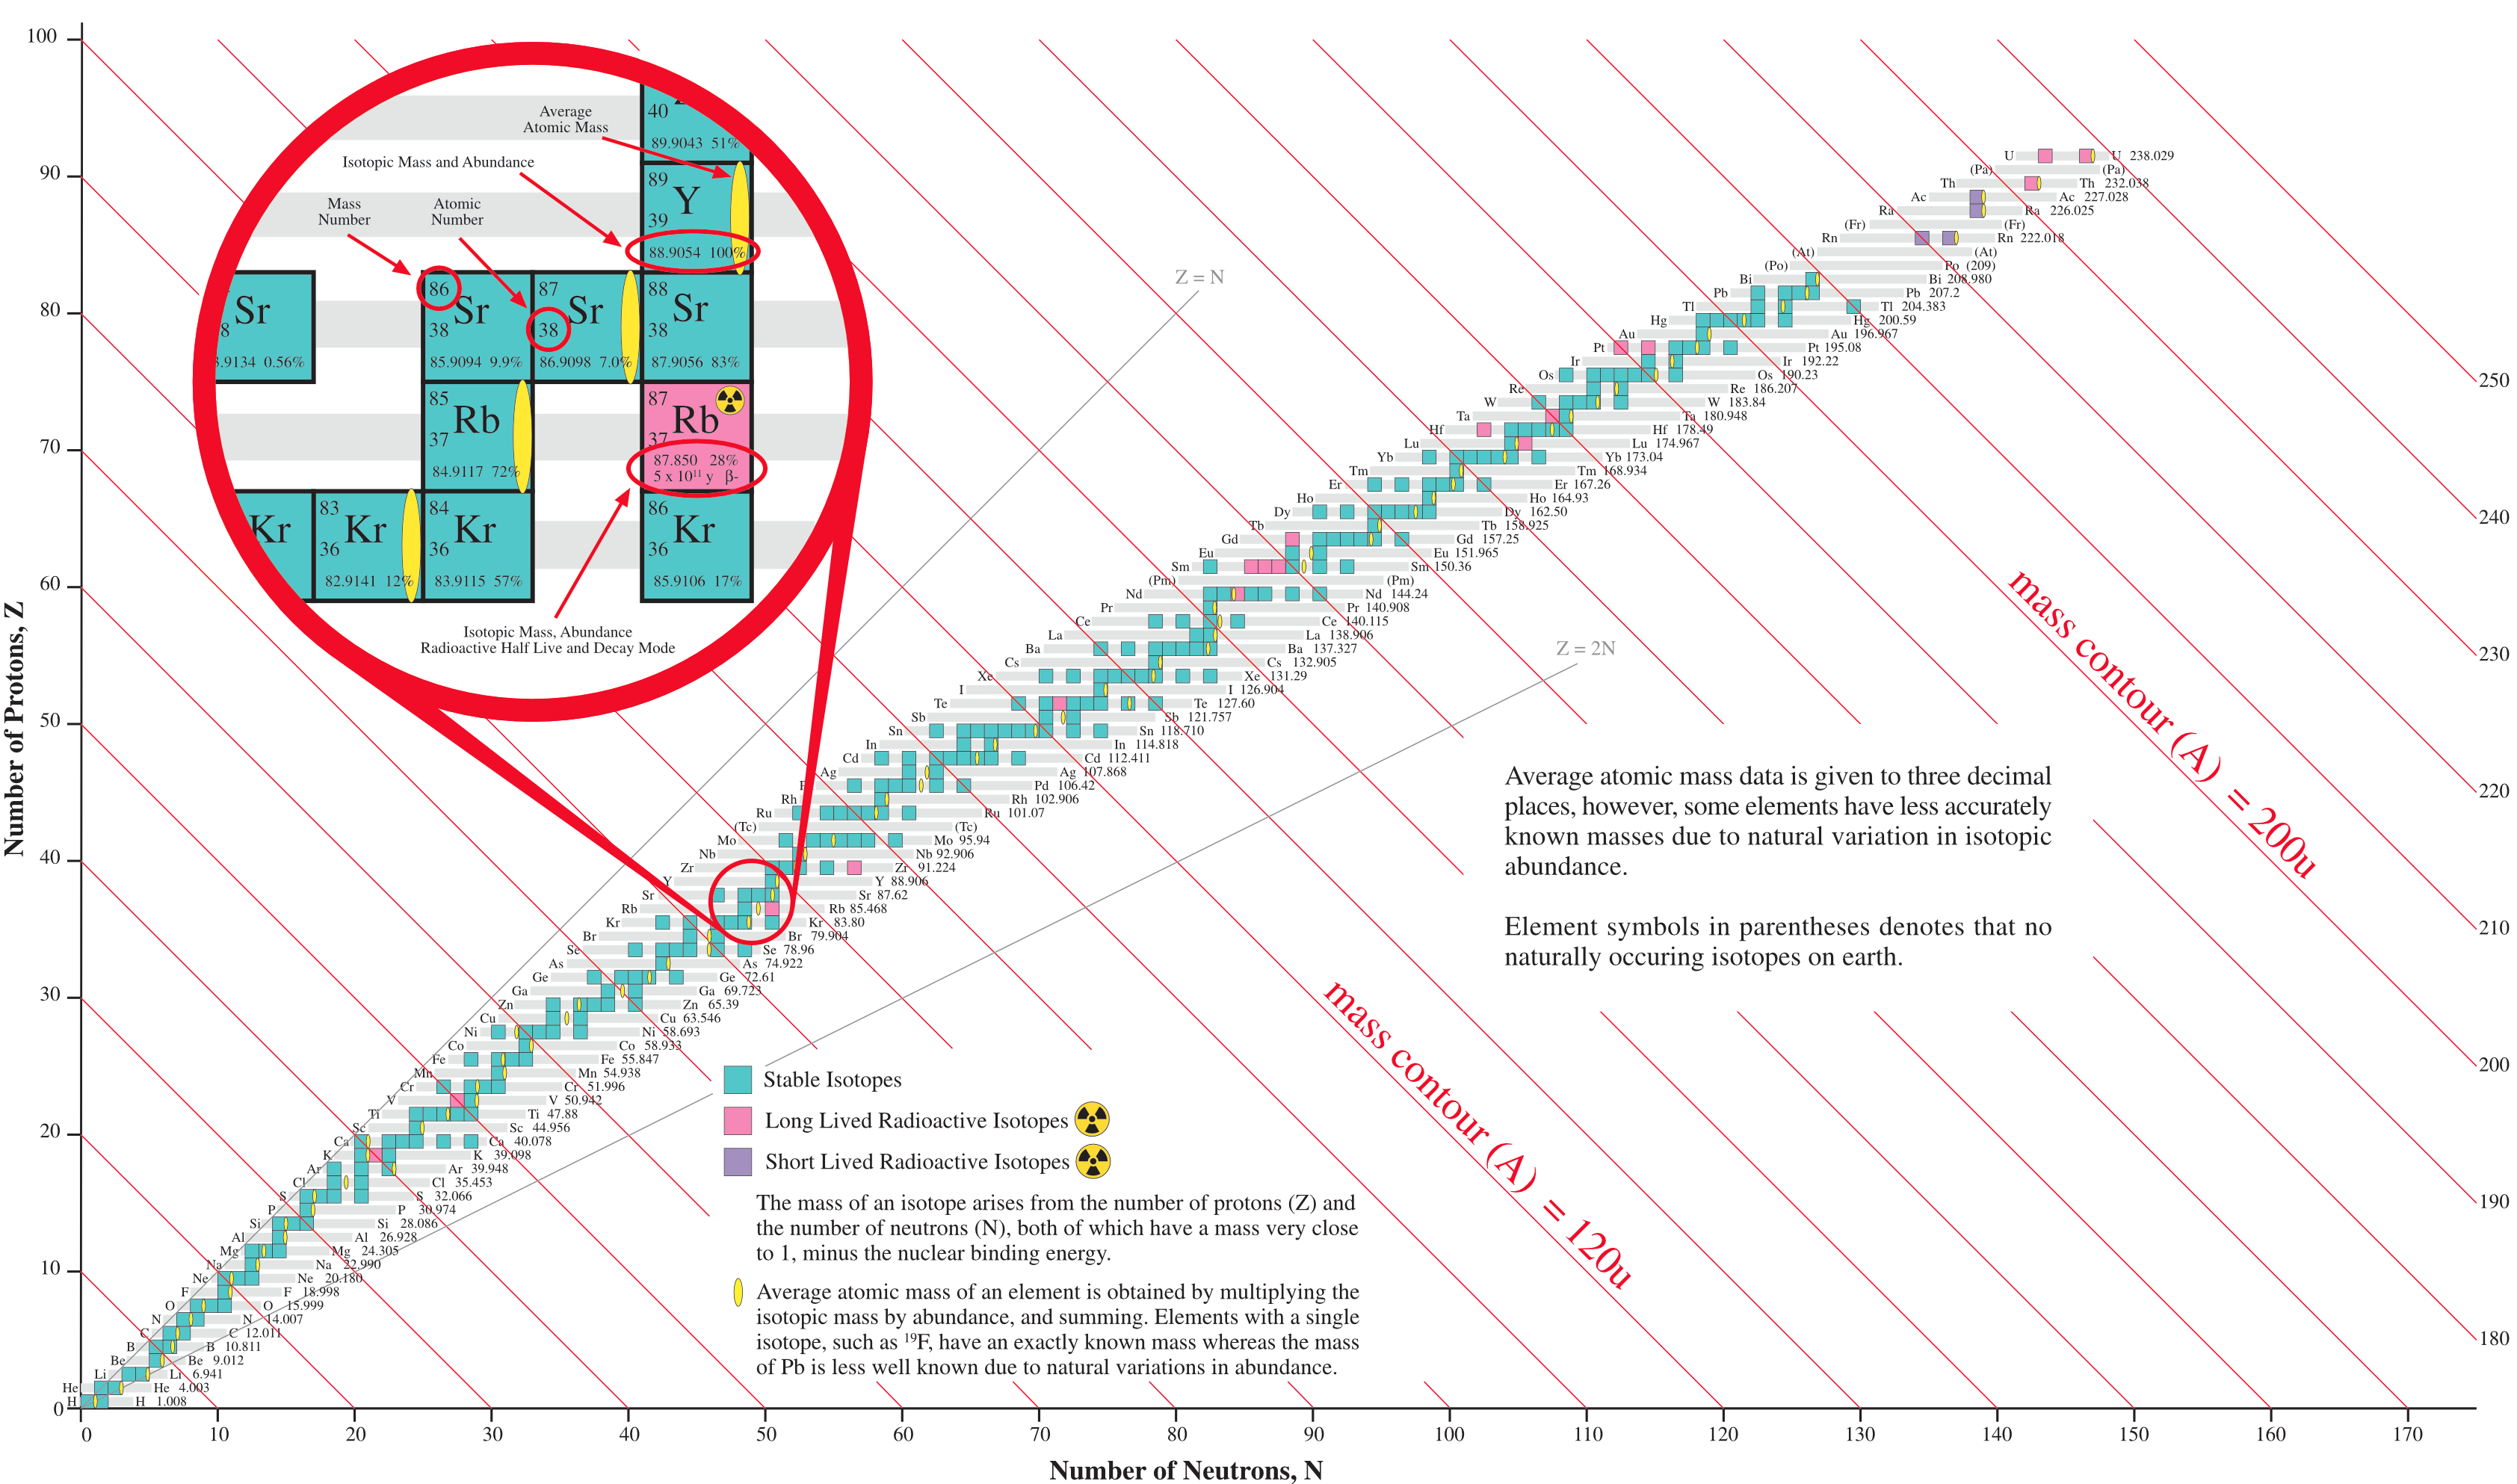
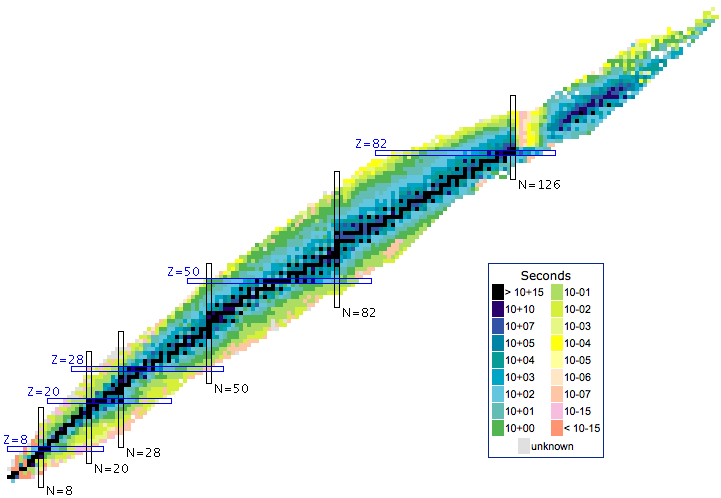
The Segrè chart arranges the products of nucleosynthesis – the individual isotopes – by neutron number vs proton number.
- The 254 stable isotopes present as a beautiful but fragile arc of stability in Segrè space:
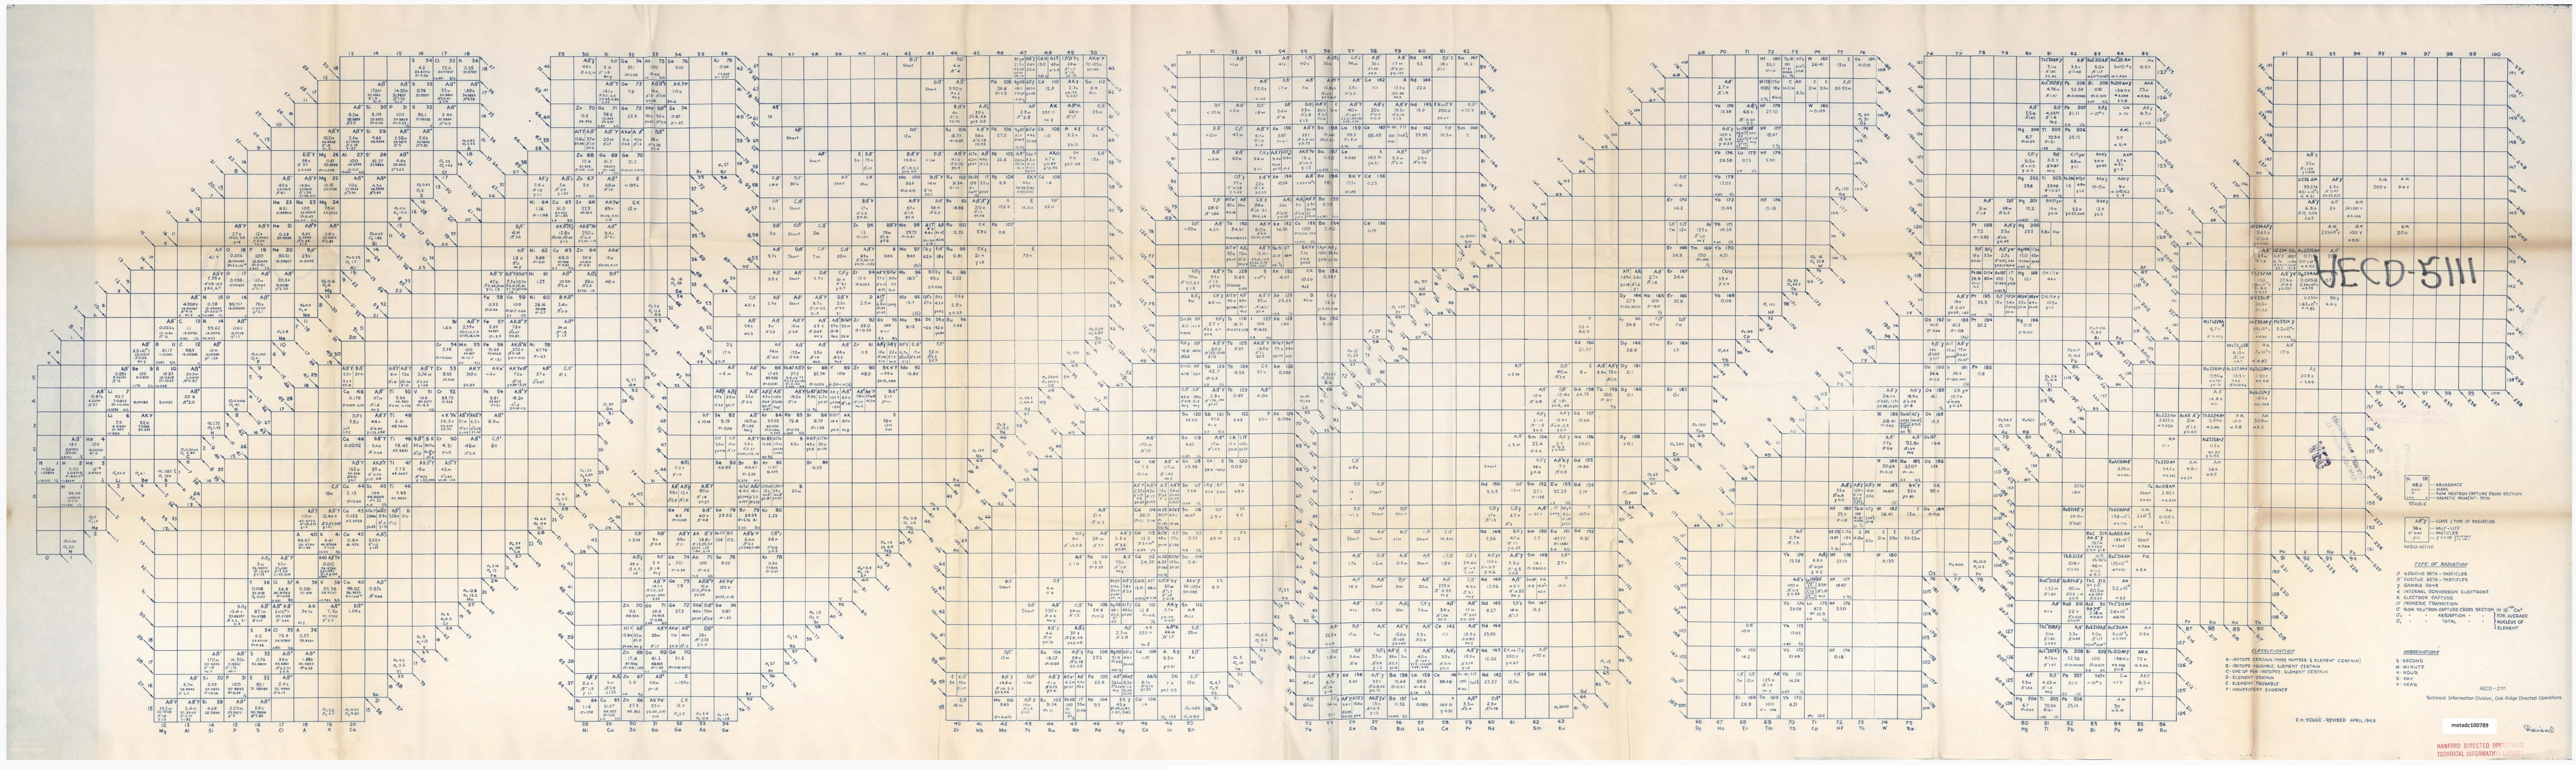
Below is the original 1948 Segrè chart, ref: Segrè, Emilio. Segrè Chart [Isotope Chart], technical drawing, April 1948; Oak Ridge, Tennessee. (https://digital.library.unt.edu/ark:/67531/metadc100789/: accessed February 17, 2026), University of North Texas Libraries, UNT Digital Library, https://digital.library.unt.edu; crediting UNT Libraries Government Documents Department:
- Emilio Segrè was an Italian-American physicist and Nobel laureate,
 who discovered the elements technetium and astatine, and the antiproton, a subatomic antiparticle, for which he was awarded the Nobel Prize in Physics in 1959. From 1943 to 1946 he worked at the Los Alamos National Laboratory as a group leader for the Manhattan Project. He found in April 1944 that Thin Man, the proposed plutonium gun-type nuclear weapon, would not work because of the presence of plutonium-240 impurities.
- Neutrons need to be present so that positively charged protons can bind together using the strong nuclear force.
- Slightly more than one neutron is required per proton and as the mass increases so does the neutron ratio. Carbon 12 has six protons and six neutrons. Iron 55 has 26 protons and 29 neutrons. Uranium 238 has 92 protons and 146 neutrons.
- Less than 300 isotopes are stable enough to exist naturally on Earth.
- So far, about 3000 have been observed in various nuclear experiments.
- It is thought that some 6000 combinations of protons and neutrons can exist, albeit fleetingly in many cases.
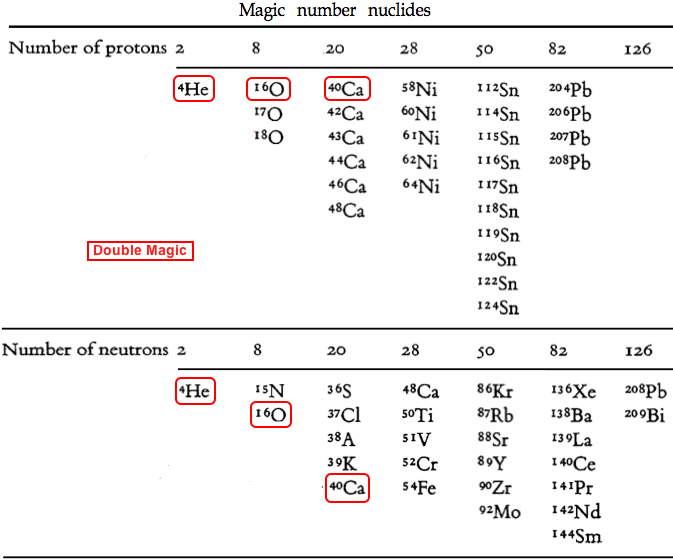
- Some particularly stable – and therefore common – isotopes have magic numbers of protons and/or neutrons. These arrangements can be explained by the Mayer shell model of nuclear structure, as discussed in her 1963 Nobel prize lecture, here.
- The magic numbers are: 2, 8, 20, 28, 50, 82 & 126, and the numbers are the same for protons and neutrons.
- Three isotopes: 4He, 16O & 40Ca are Double Magic:
- Isotopes have a very precisely known mass, list of isotope masses from NIST, although the mass is always actually quite close to the whole (integer) number, ± 0.8% or less.
12C = 12.000 000 0(0)
13C = 13.003 354 8378(10)
14C = 14.003 241 988(4)
- The carbon-12 isotope, 12C, is defined as having a mass of 12.000 exactly. All quoted isotopic and atomic masses are relative to the mass of the 12C isotope.
- Most chemical elements consist of a mixture of isotopes, and there is usually a slight variation in isotopic abundance from different sources. Thus, elements with more than one isotope can only have an average relative atomic mass.
Fluorine is one of a number of elements that has only one stable isotope, 19F, so its relative atomic mass is known to very high precision, 18.99840320(7).
Lead has four stable isotopes: 204Pb, 206Pb, 207Pb & 208Pb, but the relative abundances vary for interesting radionuclear and geological reasons. As a result, the average relative mass of lead is only accurate to 1 decimal place: 207.2(1)
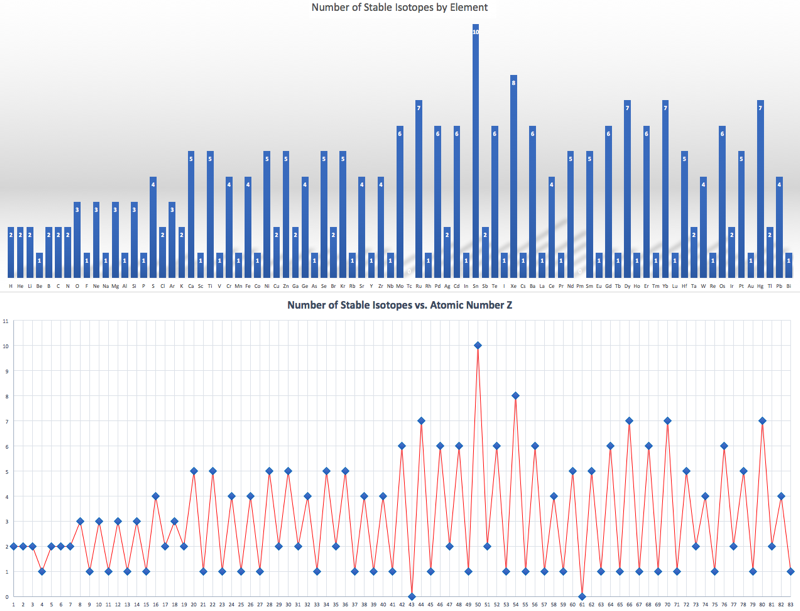
Interestingly, elements with an even atomic number have more stable isotopes than elements with an odd atomic number:
Radioactivity
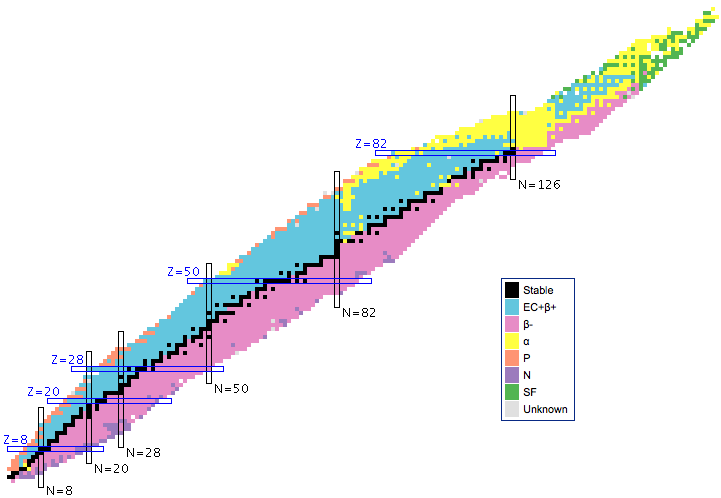
Nuclear stability and the various modes of radioactivity are associated with distinct regions of the Segré chart.
- There is a, N vs. Z backbone of stability.
- All heavy nuclei with Z > 82 are α-emitters.
- To the right of the stable N vs. Z backbone [as drawn], nuclei have an excess neutrons and nuclei undergo β-decay, emission of an electron. Free neutrons have a half-life of 617 seconds.
- To the left of the stable N vs. Z backbone (as drawn), nuclei have too few neutrons and either undergo electron capture or positron emission decay.
- There are many other rarer modes of decay.
- A particular nucleus may decay by more than one mode.
- A nucleus can be induced to undergo fission by capturing a neutron. The nucleus splits into two halves, the excess free neutrons and a burst of gamma radiation.

Resources
There are many Segrè chart resources in the web, including, an excellent interactive Segré chart from the National Nuclear Data Center showing many features such as half-life and decay mode (click to access):
See also:
Isotope (Wikipedia)
Segrè chart (Wikipedia)
Segrè chart (Brookhaven)
|
|
| Nucleosynthesis | QNs to PTs |
© Mark R. Leach 1999-
Queries, Suggestions, Bugs, Errors, Typos...
If you have any:
Queries
Comments
Suggestions
Suggestions for links
Bug, typo or grammatical error reports about this page,please contact Mark R. Leach, the author, using mark@meta-synthesis.com
This free, open access web book is an ongoing project and your input is appreciated.