Periodic Table |
 |
 |
 |
 |
 |
 |
| What is the Periodic Table Showing? | Periodicity |
The INTERNET Database of Periodic Tables
There are thousands of periodic tables in web space, but this is the only comprehensive database of periodic tables & periodic system formulations. If you know of an interesting periodic table that is missing, please contact the database curator: Mark R. Leach Ph.D. The database holds information on periodic tables, the discovery of the elements, the elucidation of atomic weights and the discovery of atomic structure (and much, much more).
| Year: 2021 | PT id = 1183, Type = formulation data |
Crustal Abundance vs. Electronegativity
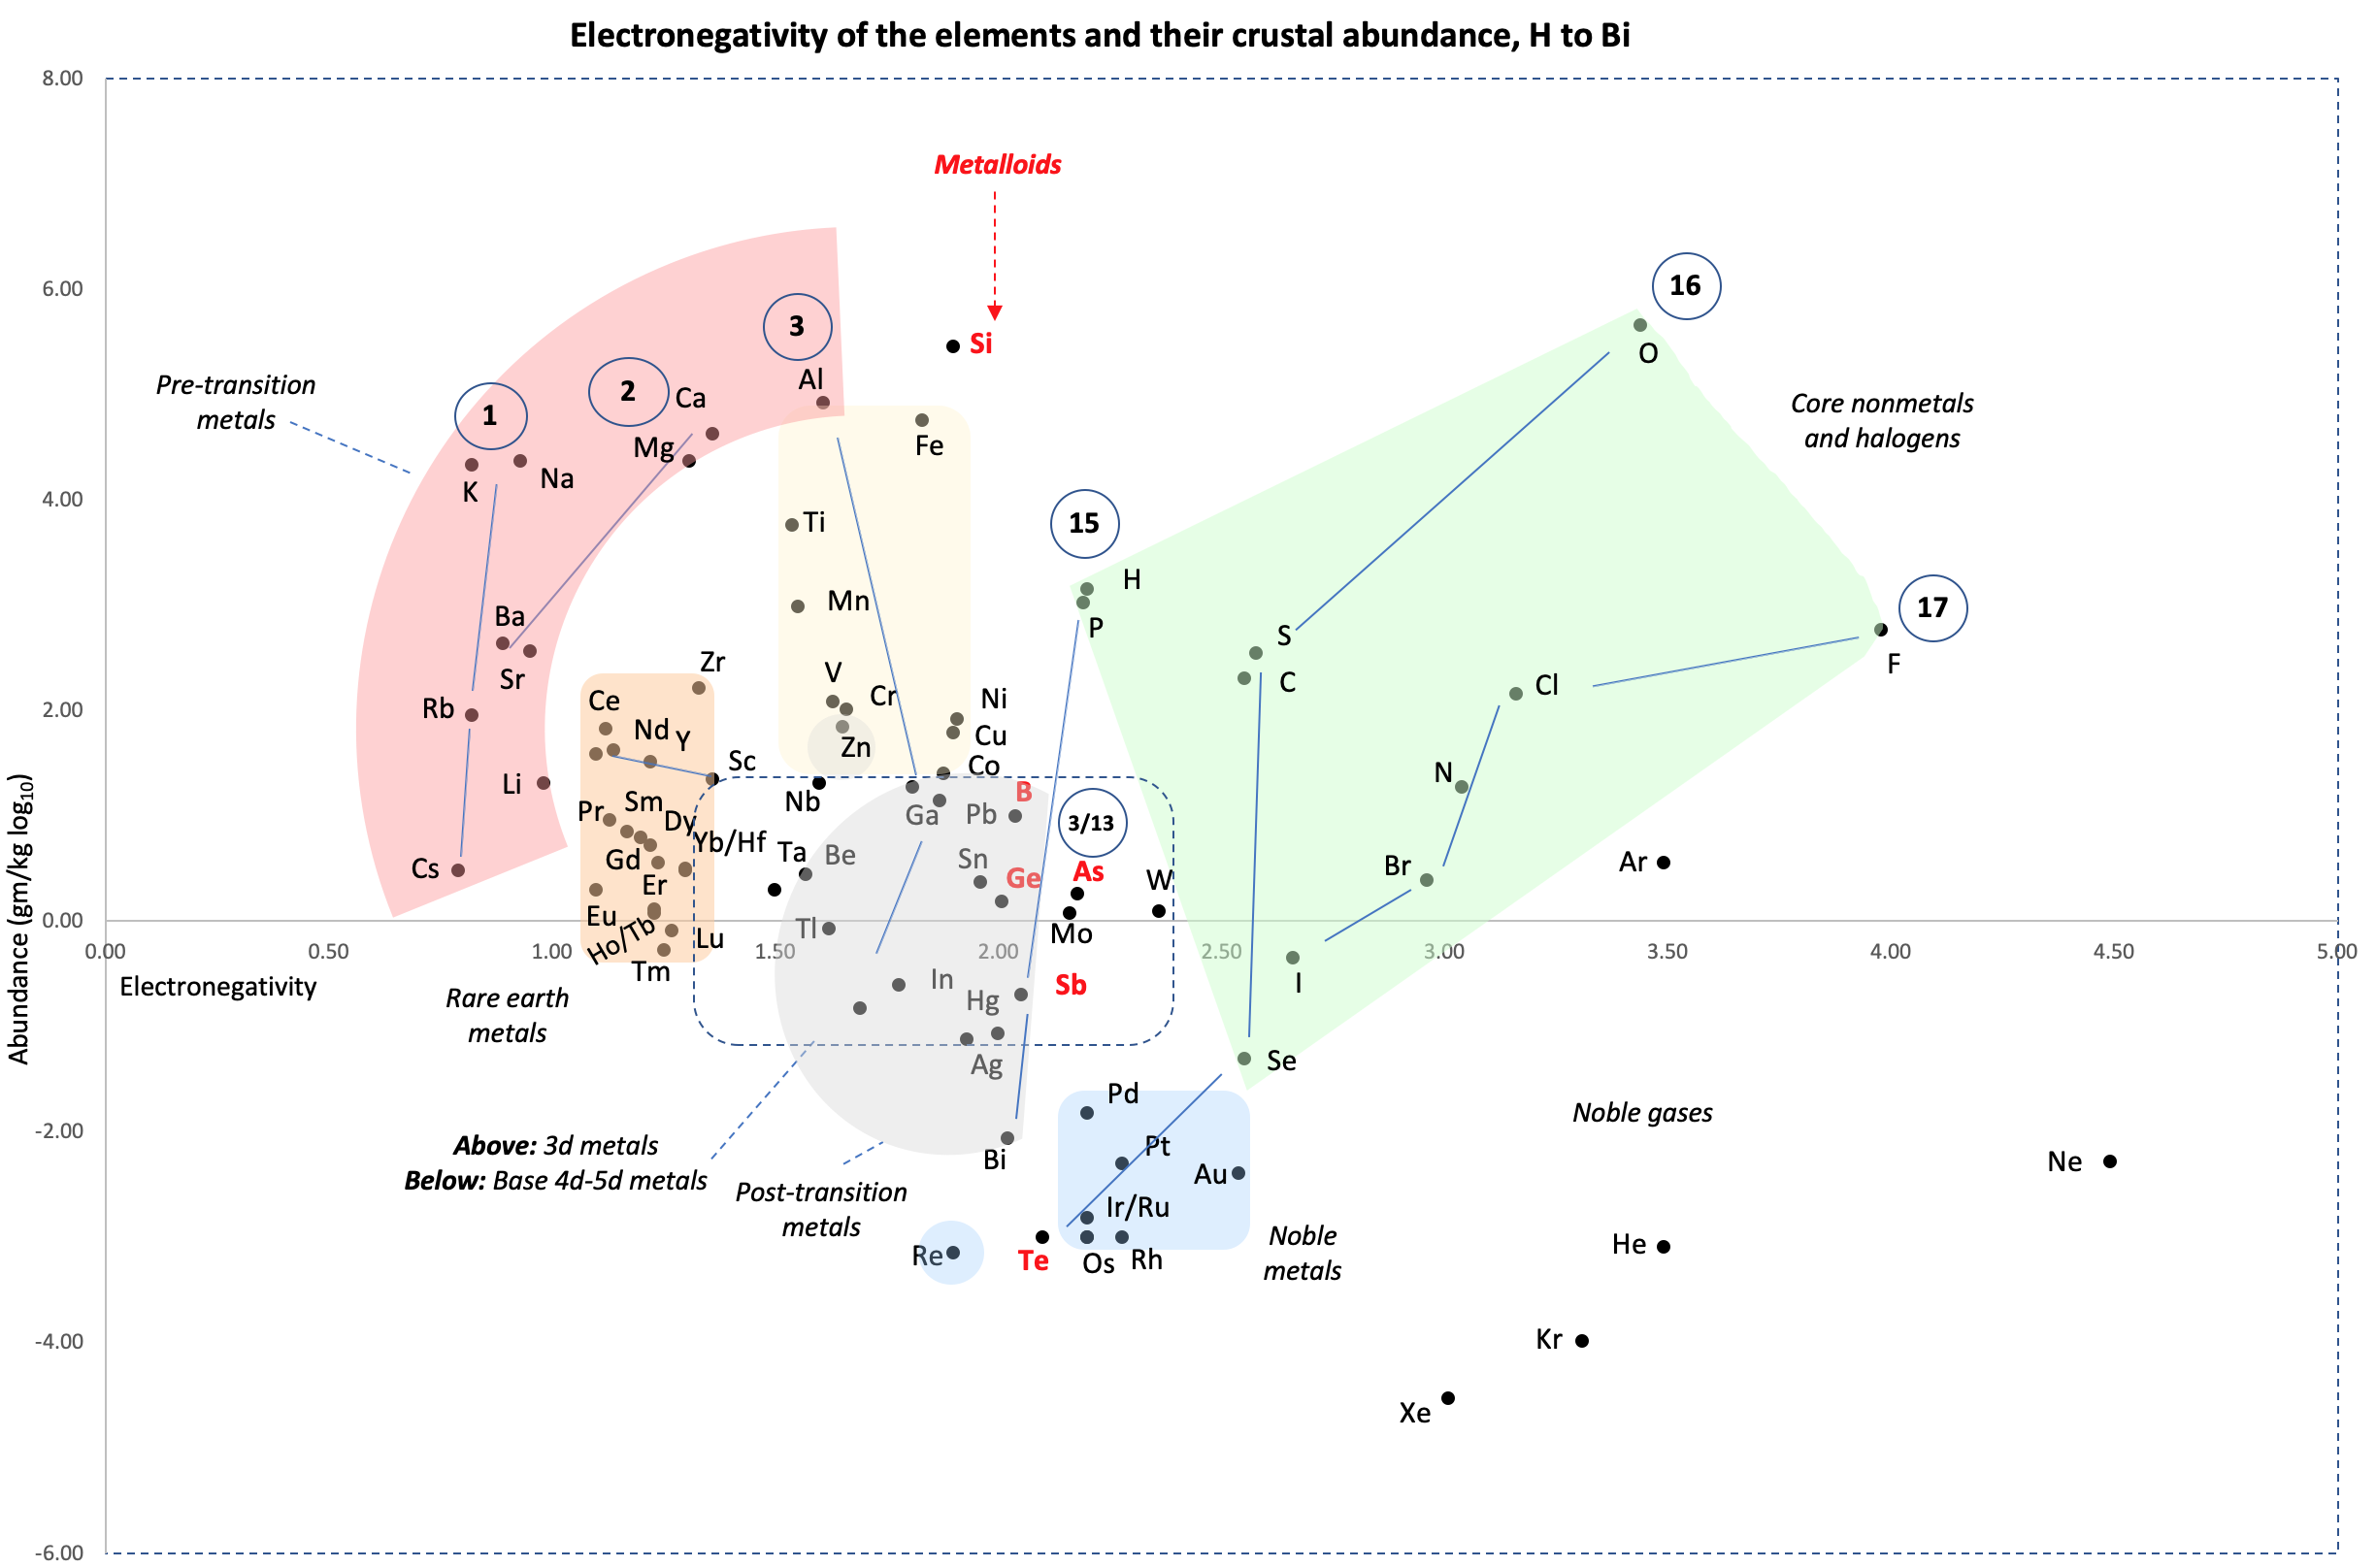
A chart by René Vernon of Elemental Abundance (g/kg log10) vs. Electronegativity, H to Bi.
René writes:
Below is a remarkable XY chart where x = electronegativity and y = crustal abundance (log10). It stops at the end of the s-process, at Bi. The abundance figures are from the CRC Hanbook of Physics and Chemistry (2016-2017).
I say remarkable as I had little idea what the chart would end up looking like when I started plotting the values.
As well as its coloured regions, I've marked out track lines for six of the main groups and one for group 3.
Observations
The rose-coloured arc on the left encompasses the pre-transition metals i.e. the alkali and alkaline earth metals and aluminium, followed by, in the orange rectangle, the rare earth metals. Opposite these regions, along the southern boundary of the green paddock, are the halogens.
In the pale yellow field sheltered by the pre-transition metals and the REM, are the 3d transition metals and, in the white corral, are 4d and 5d base transition metals. Opposite these regions, in the green paddock, are the core nonmetals H, C, N, O, P and S, with Se as an outlier.
Following in the grey blob are the post-transtion or poor metals, immediately adjacent to the bulk of the metalloids or poor nonmetals.
Finally, in the light blue patch, the noble metals are complemented by the noble gases frolicking in the open.
Abundance tends to decrease with increasing Z. Notable exceptions are Li, B, N and Si.
Curiosities
- H and P are almost on top of one another
- The proximity of Be to the post-transition metals, and its relative scarcity in the crust
- The metalloids, with their intermediate values of electronegativity, go down the middle. At the same time they span nearly the full range of abundance.
- B-Ga-Sc-Y-La are in a row
- N falls along the halogen line
- The abundance of O and Si, which we see in the form of silica
- F is more abundant in the crust than 85 percent of metals
- Al is the most abundant metal. Al and Fe are in the same vicinity: "Curiously, the chemistry of aluminium also resembles that of the iron(III) ion... These similarities may be ascribed to the same 3+ charge and near-identical ion radii (and hence charge density)." (Rayner-Canham 2020, p. 191)
- The abundance of Ar compared to the rest of the noble gases. Apparently this is influenced by the radioactive decay of potassium-40 in Earth's core, which is considered one of the main sources of heat powering the geodynamo that generates Earth's magnetic field. It has been suggested that a large amount of Ar may be present in the core, as the compound ArNi with an L11 Laves structure (similar to an intermetallic phase, and related to a cubic close packed lattice). ArNi is stabilised by notable electron transfer from Ni to Ar, changing their electron configurations toward 3d7 and 4s1. (Adeleke et al. 2019)
- Ti, a light yet strong metal, is about 2,500 times as abundant as Sn, a weak heavy metal
- Zn is an outlaw post-transition metal
- The most active 4d-5d transition metals (Zr, Hf) occupy a boundary overlap with the rare earth metals
- Ag, which has a largely main-group chemistry, is located in the PTM region. It is about 20 times as abundant as the noble meals
- Re is an outlaw noble metal
Comment
I was intrigued by the article referring to Ni and Ar, and the suggestion of Ar becoming somewhat anionic, albeit in extreme conditions (140 GPa, 1500 K)
References
- Adeleke AA, Kunz M, Greenberg E, Prakapenka VB, Yao Y, Stavrou R 2019, A high-pressure compound of argon and nickel: Noble gas in the Earth's core?, ACS Earth and Space Chemistry, vol. 3 no. 11, pp. 2517-2544, https://pubs.acs.org/doi/10.1021/acsearthspacechem.9b00212
- Rayner-Canham G, 2020, The periodic table: Past, present, future, World Scientific, Singapore
Correlations
I wasn't looking for these but they at least exist as follows:
- Metals with lower EN, i.e. < 1.7, or active nonmetals with higher EN, tend to be concentrated in silicate or oxide phases that are more easily found in the crust due to their lower density, and hence have higher abundances.
- Metals with moderate EN 1.7 to 2.1, say the later transition metals and post-transition metals, tend to form sulfide liquid phases; are less easily found in the crust due to their relatively higher densities; and are less abundant by about two orders of magnitude compared to the metals found in silicate or oxide phases.
- Metals with EN > 2.2, i.e. the noble metals, have an affinity for a metallic liquid phase, and are depleted in the crust since they generally sank to the core and hence have very low abundances. They are about two orders of magnitude less abundant than the sulfide metals.
My references are:
- Cox PA 1997, The elements: Their origin, abundance and distribution;
- Gill R 2014, Chemical fundamentals of geology and environmental geoscience;
- White WA 2020, Geochemistry
Thus the abundance of the metals in the crust tends to fall with increasing EN.
- For the nonmetals, the relative average abundance proportions are about 5: 700: 250: 1 for, respectively, the metalloids; the core nonmetals H, C, N, P, S, and Se; the halogen nonmetals; and the noble gases. Si and O were left out as outliers, in terms of their massive abundances.
- Thus, metalloids aside, the abundance of the nonmetals tends to fall with increasing EN. I don't know what's going on with the metalloids.
- The chart may prompt some further appreciative enquiry:
- In the case of exceptions to the initial three generalisations why do these occur?
- Why is Li so rare, compared to the other alkali metals?
- Why is Si good at forming a planetary crust?
An answer from L. Bruce Railsback, creator of the Earth Scientist's Periodic Table https://www.meta-synthesis.com/webbook/35_pt/pt_database.php?PT_id=142:
"I think I can answer one of the questions. 'Why is Si good at forming a planetary crust?' – because it's so bad at staying in the core. Silicon isn't sufficiently metallic to stay in the core. Even in the mantle and crust, it doesn't go into non-metal solids well: in cooling magmas, it's only a lesser member of the early-forming minerals (e.g., Mg2SiO4, forsterite, where it's outnumbered two to one). The mineral only of Si as a cation, SiO2 (quartz), is the LAST mineral to form as a magma cools, in essence the residuum of mineral-forming processes. At least some this thinking is at Bowen's Reaction Series and Igneous Rocks at http://railsback.org/FundamentalsIndex.html#Bowen"
- Why do the metalloids span such a wide range of abundances?
- If H is supposed to make up ca. 74% of the universe why does it have the same abundance in the Earth's crust as P?
- In what form is H found in Earth's crust—water, hydroxides?
- If H is supposed to make up ~ 74% of the universe why does it have the same abundance in the Earth's crust as P?
- Are there any chemical similarities between H and P, given both have some metalloidal character? The have virtually identically electron affinities. H is sometimes positioned above B due to chemical similarities. It then forms a diagonal relationship with C, which in turn has a diagonal relationship with P, which has a diagonal relationship with Se e.g. P reacts with Se to form a large number of compounds characterised by structural analogies derived from the white phosphorus P4 tetrahedron.
- The rare earth metals are relatively rare, having an average abundance of 1% that of the 3d metals. That being so, why is their rareness sometimes questioned? Why does the crustal abundance of the REM plummet by two orders of magnitude towards the end of the lanthanides?
Which Electronegativity Scale?
The wide variety of methods for deriving electronegativities tend to give results similar to one another.
|
|
| What is the Periodic Table Showing? | Periodicity |
© Mark R. Leach Ph.D. 1999 –
Queries, Suggestions, Bugs, Errors, Typos...
If you have any:
Queries
Comments
Suggestions
Suggestions for links
Bug, typo or grammatical error reports about this page,please contact Mark R. Leach, the author, using mark@meta-synthesis.com
This free, open access web book is an ongoing project and your input is appreciated.