Periodic Table |
 |
 |
 |
 |
 |
 |
| What is the Periodic Table Showing? | Periodicity |
The INTERNET Database of Periodic Tables
There are thousands of periodic tables in web space, but this is the only comprehensive database of periodic tables & periodic system formulations. If you know of an interesting periodic table that is missing, please contact the database curator: Mark R. Leach Ph.D. The database holds information on periodic tables, the discovery of the elements, the elucidation of atomic weights and the discovery of atomic structure (and much, much more).
The 10 most recent entries to the database:
| Year: 1957 | PT id = 1410, Type = review |
Mazurs: Types of graphic representation of the periodic system of chemical elements
Types of graphic representation of the periodic system of chemical elements is a 1957 self-published book by Edward G. Mazurs. The book was updated, and re-titled, to the much better known Graphic Representations of the Periodic System During One Hundred Years (University of Alabama Press) in 1974.
Edward G. Mazurs (1894–1983) was a chemist who wrote a history of the periodic system of the chemical elements which is still considered a "classic book on the history of the periodic table". Originally self-published as Types of graphic representation of the periodic system of chemical elements (1957), it was reviewed by the ACS in 1958 as "the most complete survey of the range of human imagination in representing graphically the Mendeleev periodic law."
Mark Leach writes:
Unfortunately, Mazurs re-draws all of the periodic tables in both his books; he adds elements that were not known at the time of formulation and sometimes takes great liberties by rotating images by 90° (without comment), including Mendeleev's formulations of 1869. His classification system is confusing. As Wikipedia says: "Mazurs's books are difficult to use because the references are divided into 146 corresponding sections, and the index refers to the types and not to pages. Nevertheless, his references are the most comprehensive and accurate ever compiled for the period covered. He cited authors writing in at least 24 languages and from fifty countries."
| Year: 1857 | PT id = 1409, Type = weight |
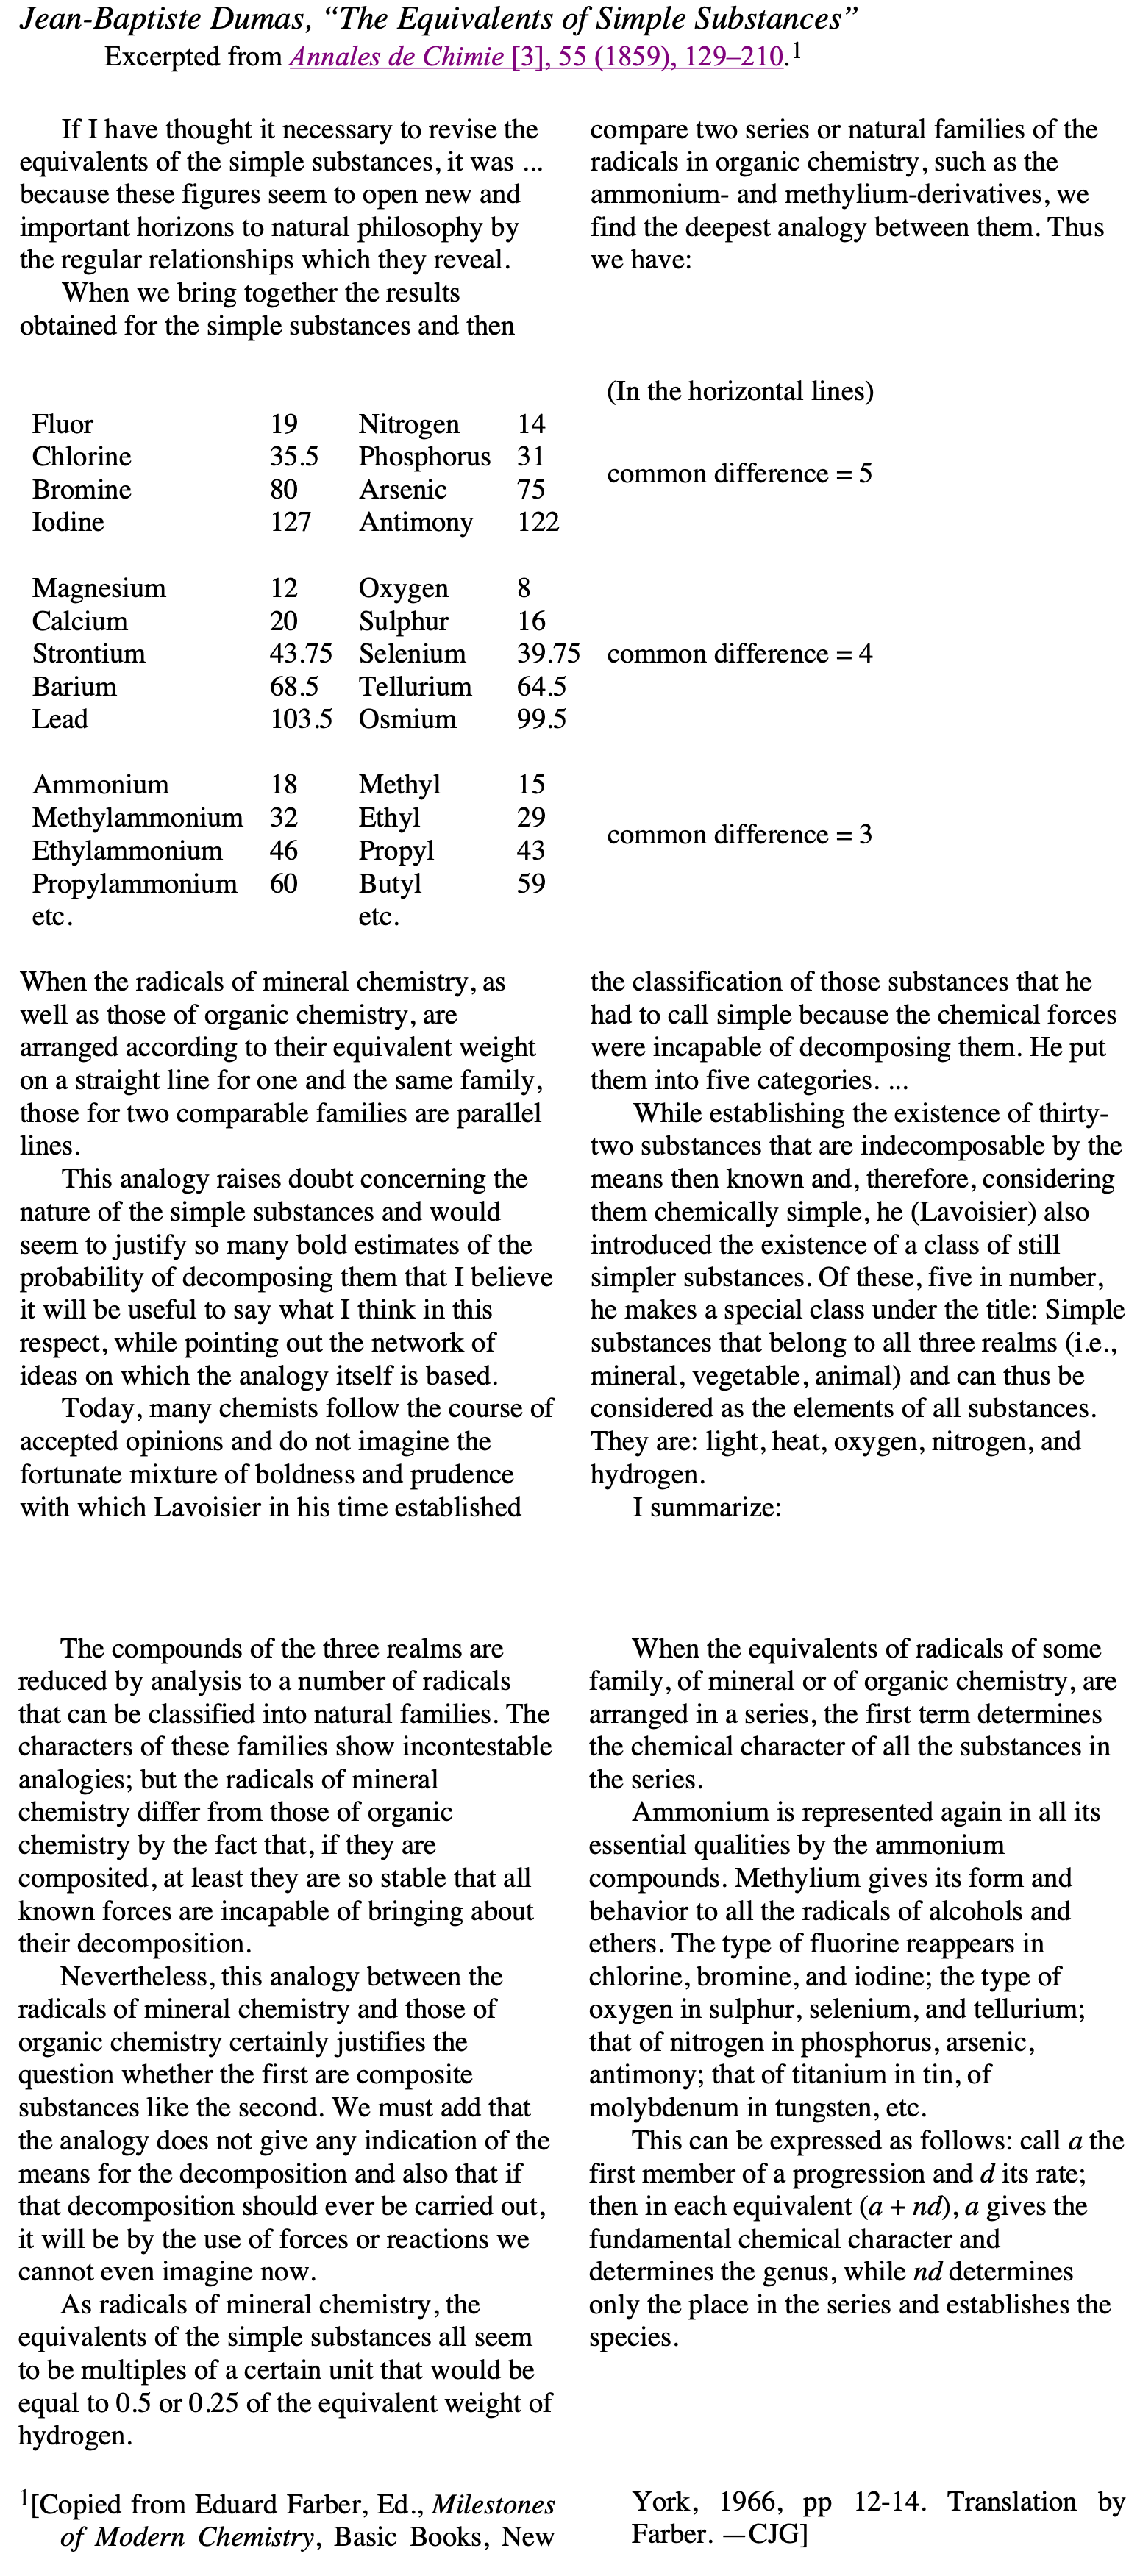
Dumas's Study of Atomic Weight ("The Equivalents of Simple Substances")
Cannizzario cited Dumas in his letter or 'Sumto' of 1858.
Annales de Chimie [3], 55 (1858), 129–210:

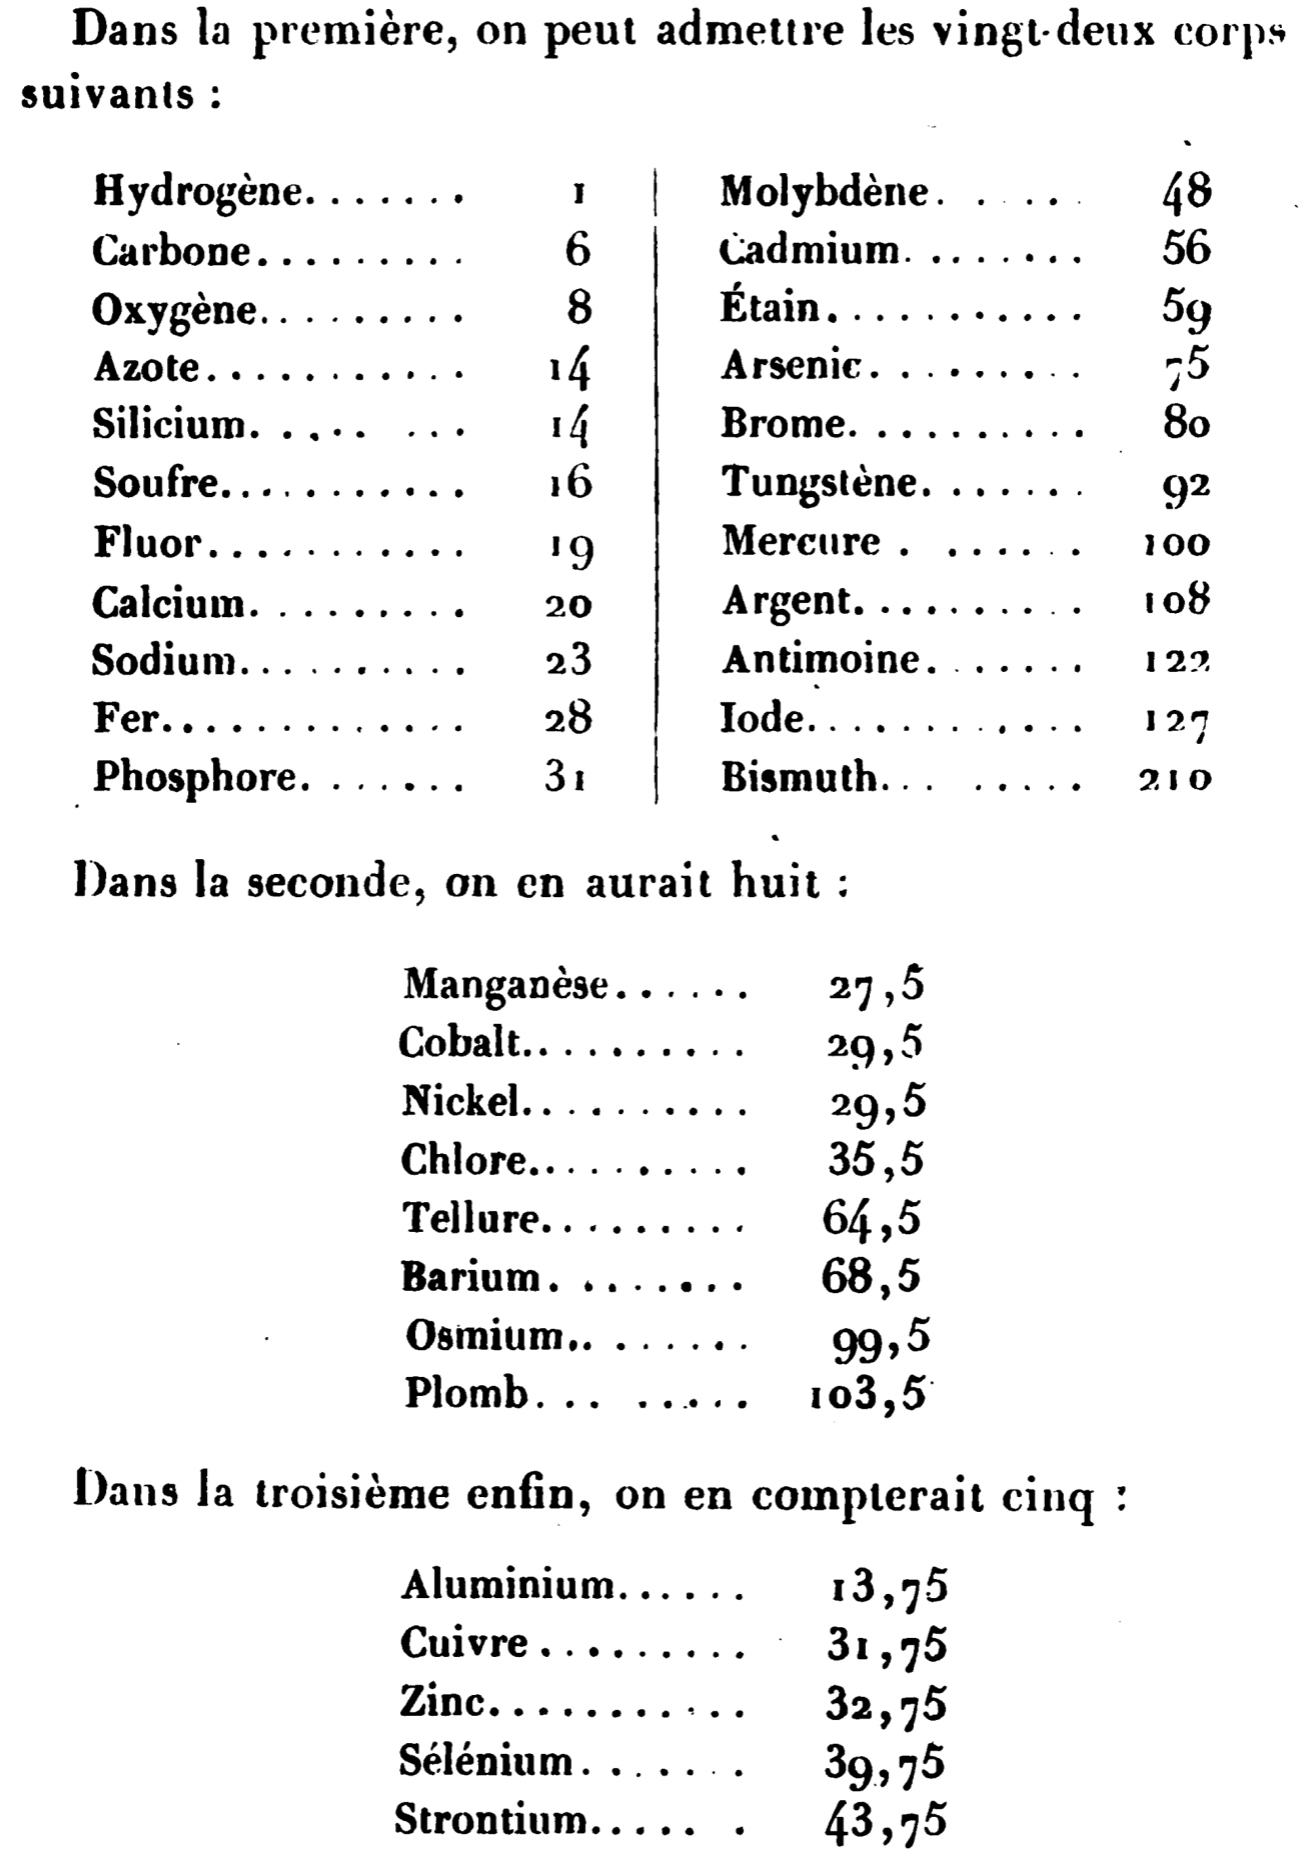
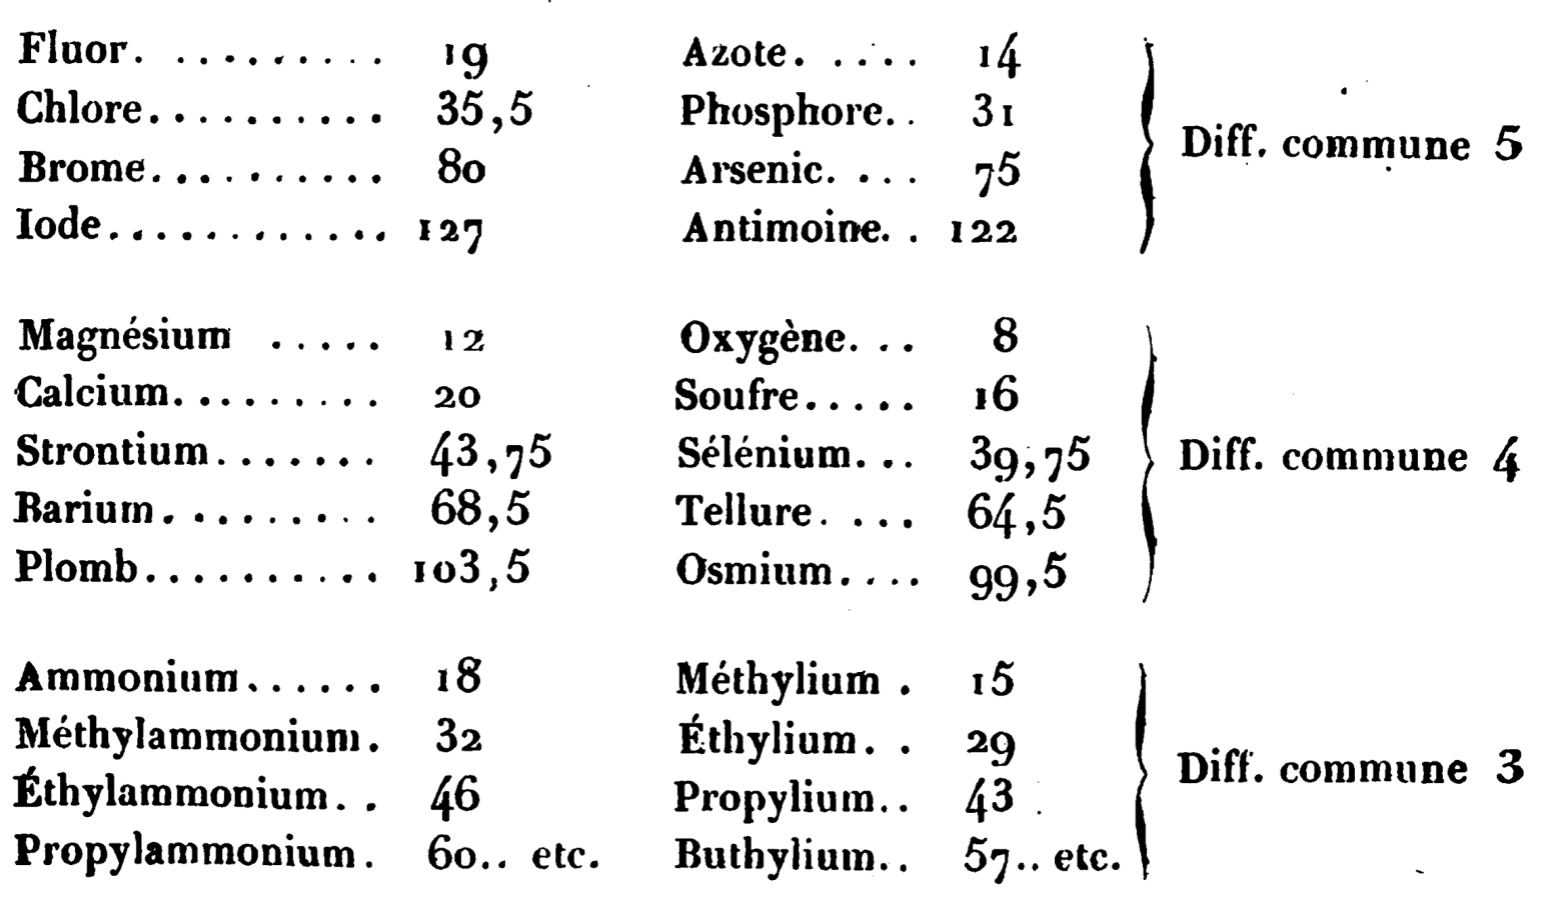
There is an English tranlation of the important passage from the Carmen Giunta website:
| Year: 2026 | PT id = 1408, Type = formulation misc |
Aperiodic Table
(Exploiting a quirk of the English language) Aperiodic Table by XKCD:

Thanks to Marcus for the tip!
| Year: 1997 | PT id = 1407, Type = formulation review |
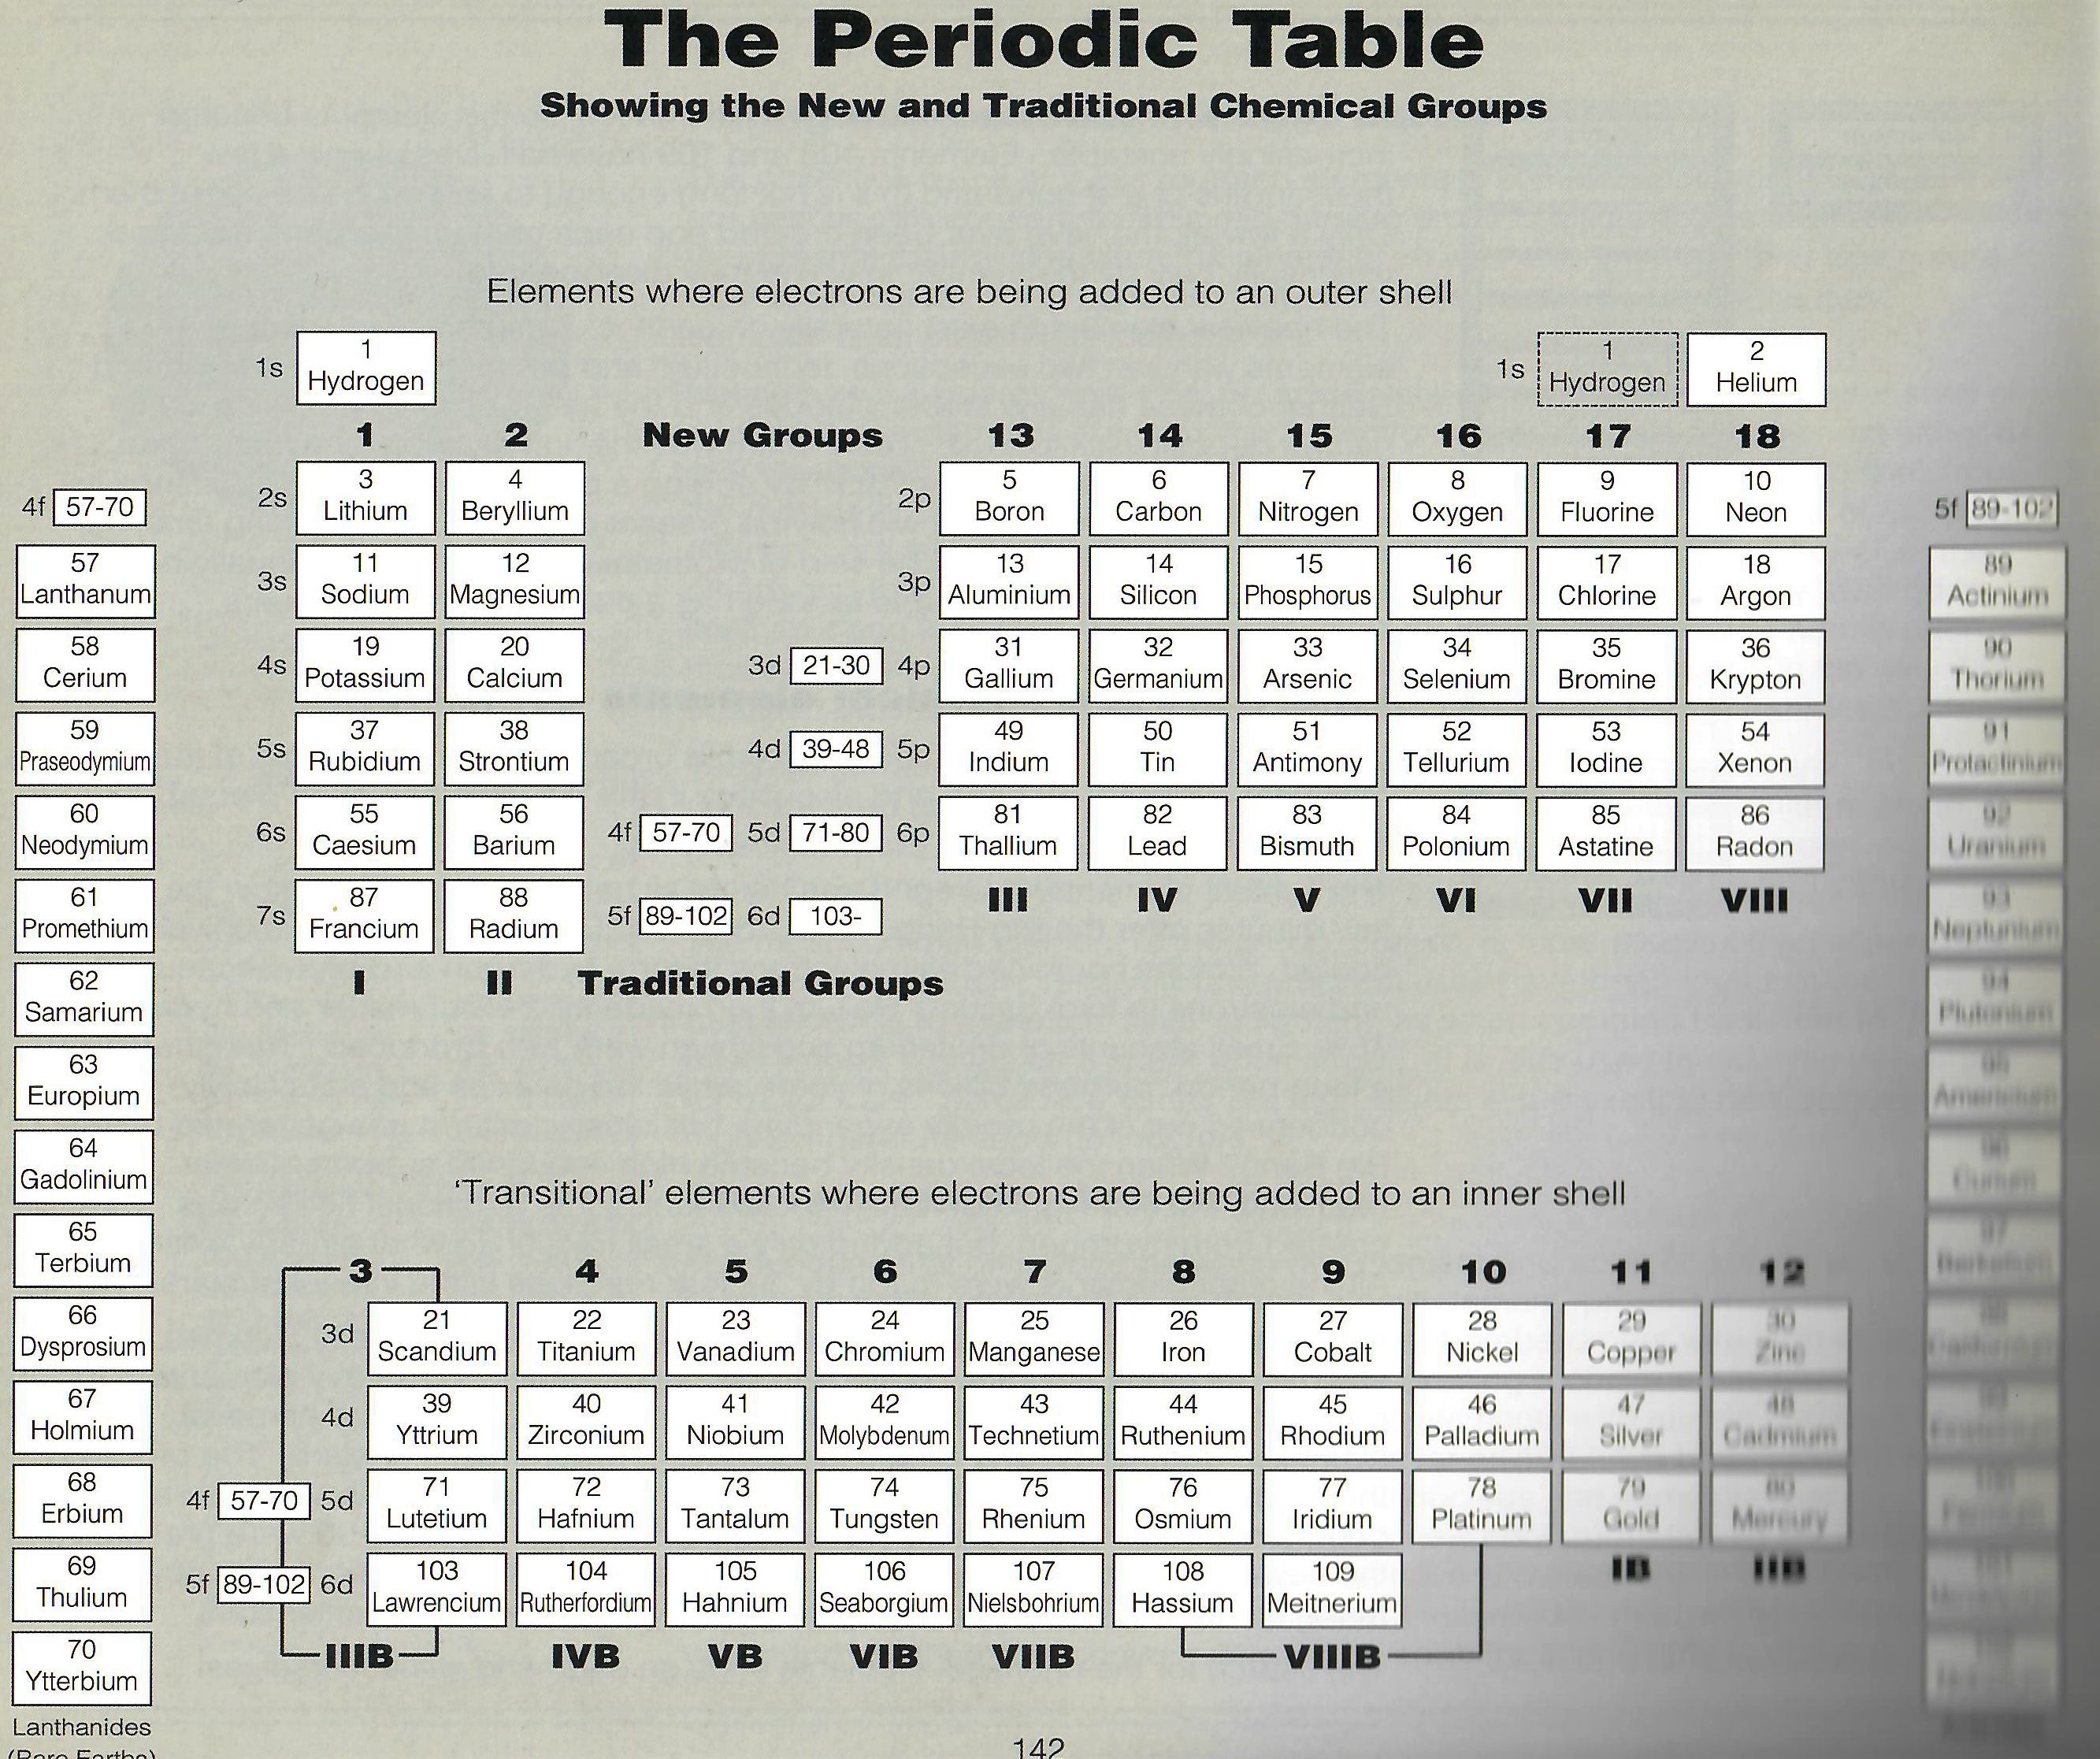
The Chemical Elements: The Fascinating Story of Their Discovery and of the Famous Scientists Who Discovered Them
A book by Nechaev I. and Jenkins G., The Chemical Elements: The Fascinating Story of Their Discovery and of the Famous Scientists Who Discovered Them, Softcover, ISBN 10: 1899618112 ISBN 13: 9781899618118, Tarquin Publications, 1997.
On page 142 this periodic table formulation appears:
Thanks to Eric Scerri for the tip!
See the website EricScerri.com and Eric's Twitter Feed.
| Year: 1936 | PT id = 1406, Type = formulation |
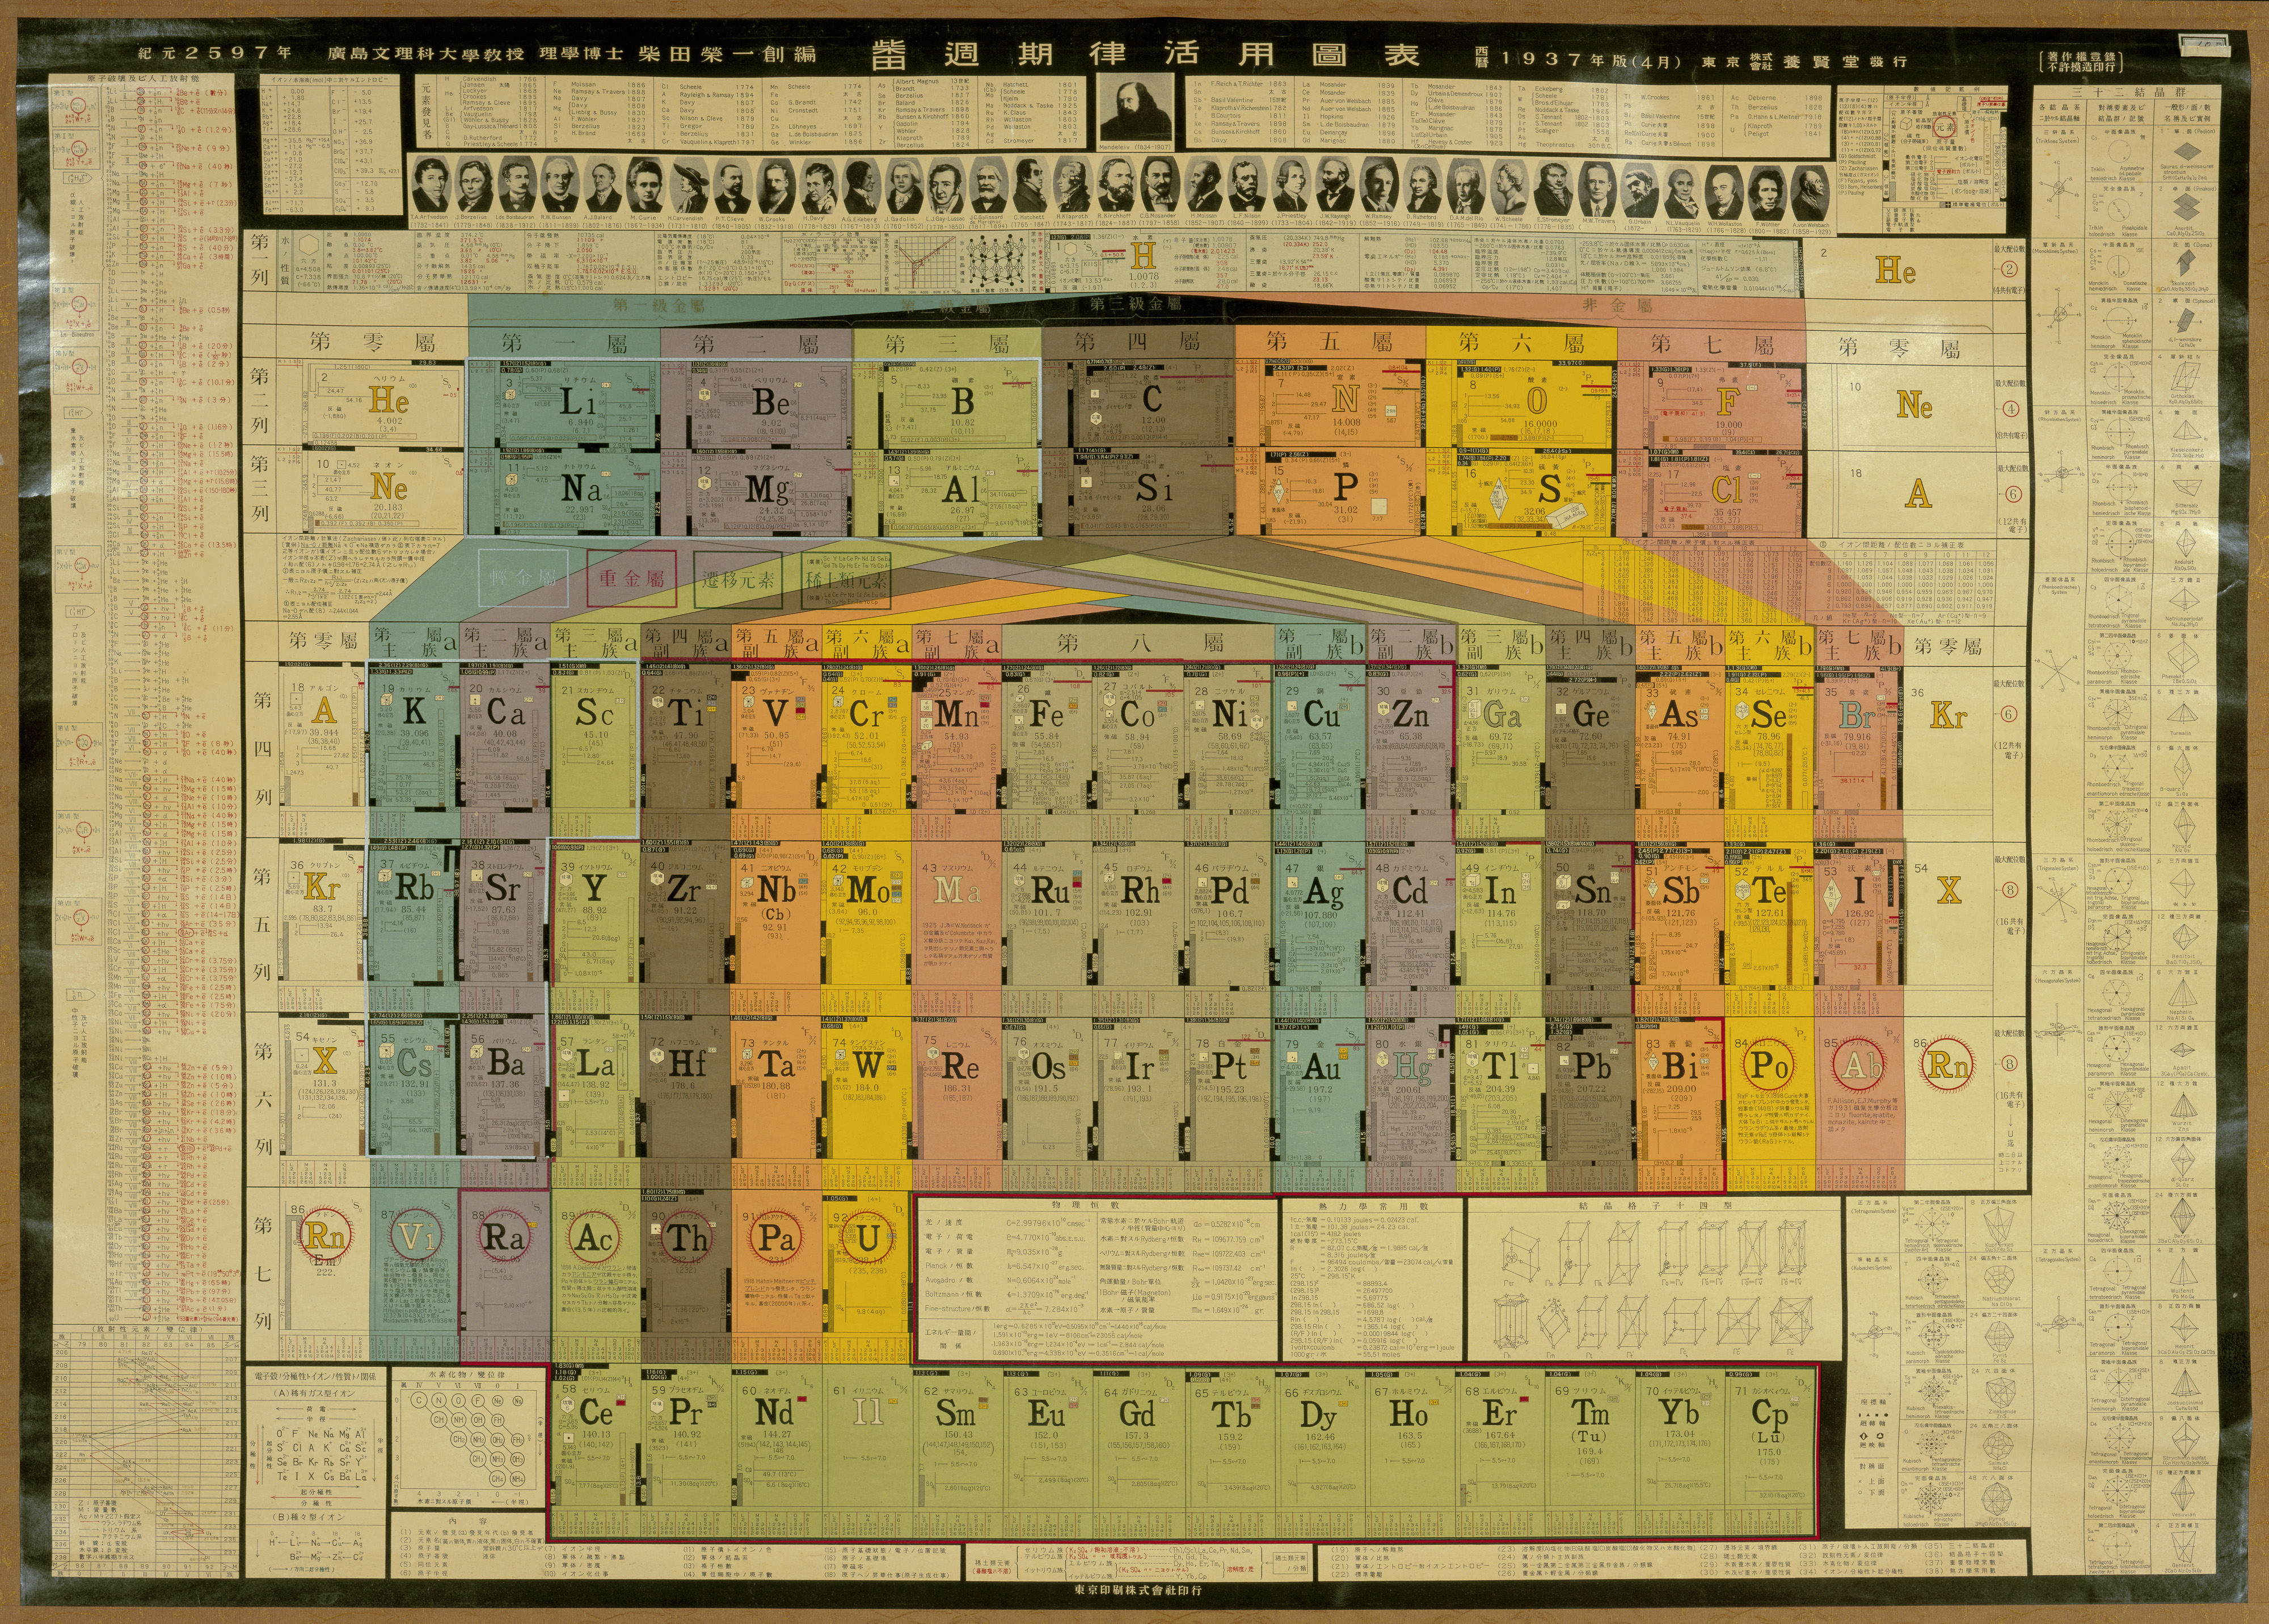
Japanese von Antropoff Format Periodic Table
An interesting Japanese periodic table sent to us by Sam Kidd (link: the Virtual Museum Project) who writes:
"From 1937 and used in Japanese high schools. The periodic table uses the von Antropoff format, and aside from the element data, it also has a data about the half-lives of known radioactive isotopes, physical constants, crystal structures, and much more. Notably it has the claimed elements masurium, illinium, alabamine, and virginium listed."
Click here (or the image) to enlarge.
| Year: 1922 | PT id = 1405, Type = formulation |
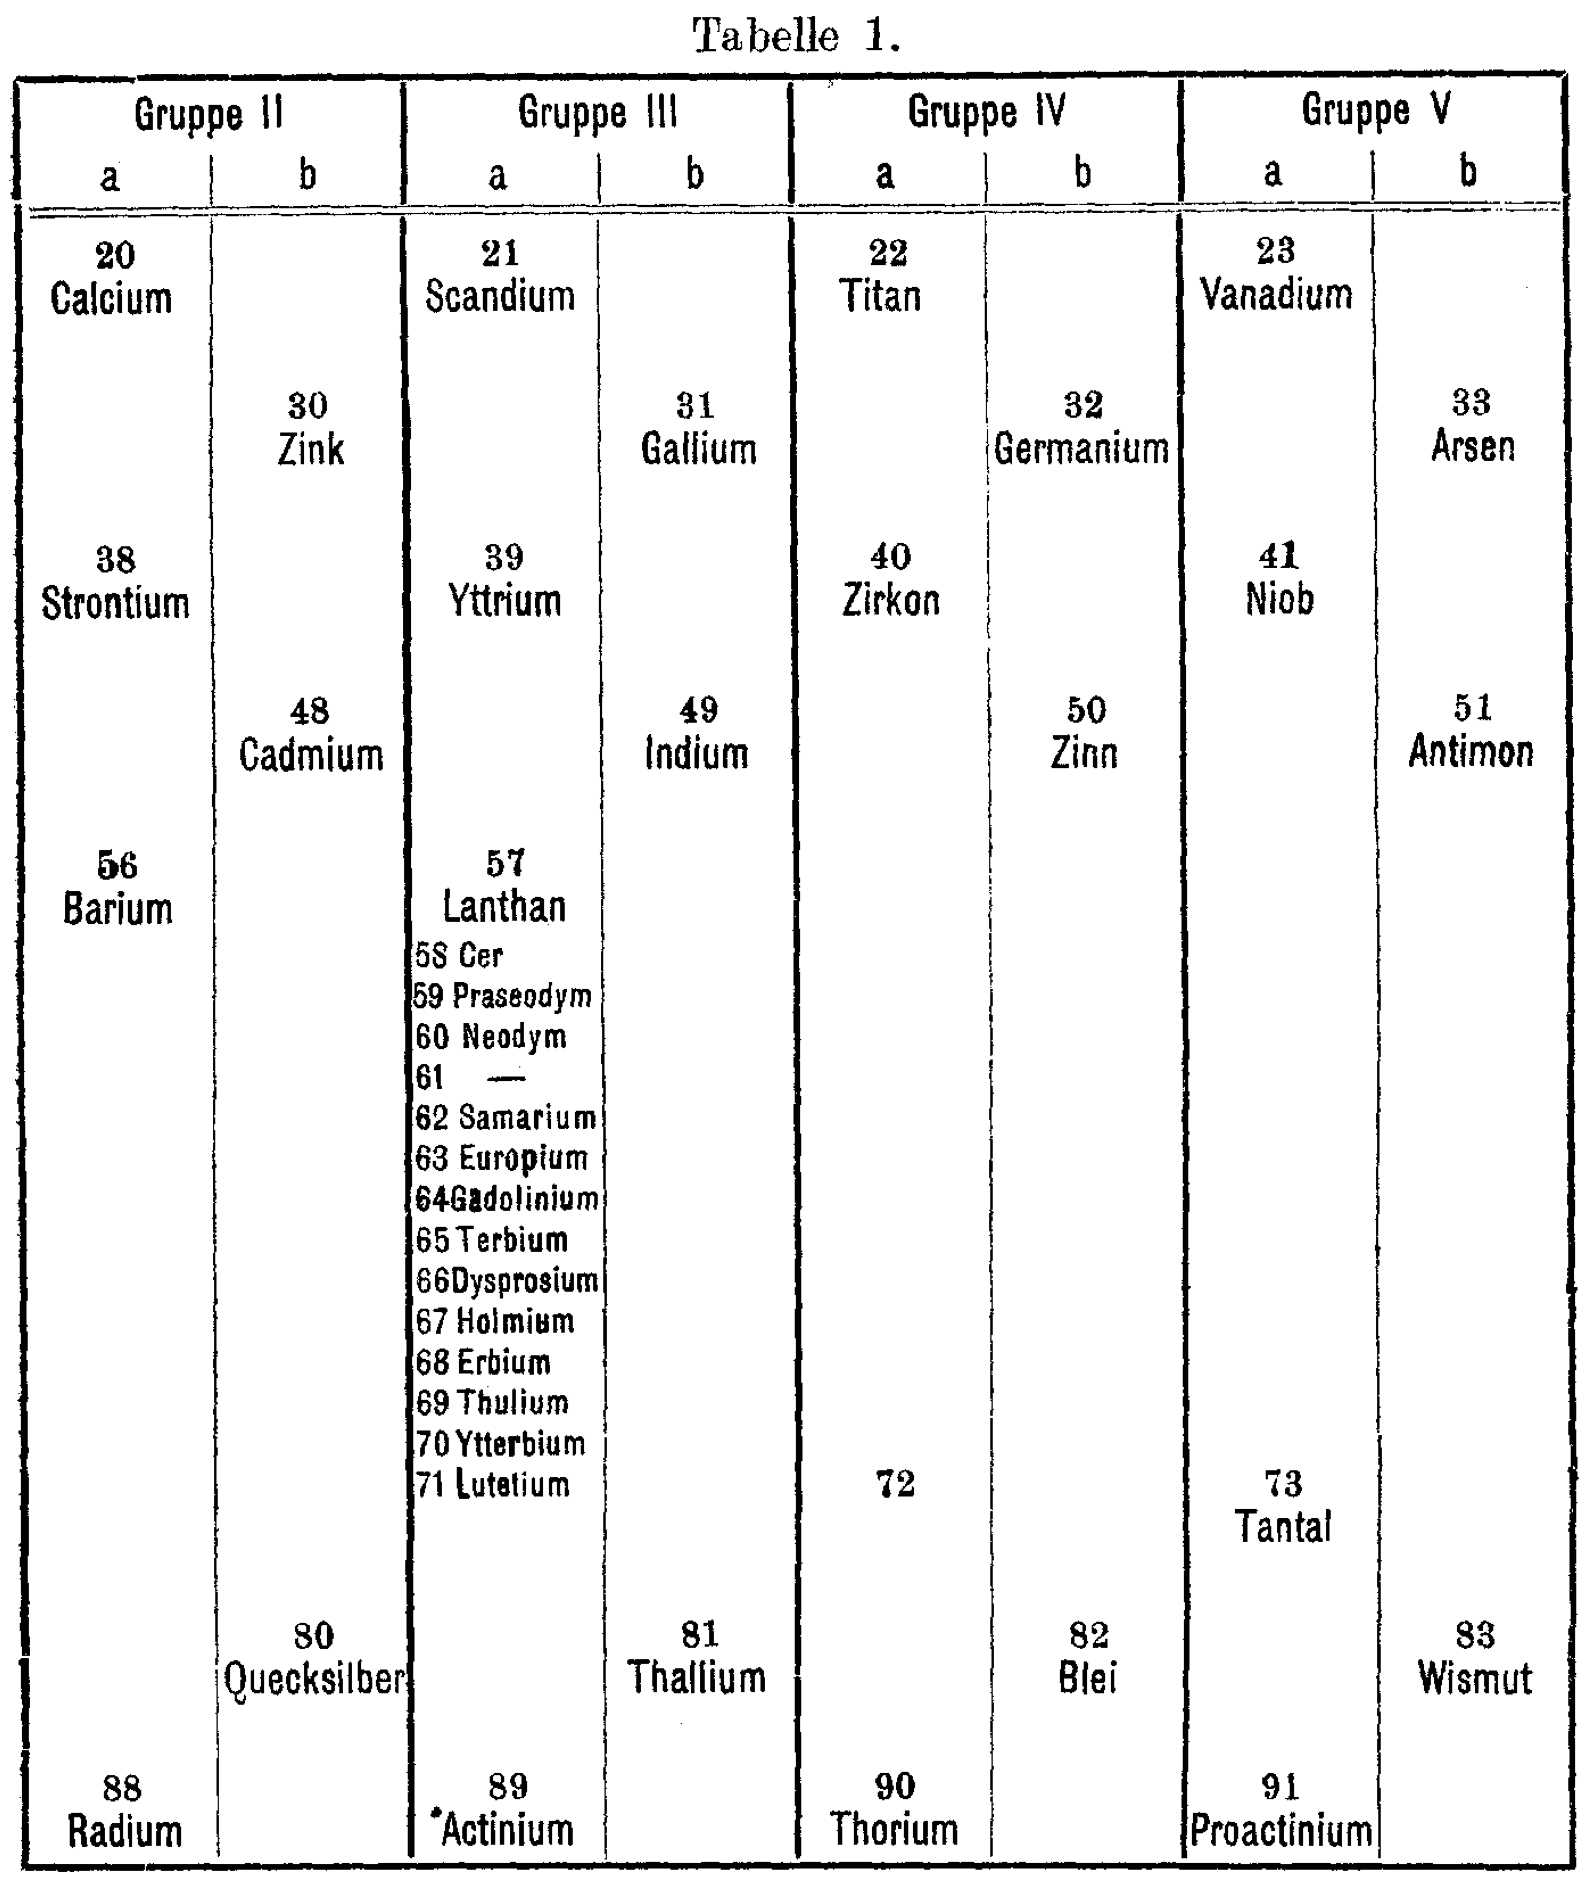
Die seltenen Erden im periodischen System (The Rare Earths in the Periodic System)
C. Renz, "Die seltenen Erden im periodischen System," Zeitschrift für anorganische und allgemeine Chemie (ZAAC), 122, 135-45 (Jan., 1922). View the paper (in German) here.
This article addresses the challenge of placing the growing number of known rare earth elements (lanthanides) into the periodic system. Renz discusses how lower members of the rare earth family fit into the third group (Scandium, Yttrium, Lanthanum), while addressing the placement of elements like Cerium. This work was part of the ongoing effort during that era to refine the periodic table to better accommodate the lanthanide series.
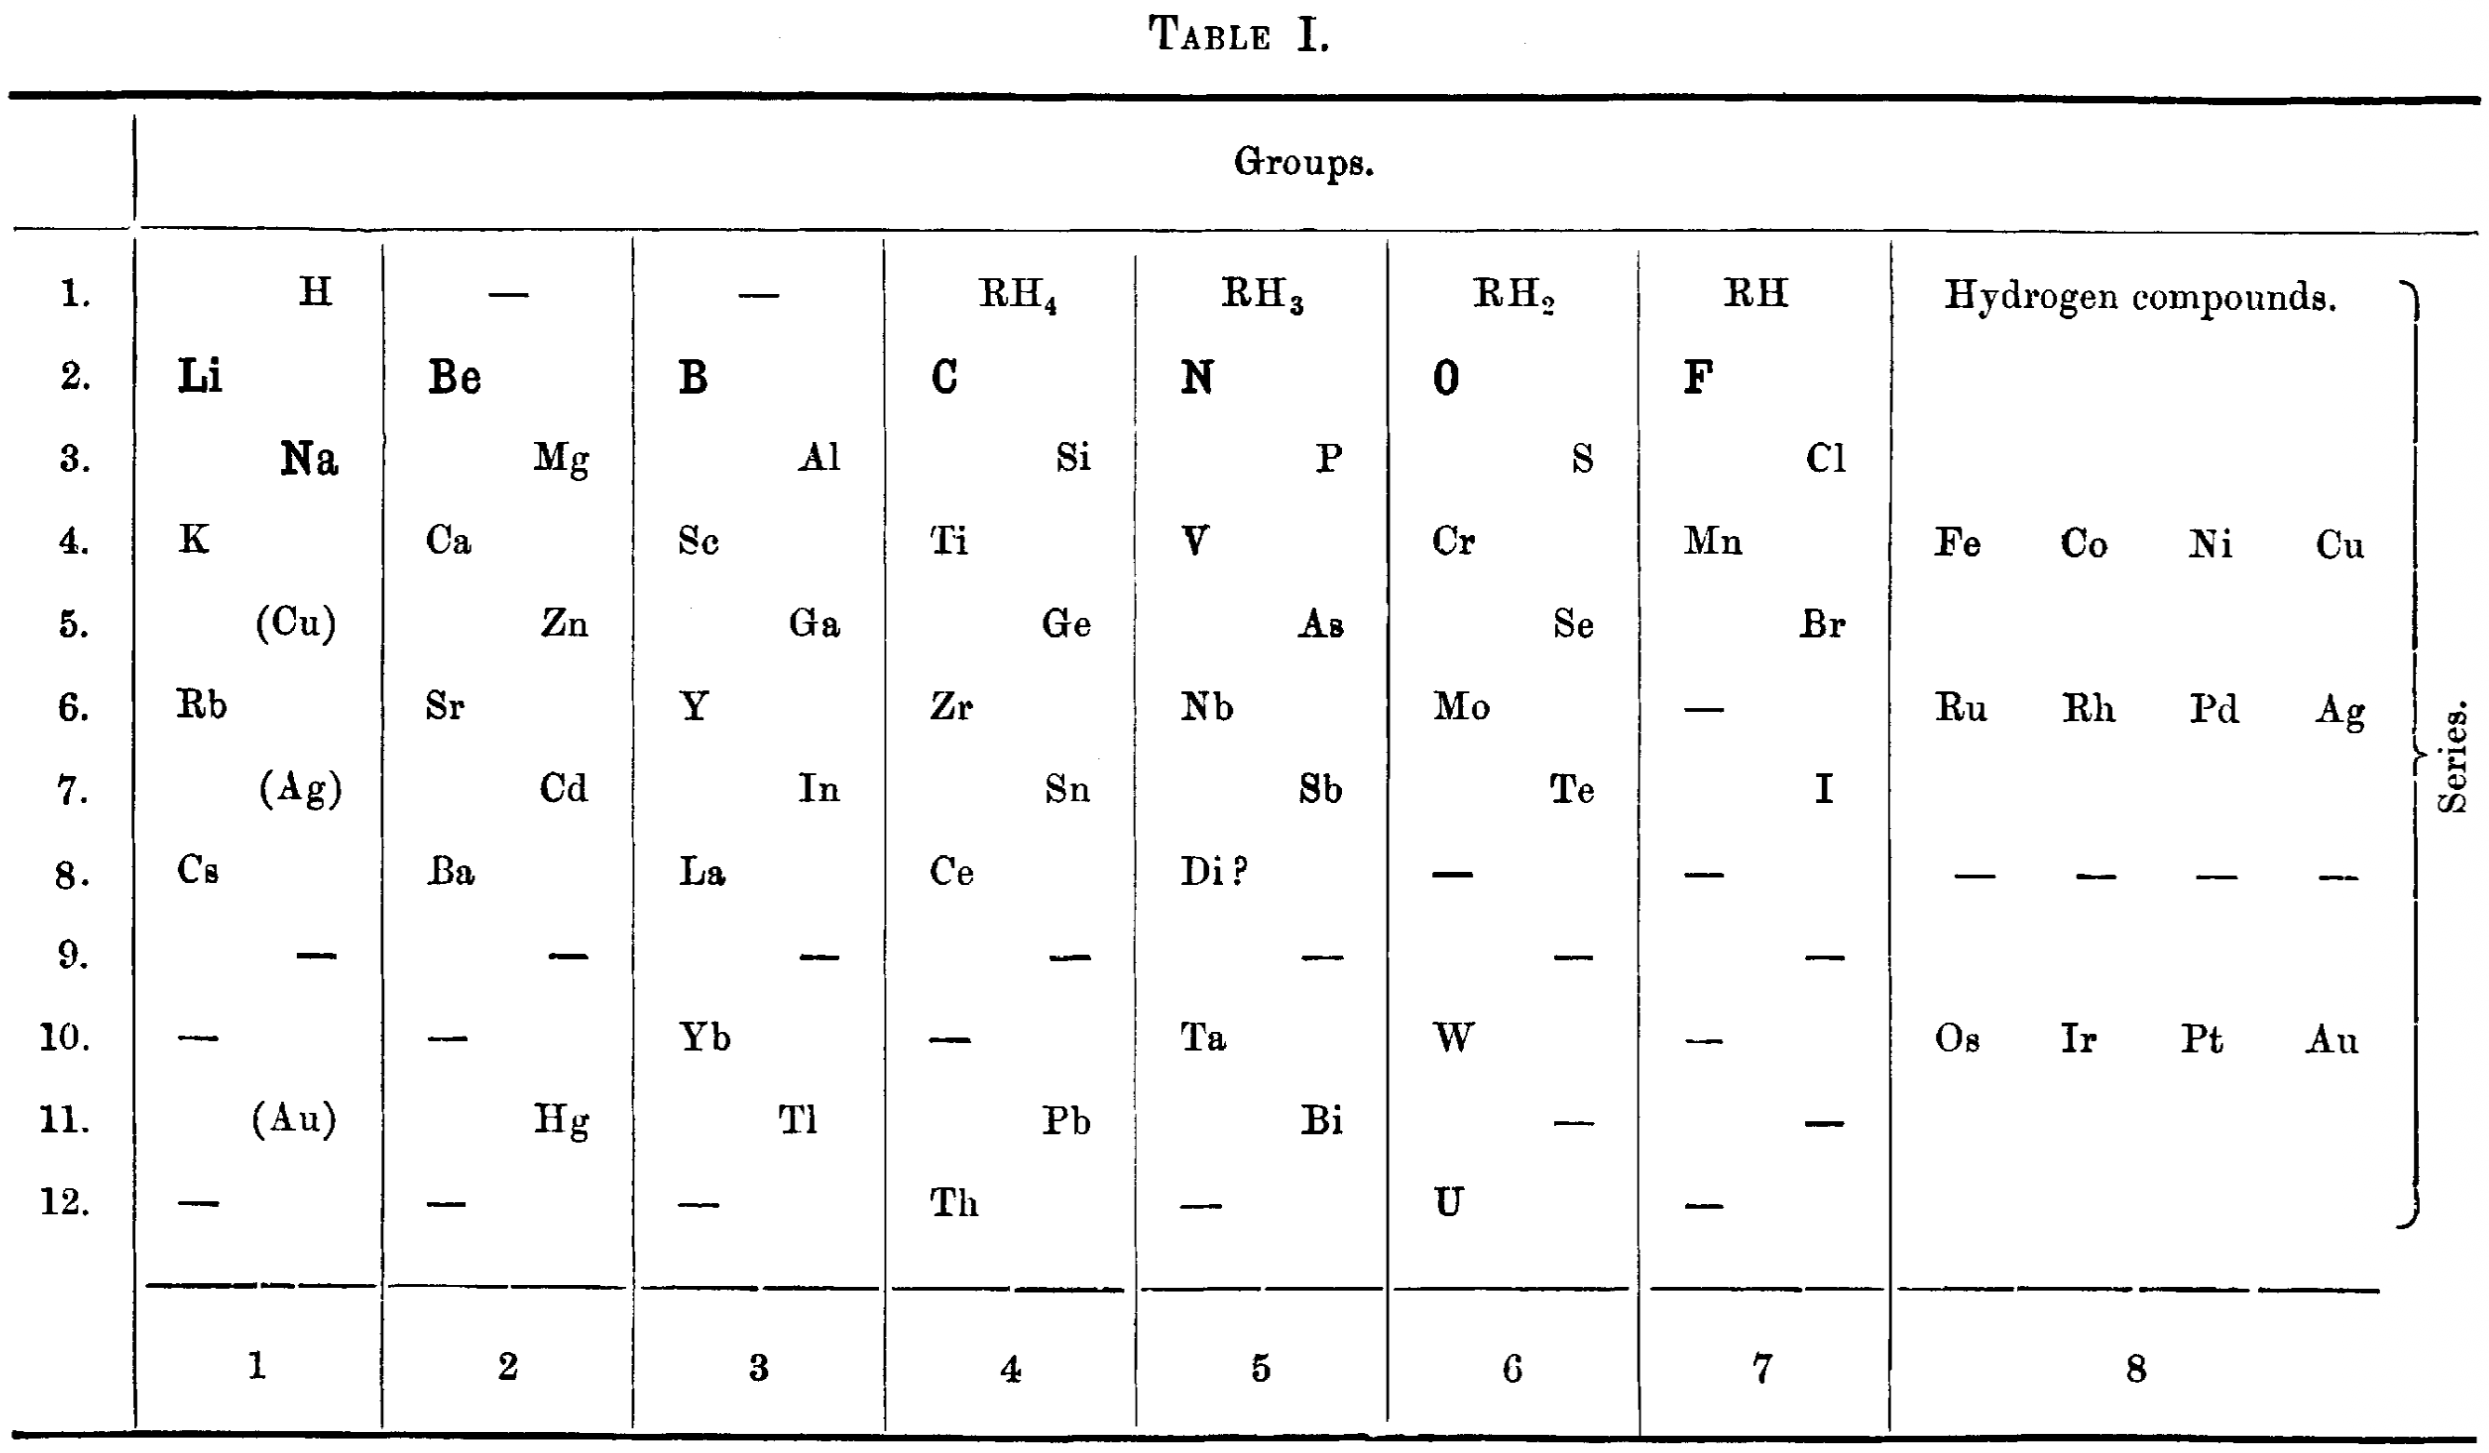
"A suggested improvement in Mendeléeff's table, by vertical elongation, gives space to a single vertical column of all the rare-earth elements in group III, family A."

| Year: 2025 | PT id = 1404, Type = formulation 3D spiral |
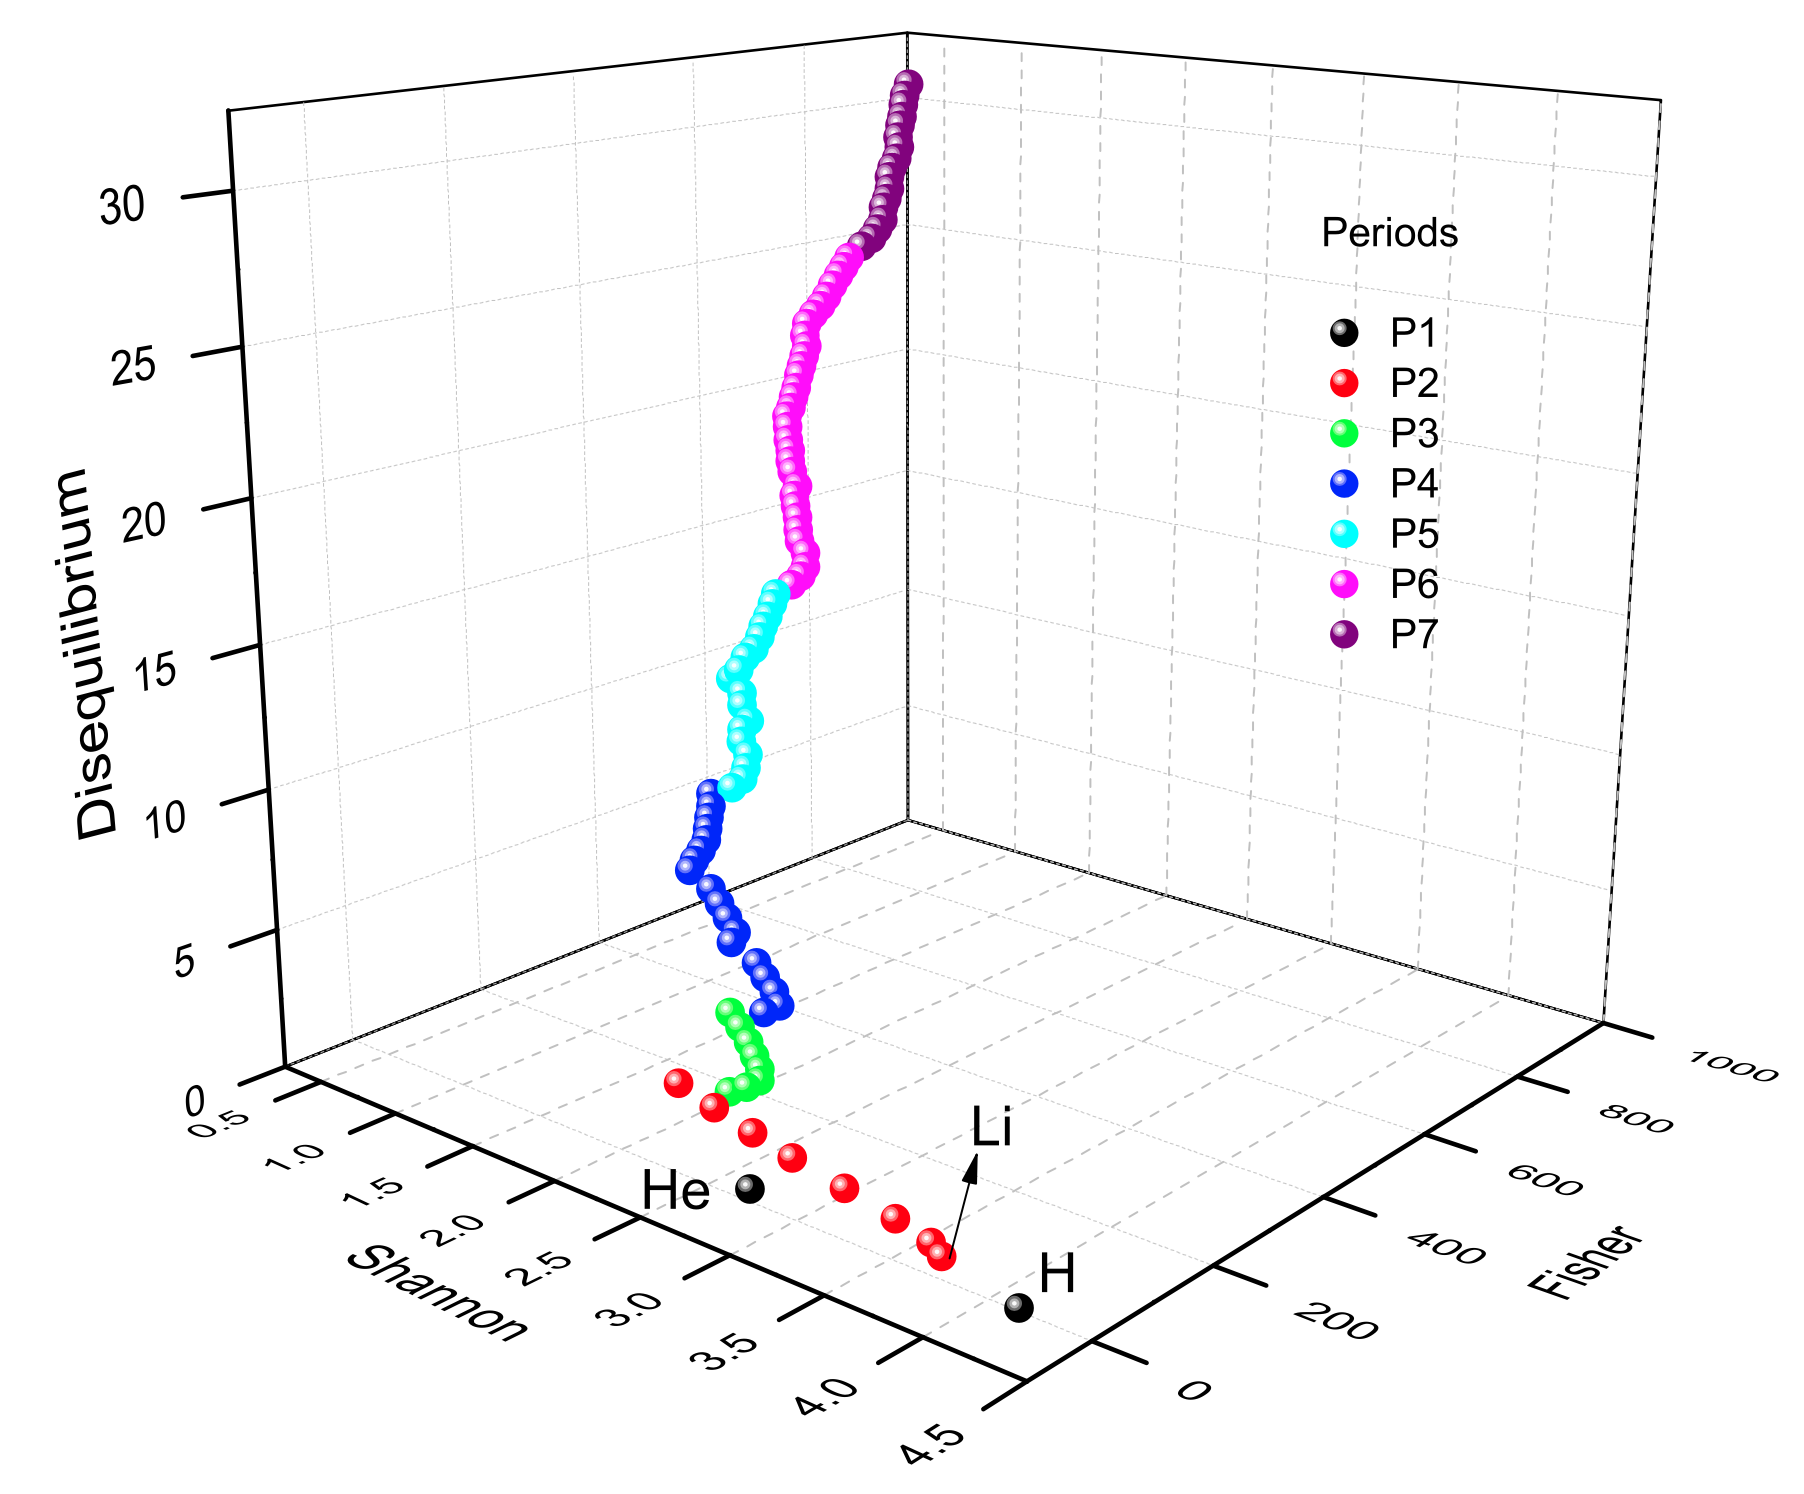
Emergent Helicoidal Manifold Periodic Table
The Periodic Table as an Emergent Helicoidal Manifold: A Unified Information-Theoretic Analysis of the Atomic Elements Z = 1–10, by R.O. Esquivel, Quantum Rep. 2026, 8, 22 https://doi.org/10.3390/quantum8010022
Abstract
Here we perform a detailed information-theoretic (IT) analysis of atomic electron densities in the periodic table, from hydrogen (Z = 1) to lawrencium (Z = 103). By use of the Shannon entropy, the Fisher information and the disequilibrium functionals in both position and momentum spaces as fundamental descriptors of the atomic densities, the periodic table can be represented in a three-dimensional information space as a continuous, highly ordered manifold. The analysis shows that chemical periodicity naturally emerges as a helicoidal manifold (reminiscent of a helix) at the coordinates of a 3D theoretic-information space (Shannon, Fisher, Disequilibrium), with each period forming one segment within the continuous global trajectory. We find information-theoretic signatures of shell structure, sub-shell filling, and electron-configuration anomalies, such as the familiar irregularities seen in chromium and copper. Therefore, the helicoidal character emerges naturally and is not imposed a priori.
Thanks to Eric Scerri for the tip!
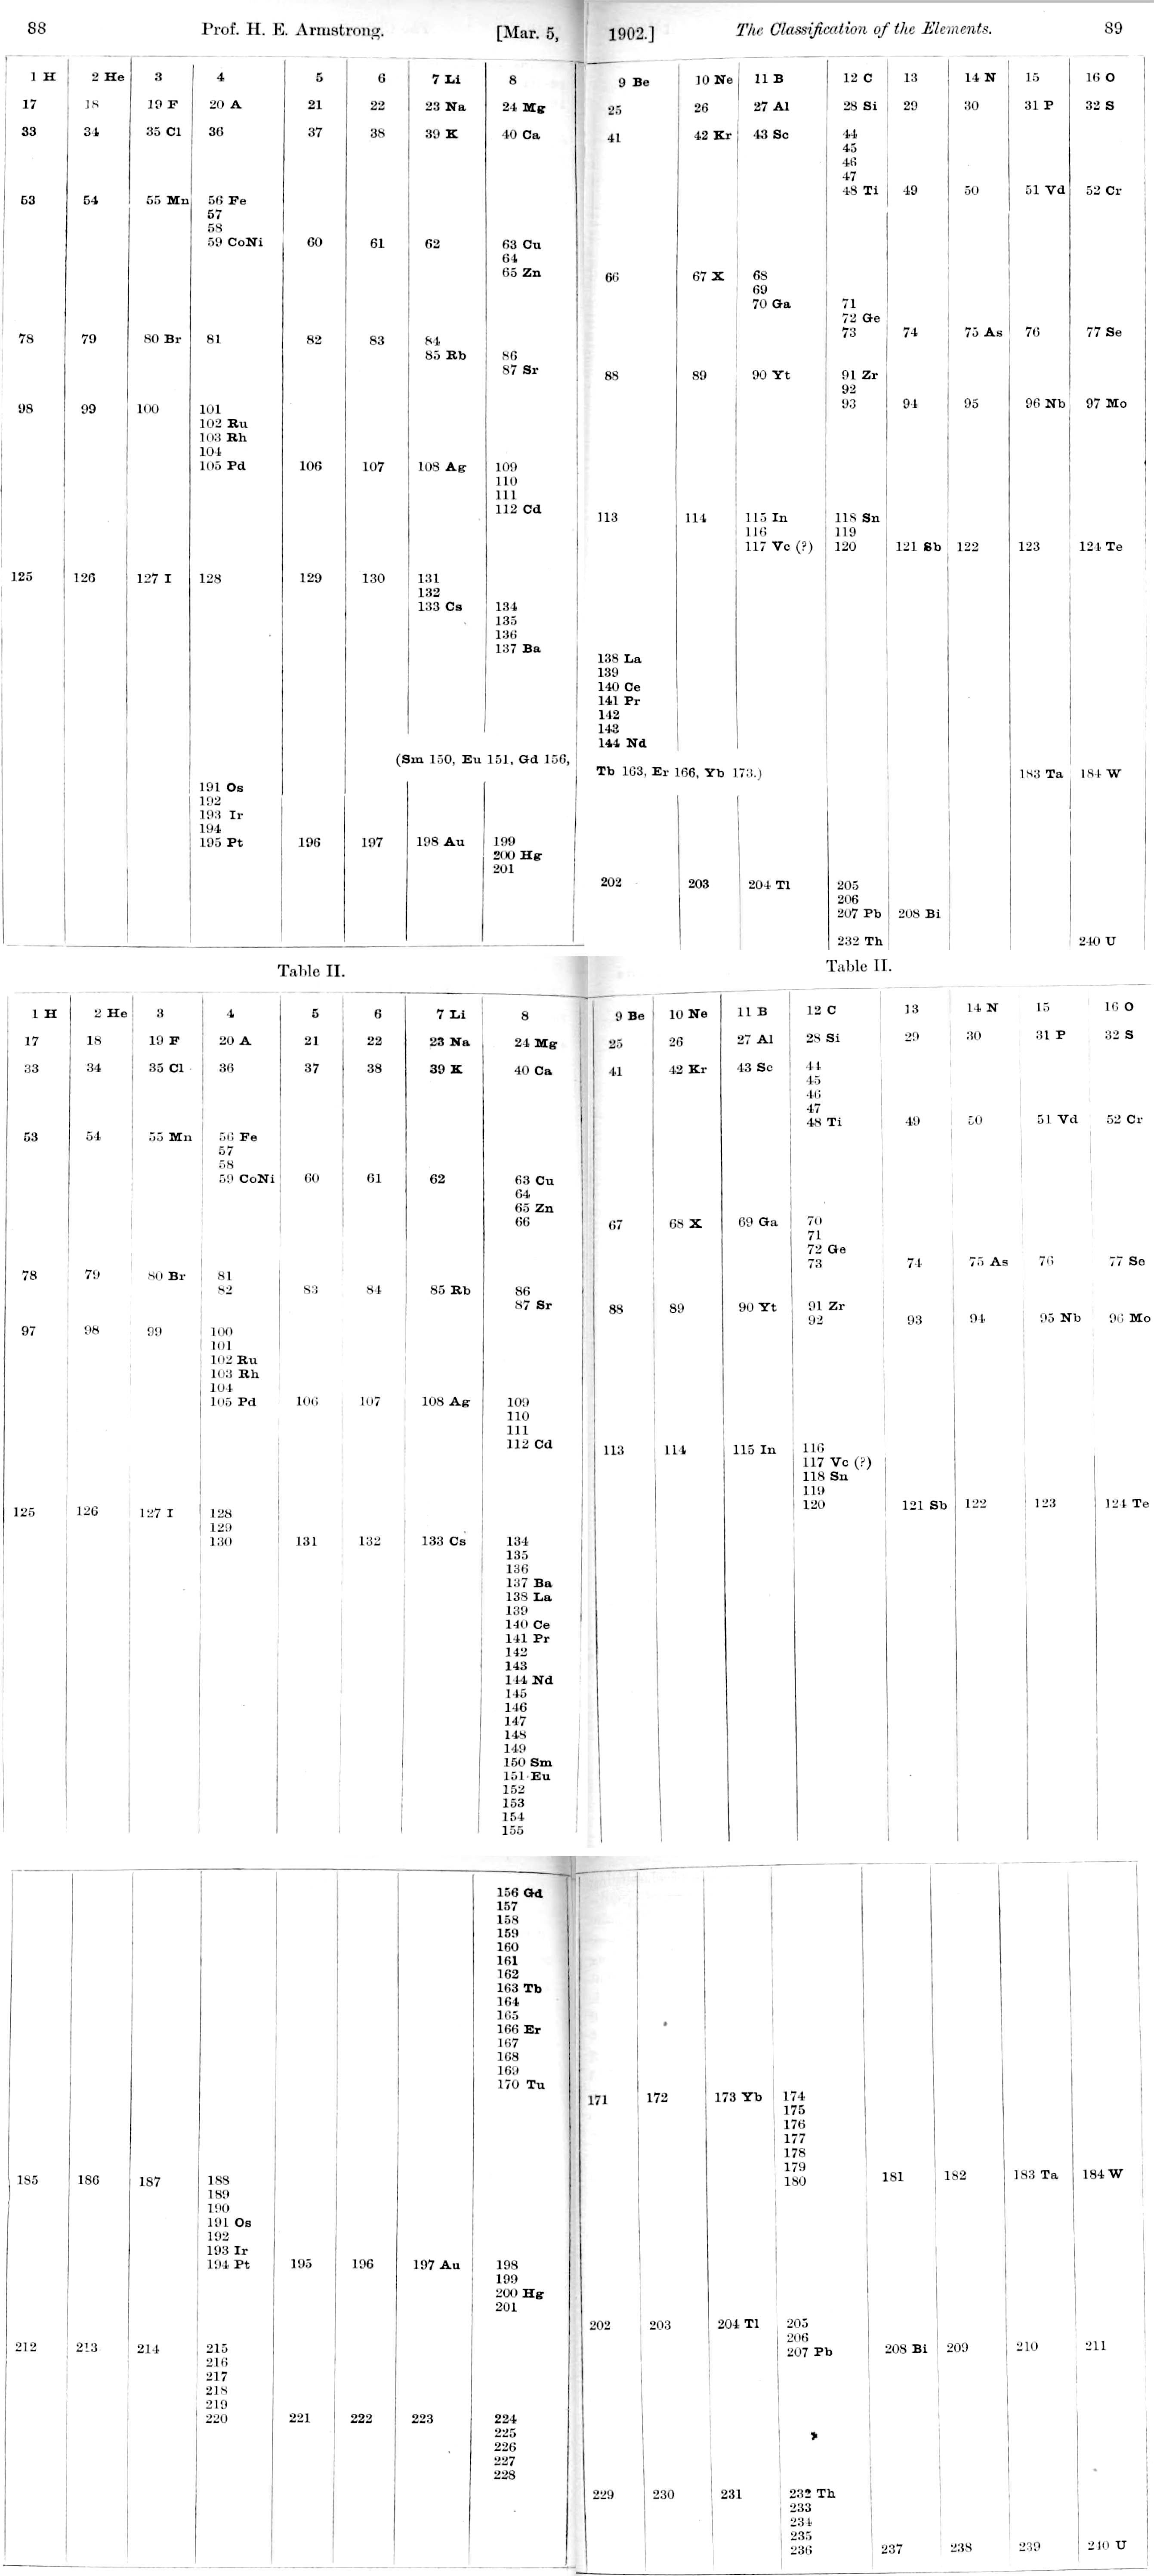
| Year: 1902 | PT id = 1403, Type = formulation |
Armstrong's Classification of The Elements
Henry Edward Armstrong; The classification of the elements. Proc. R. Soc. 30 September 1902; 70 (459-466): 86–94. https://doi.org/10.1098/rspl.1902.0012
Abstract:
Although no direct evidence acceptable to chemists has been adduced which in any way justifies the belief that the elements are decomposible, it is impossible to resist the conclusion that they are genetically related, so closely in many respects do they resemble a series of related compounds, especially when regarded from the point of view of the organic chemist. The generalisation known as the Periodic Law is in itself a justification of this view: the manner in which interrelationship becomes manifest when they are classified in accordance with its canons, being probably the strongest of all the arguments which can be cited as tending to show that the elements are compounds—but compounds very different from those with which we are accustomed to deal. Even in the form in which it was put forward by Mendeleeff, however, the periodic generalisation is but a first approximation: and the great Russian has himself pointed out that it needs improvement and development. As chemists are beginning to recognise this, I venture to submit a scheme of classification which I have been led to draw up in writing an article for the forthcoming Supplement to the ‘Encyclopedia Britannica.’ The article, I may say, was sent to press in May, 1900 and the first proof before me is dated November 20, 1900.
| Year: 1893 | PT id = 1402, Type = formulation weight |
Deeley's New Diagram and Periodic Table of The Elements
R. M. Deeley's 1893 publication, A new diagram and periodic table of the elements, was published in the Journal of the Chemical Society, Transactions (Vol. 63, pp. 852–867).
Key Features of Deeley's 1893 Periodic Table:
- Structure: Deeley proposed a table consisting of nine columns (or groups).
- Arrangement: The table sought to arrange the elements more in accordance with their physical and chemical properties than previous attempts.
- Design Specifics: The Lithium (Li) and Sodium (Na) periods were read from right to left.
- Diagrammatic Representation: The paper included a diagram plotting atomic weights against "atomic volumes" (or other physical properties) to show the periodicity of the elements.
- Series and Curves: Deeley suggested that the elements lie along a curve (similar to those produced by Lothar Meyer) and suggested that there are several lines for the same series with fixed inclinations to one another.
This work aimed to address some of the irregularities found in earlier periodic classifications, particularly regarding the properties of elements with lower atomic weights, by visualizing the periodicity through a specific diagrammatic layout.


| Year: 1883 | PT id = 1401, Type = formulation |
Gretschel & Bornemann
H. Gretschel and G. Bornemann, "Das natürlische System der Elemente", Jahrbuch der Erfindungen, 19th Jahrgang, pp. 241-306 (Oct., 1883).
This formulation is cited by Quam & Quam (1934) and redrawn by Mazurs (1957).
Image from The Science History Institute.
|
|
| What is the Periodic Table Showing? | Periodicity |
© Mark R. Leach Ph.D. 1999 –
Queries, Suggestions, Bugs, Errors, Typos...
If you have any:
Queries
Comments
Suggestions
Suggestions for links
Bug, typo or grammatical error reports about this page,please contact Mark R. Leach, the author, using mark@meta-synthesis.com
This free, open access web book is an ongoing project and your input is appreciated.