Periodic Table |
 |
 |
 |
 |
 |
 |
| What is the Periodic Table Showing? | Periodicity |
The INTERNET Database of Periodic Tables
There are thousands of periodic tables in web space, but this is the only comprehensive database of periodic tables & periodic system formulations. If you know of an interesting periodic table that is missing, please contact the database curator: Mark R. Leach Ph.D. The database holds information on periodic tables, the discovery of the elements, the elucidation of atomic weights and the discovery of atomic structure (and much, much more).
Periodic Tables from the year 1948 :
| 1948 | Segrè Chart of Elements & Isotopes |
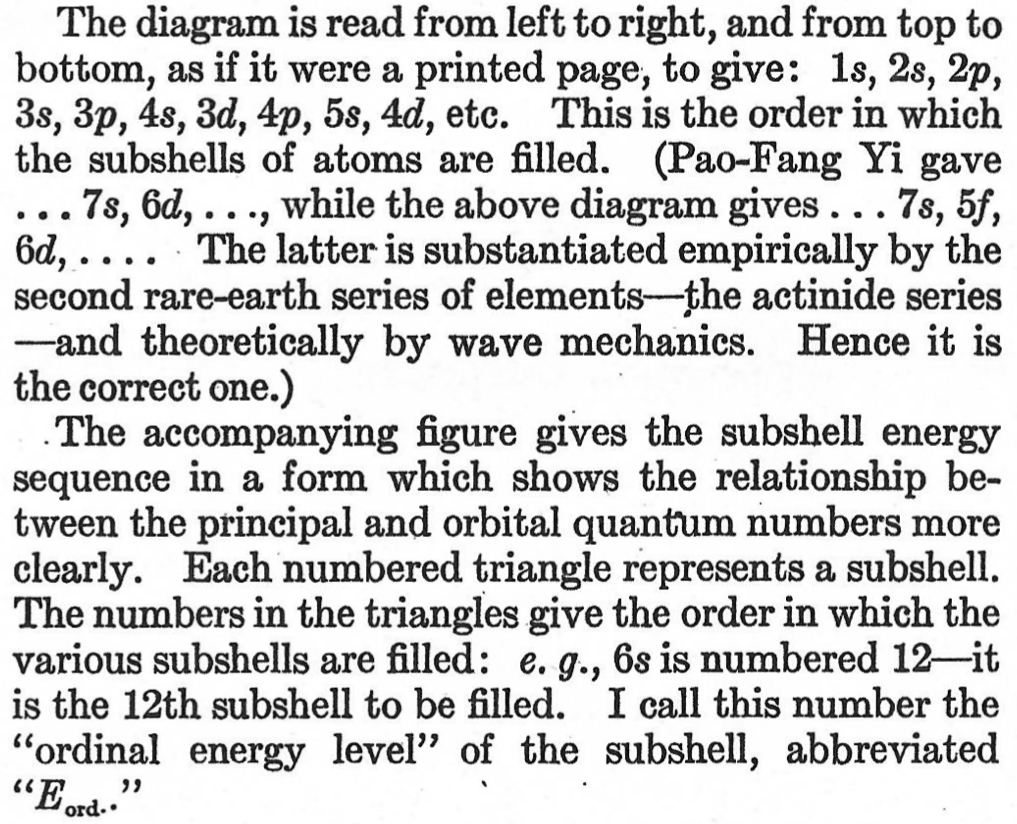
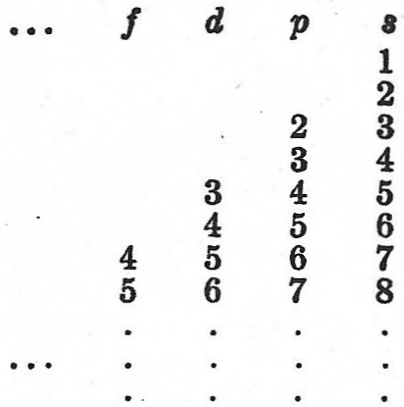
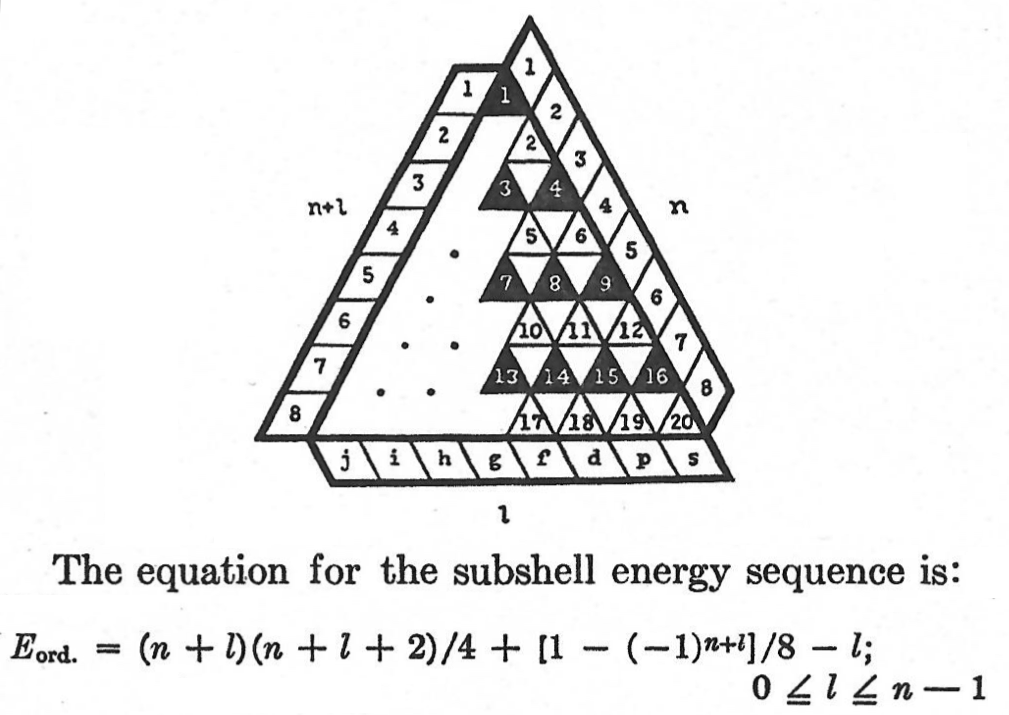
| 1948 | Hakala's Electronic Orbital Filling |
| 1948 | Segrè Chart (Original) |
| Year: 1948 | PT id = 231, Type = formulation misc |
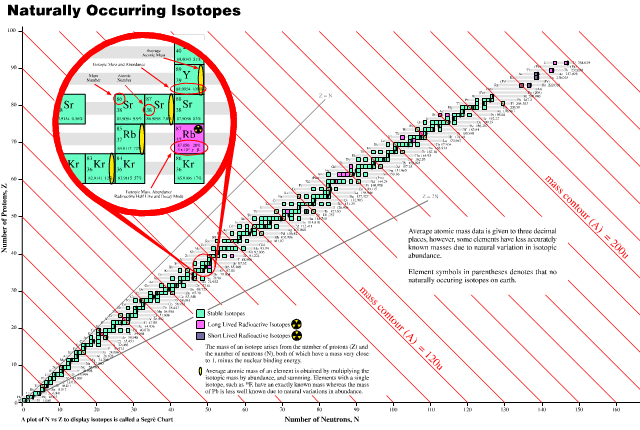
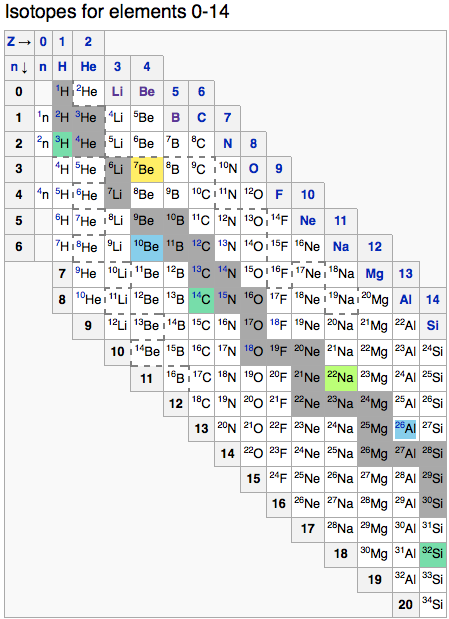
Segrè Chart of Elements & Isotopes
The Segrè chart of elements and isotopes arranges atomic nuclei by numbers or protons and numbers of neutrons and is a table of nuclides. There are various ways the axes can be arranged. From elsewhere in this chemogenesis web book:
And from Wikipedia:
| Year: 1948 | PT id = 1142, Type = formulation |
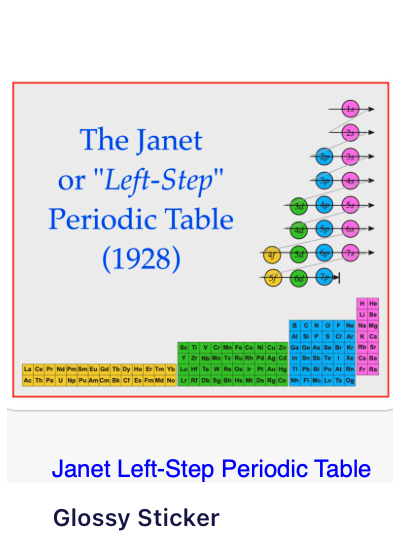
Hakala's Electronic Orbital Filling
Hakala, R.W., Letter to The Editor, J. Chem. Ed. 25, 229, 1948
Thanks to Eric Scerri for the tip!
See the website EricScerri.com and Eric's Twitter Feed.
| Year: 1948 | PT id = 1380, Type = formulation structure data |
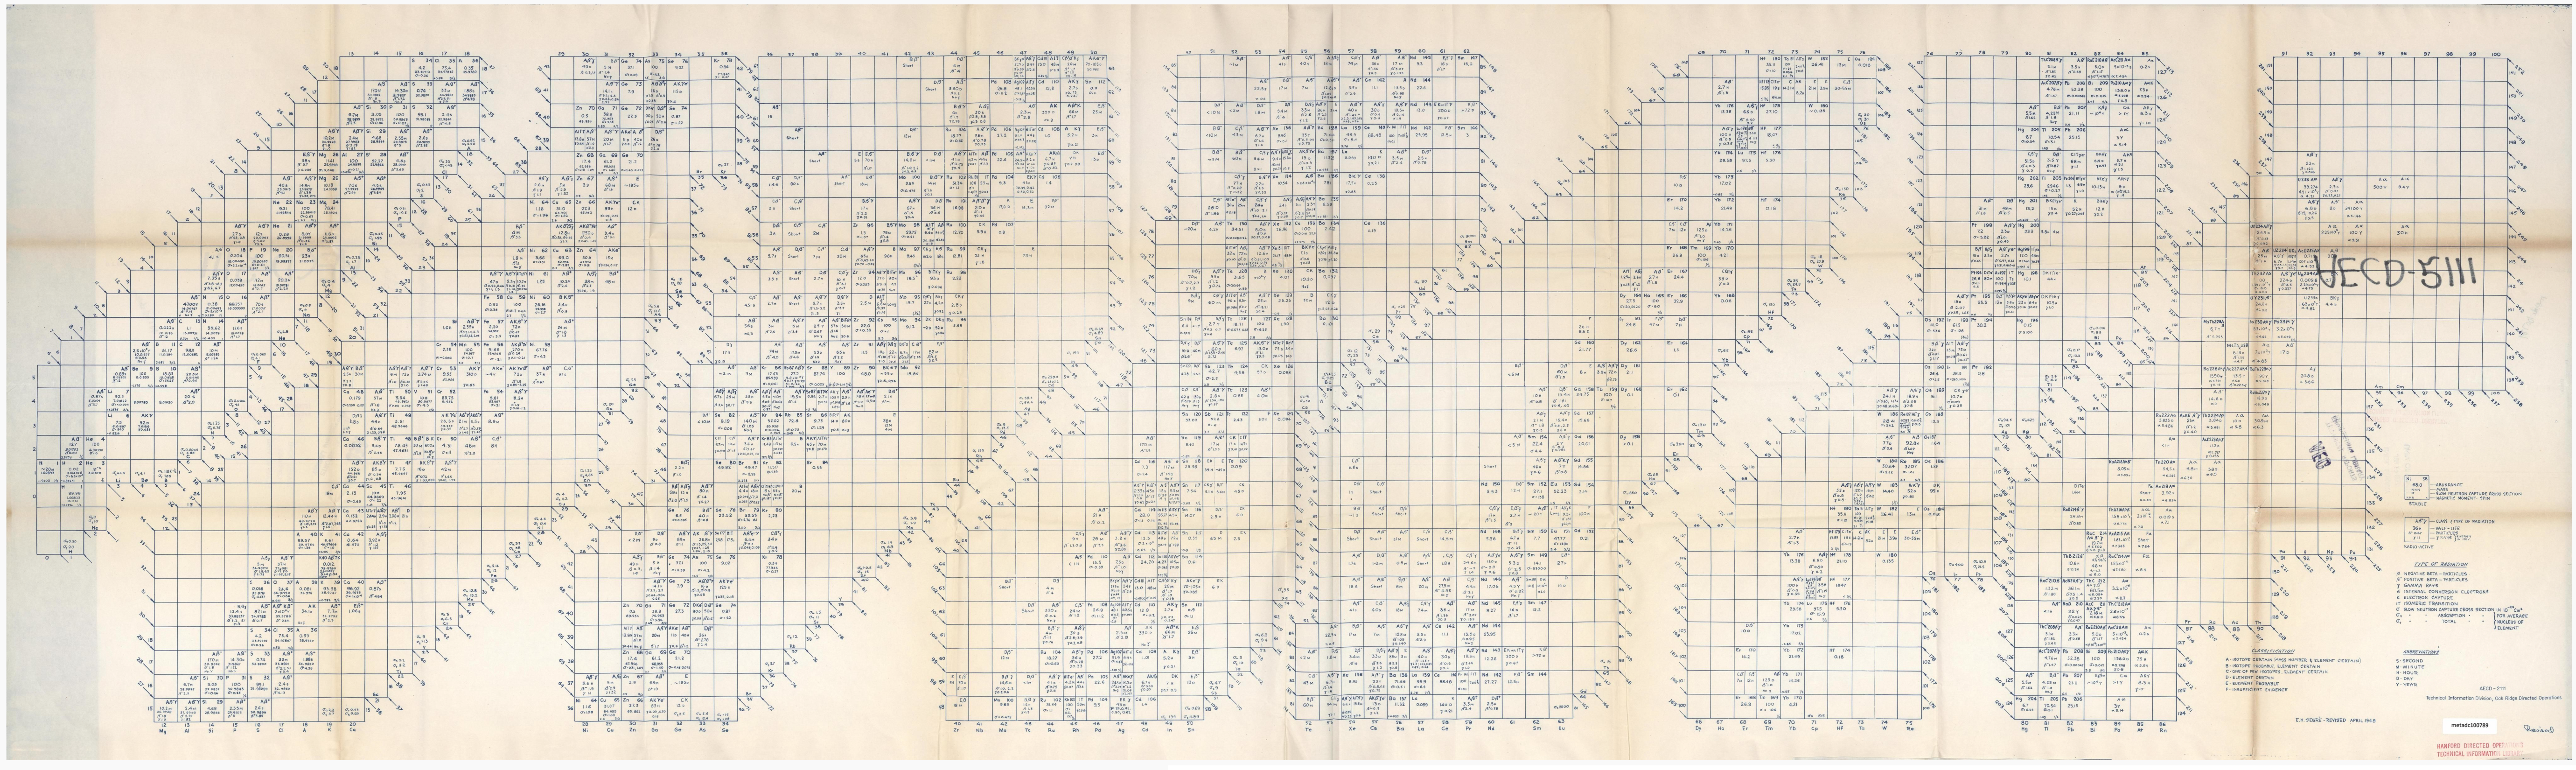
Segrè Chart (Original)
Segrè, Emilio. Segrè Chart [Isotope Chart], technical drawing, April 1948; Oak Ridge, Tennessee. (https://digital.library.unt.edu/ark:/67531/metadc100789/: accessed February 17, 2026), University of North Texas Libraries, UNT Digital Library, https://digital.library.unt.edu; crediting UNT Libraries Government Documents Department.
"A table or chart of nuclides is a two-dimensional graph of isotopes of the chemical elements, in which one axis represents the number of neutrons (symbol N) and the other represents the number of protons (atomic number, symbol Z) in the atomic nucleus. Each point plotted on the graph thus represents a nuclide of a known or hypothetical element. This system of ordering nuclides can offer a greater insight into the characteristics of isotopes than the better-known periodic table, which shows only elements and not their isotopes. The chart of the nuclides is also known as the Segrè chart, after Italian physicist Emilio Segrè."
Click Image to Enlarge:

|
|
| What is the Periodic Table Showing? | Periodicity |
© Mark R. Leach Ph.D. 1999 –
Queries, Suggestions, Bugs, Errors, Typos...
If you have any:
Queries
Comments
Suggestions
Suggestions for links
Bug, typo or grammatical error reports about this page,please contact Mark R. Leach, the author, using mark@meta-synthesis.com
This free, open access web book is an ongoing project and your input is appreciated.